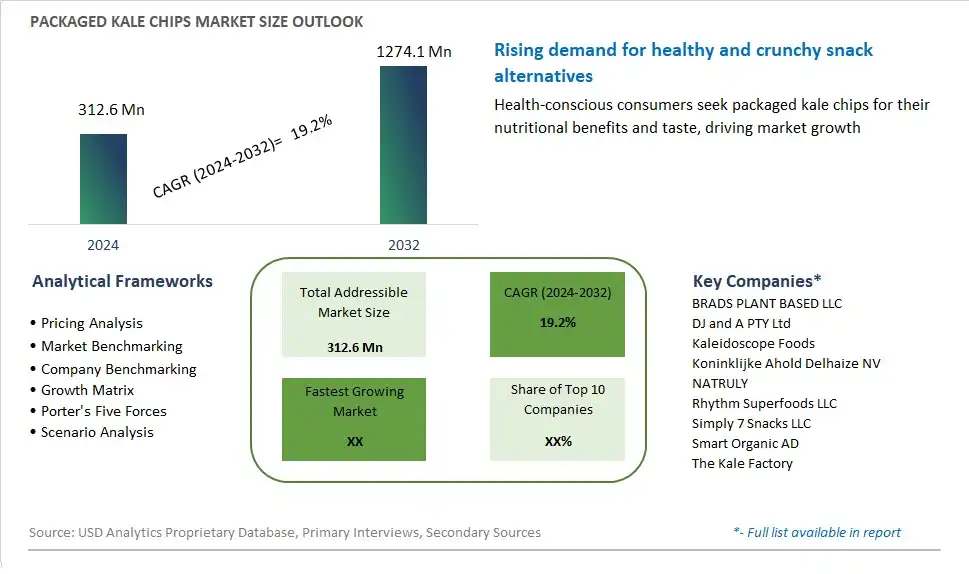
Global Packaged Kale Chips Market Size is valued at $312.6 Million in 2024 and is forecast to register a growth rate (CAGR) of 19.2% to reach $1274.1 Million by 2032.
The global Packaged Kale Chips Market Comprehensive Study analyzes and forecasts the market size across 6 regions and 24 countries for diverse segments -By Product (Chips or crisps, Extruded snacks), By Distribution Channel (Offline, Online)
An Introduction to Packaged Kale Chips Market
In 2024, the market for packaged kale chips continues to expand as consumers seek healthier and more convenient snack options. Kale chips are crispy, flavorful snacks made from kale leaves that have been seasoned and baked or dehydrated until crisp. Packaged kale chips offer a convenient and portable alternative to traditional potato chips and other high-calorie snacks, providing a satisfying crunch with fewer calories and more nutritional benefits. These products come in a variety of flavors, ranging from classic sea salt to spicy sriracha and cheesy nacho, appealing to different taste preferences. With their reputation as a nutrient-dense superfood, kale chips are sought after by health-conscious consumers looking to incorporate more greens into their diets without sacrificing flavor or convenience. Moreover, packaged kale chips are often gluten-free, vegan, and free from artificial additives, appealing to consumers with dietary restrictions or preferences. As snacking continues to evolve towards healthier and more mindful choices, the market for packaged kale chips is expected to continue growing, driven by their appeal to consumers seeking nutritious, flavorful, and convenient snack options.
Packaged Kale Chips Competitive Landscape
The market report analyses the leading companies in the industry including BRADS PLANT BASED LLC , DJ and A PTY Ltd, Kaleidoscope Foods, Koninklijke Ahold Delhaize NV, NATRULY, Rhythm Superfoods LLC, Simply 7 Snacks LLC, Smart Organic AD, The Kale Factory, and Others.
Packaged Kale Chips Market Dynamics
Packaged Kale Chips Market Trend: Increasing Demand for Healthy Snack Alternatives
Growing consumer interest in health and wellness has sparked a trend towards seeking healthier snack alternatives, driving the popularity of packaged kale chips. With rising concerns about obesity and chronic diseases, consumers are actively looking for snacks that offer nutritional benefits without sacrificing taste. Packaged kale chips, made from nutrient-rich kale leaves, are perceived as a guilt-free snack option that provides vitamins, minerals, and fiber, making them a preferred choice among health-conscious individuals. This trend is fueled by the desire for convenient and satisfying snacks that support a healthy lifestyle, contributing to the steady growth of the packaged kale chips market.
Market Driver: Shift Towards Plant-Based and Clean-Label Snacks
One of the primary drivers behind the growth of the packaged kale chips market is the shift towards plant-based and clean-label snacks. As consumers become more mindful of their dietary choices and seek transparency in food ingredients, there is a growing preference for snacks made from natural, whole-food ingredients. Packaged kale chips align with this demand, as they are typically made with minimal, recognizable ingredients and are free from artificial additives, preservatives, and GMOs. The rise of plant-based diets, veganism, and clean eating trends has further accelerated the adoption of packaged kale chips as a wholesome and nutritious snack option, driving market growth.
Market Opportunity: Innovation in Flavor Profiles and Packaging Formats
An opportunity for market expansion in the packaged kale chips segment lies in innovation focused on flavor profiles and packaging formats. While traditional kale chips come in flavors like sea salt or cheesy, there is potential to introduce new and innovative flavor combinations inspired by global cuisines and culinary trends. Manufacturers can explore options such as spicy sriracha, tangy barbecue, or savory herb-infused varieties to cater to diverse taste preferences and attract new consumer segments. Additionally, there is scope for innovation in packaging formats, such as single-serve packs, resealable pouches, or multipack options, to offer consumers greater convenience and portion control. By continuously innovating and diversifying their product offerings, companies can capitalize on opportunities to capture market share and meet the evolving needs of consumers in the packaged kale chips market.
Packaged Kale Chips Market Share Analysis: Chips or Crisps held the dominant market share in 2024
In the Packaged Kale Chips Market segmented by product, Chips or Crisps emerge as the largest segment. This dominance can be attributed to several factors. Firstly, chips or crisps made from kale offer consumers a convenient and familiar snacking option with the added health benefits of kale, including vitamins, minerals, and antioxidants. These products appeal to health-conscious consumers seeking nutritious alternatives to traditional potato chips or snack foods. Additionally, chips or crisps made from kale often come in a variety of flavors and seasonings, catering to diverse taste preferences and enhancing their market appeal. Further, the increasing availability of packaged kale chips in supermarkets, convenience stores, and online retailers further contributes to their widespread consumption and dominance in the Packaged Kale Chips Market. As consumers continue to prioritize healthy snacking options, the demand for chips or crisps made from kale is expected to remain robust, solidifying their position as the largest segment in the market.
Packaged Kale Chips Market Share Analysis: Online market is poised to register the fastest growth rae over the forecast period to 2032
Among the segmented distribution channels in the Packaged Kale Chips Market, the Online category is the fastest-growing segment. This growth is driven by several factors. Firstly, the increasing prevalence of e-commerce platforms provides consumers with convenient access to a wide variety of packaged kale chips from the comfort of their homes. Online retailers offer a seamless shopping experience, with features such as user-friendly interfaces, personalized recommendations, and doorstep delivery services, catering to the evolving needs and preferences of consumers. Additionally, the COVID-19 pandemic has accelerated the shift towards online shopping as consumers prioritize safety and social distancing measures. Furthermore, online sales channels often provide promotional offers, discounts, and bundling options, attracting consumers seeking value for their purchases. As a result, the Online segment is experiencing rapid growth in the Packaged Kale Chips Market, capturing a larger share of consumer spending on healthy snack options. With the continued digitalization of retail and the convenience-driven shopping behavior of consumers, the Online segment is expected to maintain its momentum and emerge as a dominant distribution channel for packaged kale chips.
Packaged Kale Chips Market Segmentation
By Product
Chips or crisps
Extruded snacks
By Distribution Channel
Offline
Online
Countries Analyzed
North America (US, Canada, Mexico)
Europe (Germany, UK, France, Spain, Italy, Russia, Rest of Europe)
Asia Pacific (China, India, Japan, South Korea, Australia, South East Asia, Rest of Asia)
South America (Brazil, Argentina, Rest of South America)
Middle East and Africa (Saudi Arabia, UAE, Rest of Middle East, South Africa, Egypt, Rest of Africa)
Packaged Kale Chips Companies Profiled in the Study
BRADS PLANT BASED LLC
DJ and A PTY Ltd
Kaleidoscope Foods
Koninklijke Ahold Delhaize NV
NATRULY
Rhythm Superfoods LLC
Simply 7 Snacks LLC
Smart Organic AD
The Kale Factory
*- List Not Exhaustive
Chapter 1. TABLE OF CONTENTS
Chapter 2. Introduction to Packaged Kale Chips Market
2.1. Market Overview
2.2. Key Statistics and Report Highlights
2.3. Scope of the Comprehensive Study
2.3.1. Market Definition
2.3.2 Countries and Regions Covered
2.3.3 Research Objective
2.3.4 Units, Currency, and Conversions
2.3.5 Industry Value Chain
2.4. Key Market Segments
2.5. Key Companies
2.6. Study Period
Chapter 3. Strategic Analysis Review
3.1. Packaged Kale Chips Pricing Analysis and Forecast
3.2. Porter’s Five Forces
3.3. Market Ecosystem
3.4. SWOT Analysis
3.5. Regulatory Scenario
3.3. Effects of Inflation, Russia-Ukraine War, moderating economic growth, and other macroeconomic factors
Chapter 4. Competitive Landscape
4.1. Market Share Analysis
4.1.1. Global Packaged Kale Chips Market Share by Company, 2023
4.1.2. Product Offerings of Leading Packaged Kale Chips Companies
4.2. Market Entropy
4.2.1. New Product Launches in the Industry
4.2.2. Mergers, Acquisitions, Joint ventures, and Partnerships
4.3. Key Strategies and Best Practices
Chapter 5. Global Market Projections: Best, Reference, and Low Case Scenarios
5.1. Growth Analysis- Case Scenario Definitions
5.2. Low Growth Case Scenario Forecasts
5.3. Reference Growth Case Scenario Forecasts
5.4. High Growth Case Scenario Forecasts
Chapter 6. Market Dynamics
6.1. Packaged Kale Chips Market Drivers
6.2. Packaged Kale Chips Market Challenges
6.6. Packaged Kale Chips Market Opportunities
6.4. Packaged Kale Chips Market Trends
Chapter 7. Global Packaged Kale Chips Market Outlook Trends
7.1. Global Packaged Kale Chips Revenue (USD Million) and CAGR (%) by Type (2021-2032)
7.2. Global Packaged Kale Chips Revenue (USD Million) and CAGR (%) by Application (2021-2032)
7.3. Global Packaged Kale Chips Revenue (USD Million) and CAGR (%) by Product (2021-2032)
By Product
Chips or crisps
Extruded snacks
By Distribution Channel
Offline
Online
Chapter 8. Global Packaged Kale Chips Regional Analysis and Outlook
8.1. Global Packaged Kale Chips Revenue (USD Million) By Regions (2021- 2032)
8.2. North America Packaged Kale Chips Revenue (USD Million) by Country (2021-2032)
8.2.1. United States Packaged Kale Chips Regional Analysis and Outlook
8.2.2. Canada Packaged Kale Chips Regional Analysis and Outlook
8.2.3. Mexico Packaged Kale Chips Regional Analysis and Outlook
8.3. Europe Packaged Kale Chips Revenue (USD Million), by Country (2021-2032)
8.3.1. Germany Packaged Kale Chips Regional Analysis and Outlook
8.3.2. France Packaged Kale Chips Regional Analysis and Outlook
8.3.3. United Kingdom Packaged Kale Chips Regional Analysis and Outlook
8.3.4. Spain Packaged Kale Chips Regional Analysis and Outlook
8.3.5. Italy Packaged Kale Chips Regional Analysis and Outlook
8.3.6. Russia Packaged Kale Chips Regional Analysis and Outlook
8.3.7. Rest of Europe Packaged Kale Chips Regional Analysis and Outlook
8.4. Asia Pacific Packaged Kale Chips Revenue (USD Million) by Country (2021-2032)
8.4.1. China Packaged Kale Chips Regional Analysis and Outlook
8.4.2. Japan Packaged Kale Chips Regional Analysis and Outlook
8.4.3. India Packaged Kale Chips Regional Analysis and Outlook
8.4.4. South Korea Packaged Kale Chips Regional Analysis and Outlook
8.4.5. Australia Packaged Kale Chips Regional Analysis and Outlook
8.4.6. South East Asia Packaged Kale Chips Regional Analysis and Outlook
8.4.7. Rest of Asia Pacific Packaged Kale Chips Regional Analysis and Outlook
8.5. South America Packaged Kale Chips Revenue (USD Million), by Country (2021-2032)
8.5.1. Brazil Packaged Kale Chips Regional Analysis and Outlook
8.5.2. Argentina Packaged Kale Chips Regional Analysis and Outlook
8.5.3. Rest of South America Packaged Kale Chips Regional Analysis and Outlook
8.6. Middle East and Africa Packaged Kale Chips Revenue (USD Million) by Country (2021-2032)
8.6.1. Middle East Packaged Kale Chips Regional Analysis and Outlook
8.6.2. Africa Packaged Kale Chips Regional Analysis and Outlook
Chapter 9. North America Packaged Kale Chips Analysis and Outlook
9.1. North America Packaged Kale Chips Revenue (USD Million) by Segments (2021-2032)
9.1.1. North America Packaged Kale Chips Revenue (USD Million) by Type (2021-2032)
9.1.2. North America Packaged Kale Chips Revenue (USD Million) by Application (2021-2032)
9.1.3. North America Packaged Kale Chips Revenue (USD Million) by Product (2021-2032)
By Product
Chips or crisps
Extruded snacks
By Distribution Channel
Offline
Online
Chapter 10. Europe Packaged Kale Chips Analysis and Outlook
10.1. Europe Packaged Kale Chips Revenue (USD Million), by Segments (USD Million) (2021-2032)
10.1.1. Europe Packaged Kale Chips Revenue (USD Million) by Type (2021-2032)
10.1.2. Europe Packaged Kale Chips Revenue (USD Million) by Application (2021-2032)
10.1.3. Europe Packaged Kale Chips Revenue (USD Million) by Product (2021-2032)
By Product
Chips or crisps
Extruded snacks
By Distribution Channel
Offline
Online
Chapter 11. Asia Pacific Packaged Kale Chips Analysis and Outlook
11.1. Asia Pacific Packaged Kale Chips Revenue (USD Million), and Revenue (USD Million) by Segments (2021-2032)
11.1.1. Asia Pacific Packaged Kale Chips Revenue (USD Million) by Type (2021-2032)
11.1.2. Asia Pacific Packaged Kale Chips Revenue (USD Million) by Application (2021-2032)
11.1.3. Asia Pacific Packaged Kale Chips Revenue (USD Million) by Product (2021-2032)
By Product
Chips or crisps
Extruded snacks
By Distribution Channel
Offline
Online
Chapter 12. South America Packaged Kale Chips Analysis and Outlook
12.1. South America Packaged Kale Chips Revenue (USD Million), by Segments (2021-2032)
12.1.1. South America Packaged Kale Chips Revenue (USD Million) by Type (2021-2032)
12.1.2. South America Packaged Kale Chips Revenue (USD Million) by Application (2021-2032)
12.1.3. South America Packaged Kale Chips Revenue (USD Million) by Product (2021-2032)
By Product
Chips or crisps
Extruded snacks
By Distribution Channel
Offline
Online
Chapter 13. Middle East and Africa Packaged Kale Chips Analysis and Outlook
13.1. Middle East and Africa Packaged Kale Chips Revenue (USD Million), by Segments (2021-2032)
13.1.1. Middle East and Africa Packaged Kale Chips Revenue (USD Million) by Type (2021-2032)
13.1.2. Middle East and Africa Packaged Kale Chips Revenue (USD Million) by Application (2021-2032)
13.1.3. Middle East and Africa Packaged Kale Chips Revenue (USD Million) by Product (2021-2032)
By Product
Chips or crisps
Extruded snacks
By Distribution Channel
Offline
Online
Chapter 14. Packaged Kale Chips Company Profiles
14.1 Business Overview
14.2 Product Profiles
14.3 SWOT Profiles
14.5 Recent Developments
14.6 Financial Profile
List of Companies
BRADS PLANT BASED LLC
DJ and A PTY Ltd
Kaleidoscope Foods
Koninklijke Ahold Delhaize NV
NATRULY
Rhythm Superfoods LLC
Simply 7 Snacks LLC
Smart Organic AD
The Kale Factory
15. Methodology and Data Sources
15.1 Customization Offerings
15.2 Subscription Services
15.3 Related Reports
15.4 Publisher Expertise
LIST OF TABLES
Table 1 Market Segmentation Analysis
Table 2 Global Packaged Kale Chips Market Share of Leading Companies, 2023
Table 3 Product Offerings of Leading Companies
Table 4 Low Growth Scenario Forecasts
Table 5 Reference Case Growth Scenario
Table 6 High Growth Case Scenario
Table 7 Global Packaged Kale Chips Revenue (USD Million) And CAGR (%) By Type (2021-2032)
Table 8 Global Packaged Kale Chips Revenue (USD Million) And CAGR (%) By Application (2021-2032)
Table 9 Global Packaged Kale Chips Revenue (USD Million) And CAGR (%) By Product (2021-2032)
Table 10 Global Packaged Kale Chips Market Revenue (USD Million) By Regions (2021-2032)
Table 11 Global Packaged Kale Chips Market Share (%) By Regions (2021-2032)
Table 12 North America Packaged Kale Chips Revenue (USD Million) By Country (2021-2032)
Table 13 Europe Packaged Kale Chips Revenue (USD Million) By Country (2021-2032)
Table 14 Asia Pacific Packaged Kale Chips Revenue (USD Million) By Country (2021-2032)
Table 15 South America Packaged Kale Chips Revenue (USD Million) By Country (2021-2032)
Table 16 Middle East and Africa Packaged Kale Chips Revenue (USD Million) By Region (2021-2032)
Table 17 North America Packaged Kale Chips Revenue (USD Million) By Type (2021-2032)
Table 18 North America Packaged Kale Chips Revenue (USD Million) By Application (2021-2032)
Table 19 North America Packaged Kale Chips Revenue (USD Million) By Product (2021-2032)
Table 20 Europe Packaged Kale Chips Revenue (USD Million) By Type (2021-2032)
Table 21 Europe Packaged Kale Chips Revenue (USD Million) By Application (2021-2032)
Table 22 Europe Packaged Kale Chips Revenue (USD Million) By Product (2021-2032)
Table 23 Asia Pacific Packaged Kale Chips Revenue (USD Million) By Type (2021-2032)
Table 24 Asia Pacific Packaged Kale Chips Revenue (USD Million) By Application (2021-2032)
Table 25 Asia Pacific Packaged Kale Chips Revenue (USD Million) By Product (2021-2032)
Table 26 South America Packaged Kale Chips Revenue (USD Million) By Type (2021-2032)
Table 27 South America Packaged Kale Chips Revenue (USD Million) By Application (2021-2032)
Table 28 South America Packaged Kale Chips Revenue (USD Million) By Product (2021-2032)
Table 29 Middle East and Africa Packaged Kale Chips Revenue (USD Million) By Type (2021-2032)
Table 30 Middle East and Africa Packaged Kale Chips Revenue (USD Million) By Application (2021-2032)
Table 31 Middle East and Africa Packaged Kale Chips Revenue (USD Million) By Product (2021-2032)
LIST OF FIGURES
Figure 1. Market Scope
Figure 2. Pricing Forecasts Per Unit, 2023- 2032
Figure 3. Porter’s Five Forces
Figure 4. Global Packaged Kale Chips Market Revenue (USD Million) By Regions (2021-2032)
Figure 5. Global Packaged Kale Chips Market Share (%) By Regions (2023)
Figure 6. North America Packaged Kale Chips Revenue (USD Million) By Country (2021-2032)
Figure 7. United States Packaged Kale Chips Revenue (USD Million) By Country (2021-2032)
Figure 8. Canada Packaged Kale Chips Revenue (USD Million) By Country (2021-2032)
Figure 9. Mexico Packaged Kale Chips Revenue (USD Million) By Country (2021-2032)
Figure 10. Europe Packaged Kale Chips Revenue (USD Million) By Country (2021-2032)
Figure 11. Germany Packaged Kale Chips Revenue (USD Million) By Country (2021-2032)
Figure 12. France Packaged Kale Chips Revenue (USD Million) By Country (2021-2032)
Figure 13. United Kingdom Packaged Kale Chips Revenue (USD Million) By Country (2021-2032)
Figure 14. Spain Packaged Kale Chips Revenue (USD Million) By Country (2021-2032)
Figure 15. Italy Packaged Kale Chips Revenue (USD Million) By Country (2021-2032)
Figure 16. Russia Packaged Kale Chips Revenue (USD Million) By Country (2021-2032)
Figure 17. Rest of Europe Packaged Kale Chips Revenue (USD Million) By Country (2021-2032)
Figure 11. Asia Pacific Packaged Kale Chips Revenue (USD Million) By Country (2021-2032)
Figure 12. China Packaged Kale Chips Revenue (USD Million) By Country (2021-2032)
Figure 13. Japan Packaged Kale Chips Revenue (USD Million) By Country (2021-2032)
Figure 14. India Packaged Kale Chips Revenue (USD Million) By Country (2021-2032)
Figure 15. South Korea Packaged Kale Chips Revenue (USD Million) By Country (2021-2032)
Figure 16. Australia Packaged Kale Chips Revenue (USD Million) By Country (2021-2032)
Figure 17. South East Asia Packaged Kale Chips Revenue (USD Million) By Country (2021-2032)
Figure 18. South America Packaged Kale Chips Revenue (USD Million) By Country (2021-2032)
Figure 19. Brazil Packaged Kale Chips Revenue (USD Million) By Country (2021-2032)
Figure 20. Argentina Packaged Kale Chips Revenue (USD Million) By Country (2021-2032)
Figure 21. Rest of Asia Pacific Packaged Kale Chips Revenue (USD Million) By Country (2021-2032)
Figure 22. Middle East and Africa Packaged Kale Chips Revenue (USD Million) By Region (2021-2032)
Figure 23. Saudi Arabia Packaged Kale Chips Revenue (USD Million) By Region (2021-2032)
Figure 24. The UAE Packaged Kale Chips Revenue (USD Million) By Region (2021-2032)
Figure 25. Rest of Middle East Packaged Kale Chips Revenue (USD Million) By Region (2021-2032)
Figure 26. South Africa Packaged Kale Chips Revenue (USD Million) By Region (2021-2032)
Figure 27. Africa Packaged Kale Chips Revenue (USD Million) By Region (2021-2032)
Figure 28. North America Packaged Kale Chips Revenue (USD Million) By Type (2021-2032)
Figure 29. North America Packaged Kale Chips Revenue (USD Million) By Application (2021-2032)
Figure 30. North America Packaged Kale Chips Revenue (USD Million) By Product (2021-2032)
Figure 31. Europe Packaged Kale Chips Revenue (USD Million) By Type (2021-2032)
Figure 32. Europe Packaged Kale Chips Revenue (USD Million) By Application (2021-2032)
Figure 33. Europe Packaged Kale Chips Revenue (USD Million) By Product (2021-2032)
Figure 34. Asia Pacific Packaged Kale Chips Revenue (USD Million) By Type (2021-2032)
Figure 35. Asia Pacific Packaged Kale Chips Revenue (USD Million) By Application (2021-2032)
Figure 36. Asia Pacific Packaged Kale Chips Revenue (USD Million) By Product (2021-2032)
Figure 37. South America Packaged Kale Chips Revenue (USD Million) By Type (2021-2032)
Figure 38. South America Packaged Kale Chips Revenue (USD Million) By Application (2021-2032)
Figure 39. South America Packaged Kale Chips Revenue (USD Million) By Product (2021-2032)
Figure 40. Middle East and Africa Packaged Kale Chips Revenue (USD Million) By Type (2021-2032)
Figure 41. Middle East and Africa Packaged Kale Chips Revenue (USD Million) By Application (2021-2032)
Figure 42. Middle East and Africa Packaged Kale Chips Revenue (USD Million) By Product (2021-2032)
By Product
Chips or crisps
Extruded snacks
By Distribution Channel
Offline
Online
Countries Analyzed
North America (US, Canada, Mexico)
Europe (Germany, UK, France, Spain, Italy, Russia, Rest of Europe)
Asia Pacific (China, India, Japan, South Korea, Australia, South East Asia, Rest of Asia)
South America (Brazil, Argentina, Rest of South America)
Middle East and Africa (Saudi Arabia, UAE, Rest of Middle East, South Africa, Egypt, Rest of Africa)
