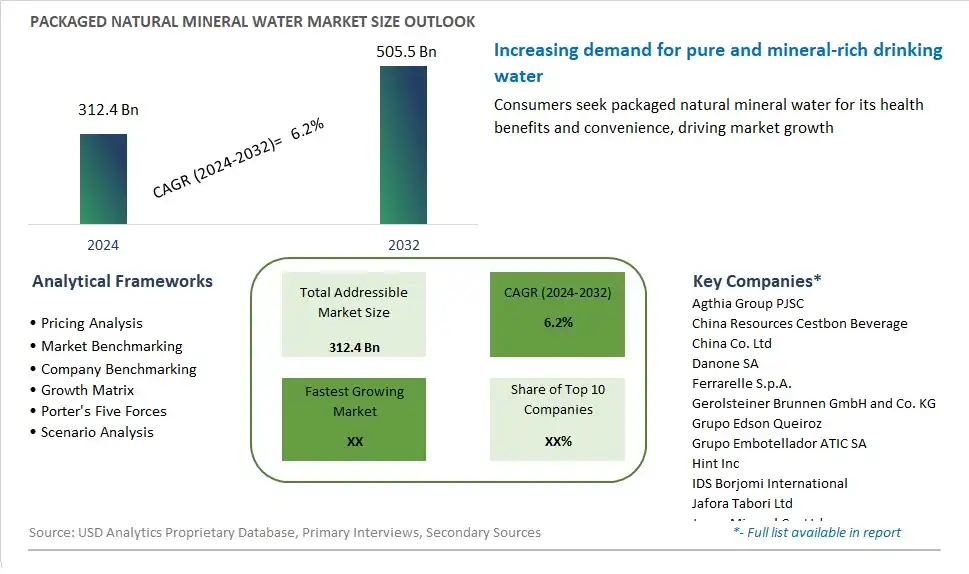
Global Packaged Natural Mineral Water Market Size is valued at $312.4 Billion in 2024 and is forecast to register a growth rate (CAGR) of 6.2% to reach $505.5 Billion by 2032.
The global Packaged Natural Mineral Water Market Comprehensive Study analyzes and forecasts the market size across 6 regions and 24 countries for diverse segments -By Product (Packaged natural sparkling mineral water, Packaged natural still mineral water)
An Introduction to Packaged Natural Mineral Water Market
In 2024, the market for packaged natural mineral water continues to expand as consumers prioritize hydration and seek out premium, unadulterated sources of drinking water. Natural mineral water is sourced from underground springs or aquifers, where it naturally accumulates minerals and trace elements from the surrounding rocks and soil. Packaged in bottles or cartons, natural mineral water offers convenience and purity, providing consumers with a refreshing and replenishing beverage option. These products may undergo minimal processing to ensure their natural composition remains intact, distinguishing them from purified or distilled water. With growing concerns about water quality and environmental sustainability, consumers are increasingly drawn to natural mineral water for its perceived health benefits and eco-friendly credentials. Moreover, natural mineral water is often promoted for its unique taste profile and potential health-enhancing properties, such as improved digestion and mineral supplementation. As hydration becomes increasingly recognized as a vital component of overall health and wellness, the market for packaged natural mineral water is expected to continue growing, driven by consumer demand for clean, premium water sources that support their active lifestyles and well-being.
Packaged Natural Mineral Water Competitive Landscape
The market report analyses the leading companies in the industry including Agthia Group PJSC, China Resources Cestbon Beverage China Co. Ltd, Danone SA, Ferrarelle S.p.A., Gerolsteiner Brunnen GmbH and Co. KG, Grupo Edson Queiroz, Grupo Embotellador ATIC SA, Hint Inc, IDS Borjomi International, Jafora Tabori Ltd, Japan Mineral Co. Ltd, Jeju Province Development Co., Jingtian Shenzhen Food and Beverage Group Co. Ltd, Kona Deep Corp, Masafi Co. LLC, Mountain Valley Spring Company LLC, Nestle SA, Parle Products Pvt. Ltd, PepsiCo Inc, Premium Mix Group SL, Super Bock Bebidas SA, Talking Rain Beverage Co., Tata Consumer Products Ltd, The coca cola co., The Wonderful Co. LLC, Twellium Industrial Co., VOSS of Norway AS, Yasar Holding AS, and Others.
Packaged Natural Mineral Water Market Dynamics
Packaged Natural Mineral Water Market Trend: Growing Preference for Health-Conscious Beverage Choices
One prominent trend in the packaged natural mineral water market is the growing preference for health-conscious beverage choices. With increasing awareness of the importance of hydration for overall health and well-being, consumers are seeking alternatives to sugary sodas and artificially flavored drinks. Packaged natural mineral water, sourced from underground springs and enriched with essential minerals, is gaining popularity as a healthier and more natural option for hydration. This trend is driven by the desire for clean-label products that offer hydration without added sugars, artificial flavors, or preservatives, making packaged natural mineral water a preferred choice among health-conscious individuals seeking pure and refreshing beverages.
Market Driver: Rising Concerns Over Water Quality and Safety
A key driver propelling the packaged natural mineral water market is the rising concerns over water quality and safety. With growing environmental pollution and contamination of freshwater sources, consumers are increasingly skeptical about the safety and purity of tap water. Packaged natural mineral water provides a convenient and reliable solution, offering consumers reassurance about the source, purity, and quality of the water they consume. The rise of bottled water consumption is also driven by concerns over the taste and odor of tap water, as well as the convenience and portability of packaged water bottles for on-the-go hydration.
Market Opportunity: Innovation in Sustainable Packaging and Branding
An opportunity for market expansion in the packaged natural mineral water segment lies in innovation focused on sustainable packaging and branding. While natural mineral water is inherently associated with purity and environmental sustainability, there is potential to further enhance its eco-friendly credentials through innovative packaging solutions such as biodegradable bottles, recycled materials, or refillable containers. Manufacturers can also leverage branding strategies that emphasize sustainability, transparency, and corporate responsibility to appeal to environmentally conscious consumers. By adopting sustainable packaging practices and communicating their commitment to environmental stewardship, companies can differentiate their products, attract eco-minded consumers, and capitalize on opportunities for growth in the packaged natural mineral water market.
Packaged Natural Mineral Water Market Share Analysis: Packaged Natural Still Mineral Water held the dominant market share in 2024
In the Packaged Natural Mineral Water Market segmented by product, Packaged Natural Still Mineral Water is the largest segment. This dominance can be attributed to several factors. Firstly, still mineral water is widely preferred by consumers for its purity and refreshing taste, making it a popular choice for hydration and everyday consumption. Packaged natural still mineral water undergoes minimal processing, preserving its natural mineral composition and taste profile, which appeals to health-conscious consumers seeking clean and unadulterated drinking water. Additionally, still mineral water is versatile and suitable for various applications, including drinking, cooking, and mixing with beverages, contributing to its widespread popularity among consumers of all ages. Further, the convenience of packaged formats, such as bottles and cartons, further enhances the accessibility and consumption of natural still mineral water, solidifying its position as the largest segment in the Packaged Natural Mineral Water Market. As consumer preferences continue to prioritize health, wellness, and sustainability, the demand for packaged natural still mineral water is expected to remain robust, driving its continued dominance in the market.
Packaged Natural Mineral Water Market Segmentation
By Product
Packaged natural sparkling mineral water
Packaged natural still mineral water
Countries Analyzed
North America (US, Canada, Mexico)
Europe (Germany, UK, France, Spain, Italy, Russia, Rest of Europe)
Asia Pacific (China, India, Japan, South Korea, Australia, South East Asia, Rest of Asia)
South America (Brazil, Argentina, Rest of South America)
Middle East and Africa (Saudi Arabia, UAE, Rest of Middle East, South Africa, Egypt, Rest of Africa)
Packaged Natural Mineral Water Companies Profiled in the Study
Agthia Group PJSC
China Resources Cestbon Beverage China Co. Ltd
Danone SA
Ferrarelle S.p.A.
Gerolsteiner Brunnen GmbH and Co. KG
Grupo Edson Queiroz
Grupo Embotellador ATIC SA
Hint Inc
IDS Borjomi International
Jafora Tabori Ltd
Japan Mineral Co. Ltd
Jeju Province Development Co.
Jingtian Shenzhen Food and Beverage Group Co. Ltd
Kona Deep Corp
Masafi Co. LLC
Mountain Valley Spring Company LLC
Nestle SA
Parle Products Pvt. Ltd
PepsiCo Inc
Premium Mix Group SL
Super Bock Bebidas SA
Talking Rain Beverage Co.
Tata Consumer Products Ltd
The coca cola co.
The Wonderful Co. LLC
Twellium Industrial Co.
VOSS of Norway AS
Yasar Holding AS
*- List Not Exhaustive
Chapter 1. TABLE OF CONTENTS
Chapter 2. Introduction to Packaged Natural Mineral Water Market
2.1. Market Overview
2.2. Key Statistics and Report Highlights
2.3. Scope of the Comprehensive Study
2.3.1. Market Definition
2.3.2 Countries and Regions Covered
2.3.3 Research Objective
2.3.4 Units, Currency, and Conversions
2.3.5 Industry Value Chain
2.4. Key Market Segments
2.5. Key Companies
2.6. Study Period
Chapter 3. Strategic Analysis Review
3.1. Packaged Natural Mineral Water Pricing Analysis and Forecast
3.2. Porter’s Five Forces
3.3. Market Ecosystem
3.4. SWOT Analysis
3.5. Regulatory Scenario
3.3. Effects of Inflation, Russia-Ukraine War, moderating economic growth, and other macroeconomic factors
Chapter 4. Competitive Landscape
4.1. Market Share Analysis
4.1.1. Global Packaged Natural Mineral Water Market Share by Company, 2023
4.1.2. Product Offerings of Leading Packaged Natural Mineral Water Companies
4.2. Market Entropy
4.2.1. New Product Launches in the Industry
4.2.2. Mergers, Acquisitions, Joint ventures, and Partnerships
4.3. Key Strategies and Best Practices
Chapter 5. Global Market Projections: Best, Reference, and Low Case Scenarios
5.1. Growth Analysis- Case Scenario Definitions
5.2. Low Growth Case Scenario Forecasts
5.3. Reference Growth Case Scenario Forecasts
5.4. High Growth Case Scenario Forecasts
Chapter 6. Market Dynamics
6.1. Packaged Natural Mineral Water Market Drivers
6.2. Packaged Natural Mineral Water Market Challenges
6.6. Packaged Natural Mineral Water Market Opportunities
6.4. Packaged Natural Mineral Water Market Trends
Chapter 7. Global Packaged Natural Mineral Water Market Outlook Trends
7.1. Global Packaged Natural Mineral Water Revenue (USD Million) and CAGR (%) by Type (2021-2032)
7.2. Global Packaged Natural Mineral Water Revenue (USD Million) and CAGR (%) by Application (2021-2032)
7.3. Global Packaged Natural Mineral Water Revenue (USD Million) and CAGR (%) by Product (2021-2032)
By Product
Packaged natural sparkling mineral water
Packaged natural still mineral water
Chapter 8. Global Packaged Natural Mineral Water Regional Analysis and Outlook
8.1. Global Packaged Natural Mineral Water Revenue (USD Million) By Regions (2021- 2032)
8.2. North America Packaged Natural Mineral Water Revenue (USD Million) by Country (2021-2032)
8.2.1. United States Packaged Natural Mineral Water Regional Analysis and Outlook
8.2.2. Canada Packaged Natural Mineral Water Regional Analysis and Outlook
8.2.3. Mexico Packaged Natural Mineral Water Regional Analysis and Outlook
8.3. Europe Packaged Natural Mineral Water Revenue (USD Million), by Country (2021-2032)
8.3.1. Germany Packaged Natural Mineral Water Regional Analysis and Outlook
8.3.2. France Packaged Natural Mineral Water Regional Analysis and Outlook
8.3.3. United Kingdom Packaged Natural Mineral Water Regional Analysis and Outlook
8.3.4. Spain Packaged Natural Mineral Water Regional Analysis and Outlook
8.3.5. Italy Packaged Natural Mineral Water Regional Analysis and Outlook
8.3.6. Russia Packaged Natural Mineral Water Regional Analysis and Outlook
8.3.7. Rest of Europe Packaged Natural Mineral Water Regional Analysis and Outlook
8.4. Asia Pacific Packaged Natural Mineral Water Revenue (USD Million) by Country (2021-2032)
8.4.1. China Packaged Natural Mineral Water Regional Analysis and Outlook
8.4.2. Japan Packaged Natural Mineral Water Regional Analysis and Outlook
8.4.3. India Packaged Natural Mineral Water Regional Analysis and Outlook
8.4.4. South Korea Packaged Natural Mineral Water Regional Analysis and Outlook
8.4.5. Australia Packaged Natural Mineral Water Regional Analysis and Outlook
8.4.6. South East Asia Packaged Natural Mineral Water Regional Analysis and Outlook
8.4.7. Rest of Asia Pacific Packaged Natural Mineral Water Regional Analysis and Outlook
8.5. South America Packaged Natural Mineral Water Revenue (USD Million), by Country (2021-2032)
8.5.1. Brazil Packaged Natural Mineral Water Regional Analysis and Outlook
8.5.2. Argentina Packaged Natural Mineral Water Regional Analysis and Outlook
8.5.3. Rest of South America Packaged Natural Mineral Water Regional Analysis and Outlook
8.6. Middle East and Africa Packaged Natural Mineral Water Revenue (USD Million) by Country (2021-2032)
8.6.1. Middle East Packaged Natural Mineral Water Regional Analysis and Outlook
8.6.2. Africa Packaged Natural Mineral Water Regional Analysis and Outlook
Chapter 9. North America Packaged Natural Mineral Water Analysis and Outlook
9.1. North America Packaged Natural Mineral Water Revenue (USD Million) by Segments (2021-2032)
9.1.1. North America Packaged Natural Mineral Water Revenue (USD Million) by Type (2021-2032)
9.1.2. North America Packaged Natural Mineral Water Revenue (USD Million) by Application (2021-2032)
9.1.3. North America Packaged Natural Mineral Water Revenue (USD Million) by Product (2021-2032)
By Product
Packaged natural sparkling mineral water
Packaged natural still mineral water
Chapter 10. Europe Packaged Natural Mineral Water Analysis and Outlook
10.1. Europe Packaged Natural Mineral Water Revenue (USD Million), by Segments (USD Million) (2021-2032)
10.1.1. Europe Packaged Natural Mineral Water Revenue (USD Million) by Type (2021-2032)
10.1.2. Europe Packaged Natural Mineral Water Revenue (USD Million) by Application (2021-2032)
10.1.3. Europe Packaged Natural Mineral Water Revenue (USD Million) by Product (2021-2032)
By Product
Packaged natural sparkling mineral water
Packaged natural still mineral water
Chapter 11. Asia Pacific Packaged Natural Mineral Water Analysis and Outlook
11.1. Asia Pacific Packaged Natural Mineral Water Revenue (USD Million), and Revenue (USD Million) by Segments (2021-2032)
11.1.1. Asia Pacific Packaged Natural Mineral Water Revenue (USD Million) by Type (2021-2032)
11.1.2. Asia Pacific Packaged Natural Mineral Water Revenue (USD Million) by Application (2021-2032)
11.1.3. Asia Pacific Packaged Natural Mineral Water Revenue (USD Million) by Product (2021-2032)
By Product
Packaged natural sparkling mineral water
Packaged natural still mineral water
Chapter 12. South America Packaged Natural Mineral Water Analysis and Outlook
12.1. South America Packaged Natural Mineral Water Revenue (USD Million), by Segments (2021-2032)
12.1.1. South America Packaged Natural Mineral Water Revenue (USD Million) by Type (2021-2032)
12.1.2. South America Packaged Natural Mineral Water Revenue (USD Million) by Application (2021-2032)
12.1.3. South America Packaged Natural Mineral Water Revenue (USD Million) by Product (2021-2032)
By Product
Packaged natural sparkling mineral water
Packaged natural still mineral water
Chapter 13. Middle East and Africa Packaged Natural Mineral Water Analysis and Outlook
13.1. Middle East and Africa Packaged Natural Mineral Water Revenue (USD Million), by Segments (2021-2032)
13.1.1. Middle East and Africa Packaged Natural Mineral Water Revenue (USD Million) by Type (2021-2032)
13.1.2. Middle East and Africa Packaged Natural Mineral Water Revenue (USD Million) by Application (2021-2032)
13.1.3. Middle East and Africa Packaged Natural Mineral Water Revenue (USD Million) by Product (2021-2032)
By Product
Packaged natural sparkling mineral water
Packaged natural still mineral water
Chapter 14. Packaged Natural Mineral Water Company Profiles
14.1 Business Overview
14.2 Product Profiles
14.3 SWOT Profiles
14.5 Recent Developments
14.6 Financial Profile
List of Companies
Agthia Group PJSC
China Resources Cestbon Beverage China Co. Ltd
Danone SA
Ferrarelle S.p.A.
Gerolsteiner Brunnen GmbH and Co. KG
Grupo Edson Queiroz
Grupo Embotellador ATIC SA
Hint Inc
IDS Borjomi International
Jafora Tabori Ltd
Japan Mineral Co. Ltd
Jeju Province Development Co.
Jingtian Shenzhen Food and Beverage Group Co. Ltd
Kona Deep Corp
Masafi Co. LLC
Mountain Valley Spring Company LLC
Nestle SA
Parle Products Pvt. Ltd
PepsiCo Inc
Premium Mix Group SL
Super Bock Bebidas SA
Talking Rain Beverage Co.
Tata Consumer Products Ltd
The coca cola co.
The Wonderful Co. LLC
Twellium Industrial Co.
VOSS of Norway AS
Yasar Holding AS
15. Methodology and Data Sources
15.1 Customization Offerings
15.2 Subscription Services
15.3 Related Reports
15.4 Publisher Expertise
LIST OF TABLES
Table 1 Market Segmentation Analysis
Table 2 Global Packaged Natural Mineral Water Market Share of Leading Companies, 2023
Table 3 Product Offerings of Leading Companies
Table 4 Low Growth Scenario Forecasts
Table 5 Reference Case Growth Scenario
Table 6 High Growth Case Scenario
Table 7 Global Packaged Natural Mineral Water Revenue (USD Million) And CAGR (%) By Type (2021-2032)
Table 8 Global Packaged Natural Mineral Water Revenue (USD Million) And CAGR (%) By Application (2021-2032)
Table 9 Global Packaged Natural Mineral Water Revenue (USD Million) And CAGR (%) By Product (2021-2032)
Table 10 Global Packaged Natural Mineral Water Market Revenue (USD Million) By Regions (2021-2032)
Table 11 Global Packaged Natural Mineral Water Market Share (%) By Regions (2021-2032)
Table 12 North America Packaged Natural Mineral Water Revenue (USD Million) By Country (2021-2032)
Table 13 Europe Packaged Natural Mineral Water Revenue (USD Million) By Country (2021-2032)
Table 14 Asia Pacific Packaged Natural Mineral Water Revenue (USD Million) By Country (2021-2032)
Table 15 South America Packaged Natural Mineral Water Revenue (USD Million) By Country (2021-2032)
Table 16 Middle East and Africa Packaged Natural Mineral Water Revenue (USD Million) By Region (2021-2032)
Table 17 North America Packaged Natural Mineral Water Revenue (USD Million) By Type (2021-2032)
Table 18 North America Packaged Natural Mineral Water Revenue (USD Million) By Application (2021-2032)
Table 19 North America Packaged Natural Mineral Water Revenue (USD Million) By Product (2021-2032)
Table 20 Europe Packaged Natural Mineral Water Revenue (USD Million) By Type (2021-2032)
Table 21 Europe Packaged Natural Mineral Water Revenue (USD Million) By Application (2021-2032)
Table 22 Europe Packaged Natural Mineral Water Revenue (USD Million) By Product (2021-2032)
Table 23 Asia Pacific Packaged Natural Mineral Water Revenue (USD Million) By Type (2021-2032)
Table 24 Asia Pacific Packaged Natural Mineral Water Revenue (USD Million) By Application (2021-2032)
Table 25 Asia Pacific Packaged Natural Mineral Water Revenue (USD Million) By Product (2021-2032)
Table 26 South America Packaged Natural Mineral Water Revenue (USD Million) By Type (2021-2032)
Table 27 South America Packaged Natural Mineral Water Revenue (USD Million) By Application (2021-2032)
Table 28 South America Packaged Natural Mineral Water Revenue (USD Million) By Product (2021-2032)
Table 29 Middle East and Africa Packaged Natural Mineral Water Revenue (USD Million) By Type (2021-2032)
Table 30 Middle East and Africa Packaged Natural Mineral Water Revenue (USD Million) By Application (2021-2032)
Table 31 Middle East and Africa Packaged Natural Mineral Water Revenue (USD Million) By Product (2021-2032)
LIST OF FIGURES
Figure 1. Market Scope
Figure 2. Pricing Forecasts Per Unit, 2023- 2032
Figure 3. Porter’s Five Forces
Figure 4. Global Packaged Natural Mineral Water Market Revenue (USD Million) By Regions (2021-2032)
Figure 5. Global Packaged Natural Mineral Water Market Share (%) By Regions (2023)
Figure 6. North America Packaged Natural Mineral Water Revenue (USD Million) By Country (2021-2032)
Figure 7. United States Packaged Natural Mineral Water Revenue (USD Million) By Country (2021-2032)
Figure 8. Canada Packaged Natural Mineral Water Revenue (USD Million) By Country (2021-2032)
Figure 9. Mexico Packaged Natural Mineral Water Revenue (USD Million) By Country (2021-2032)
Figure 10. Europe Packaged Natural Mineral Water Revenue (USD Million) By Country (2021-2032)
Figure 11. Germany Packaged Natural Mineral Water Revenue (USD Million) By Country (2021-2032)
Figure 12. France Packaged Natural Mineral Water Revenue (USD Million) By Country (2021-2032)
Figure 13. United Kingdom Packaged Natural Mineral Water Revenue (USD Million) By Country (2021-2032)
Figure 14. Spain Packaged Natural Mineral Water Revenue (USD Million) By Country (2021-2032)
Figure 15. Italy Packaged Natural Mineral Water Revenue (USD Million) By Country (2021-2032)
Figure 16. Russia Packaged Natural Mineral Water Revenue (USD Million) By Country (2021-2032)
Figure 17. Rest of Europe Packaged Natural Mineral Water Revenue (USD Million) By Country (2021-2032)
Figure 11. Asia Pacific Packaged Natural Mineral Water Revenue (USD Million) By Country (2021-2032)
Figure 12. China Packaged Natural Mineral Water Revenue (USD Million) By Country (2021-2032)
Figure 13. Japan Packaged Natural Mineral Water Revenue (USD Million) By Country (2021-2032)
Figure 14. India Packaged Natural Mineral Water Revenue (USD Million) By Country (2021-2032)
Figure 15. South Korea Packaged Natural Mineral Water Revenue (USD Million) By Country (2021-2032)
Figure 16. Australia Packaged Natural Mineral Water Revenue (USD Million) By Country (2021-2032)
Figure 17. South East Asia Packaged Natural Mineral Water Revenue (USD Million) By Country (2021-2032)
Figure 18. South America Packaged Natural Mineral Water Revenue (USD Million) By Country (2021-2032)
Figure 19. Brazil Packaged Natural Mineral Water Revenue (USD Million) By Country (2021-2032)
Figure 20. Argentina Packaged Natural Mineral Water Revenue (USD Million) By Country (2021-2032)
Figure 21. Rest of Asia Pacific Packaged Natural Mineral Water Revenue (USD Million) By Country (2021-2032)
Figure 22. Middle East and Africa Packaged Natural Mineral Water Revenue (USD Million) By Region (2021-2032)
Figure 23. Saudi Arabia Packaged Natural Mineral Water Revenue (USD Million) By Region (2021-2032)
Figure 24. The UAE Packaged Natural Mineral Water Revenue (USD Million) By Region (2021-2032)
Figure 25. Rest of Middle East Packaged Natural Mineral Water Revenue (USD Million) By Region (2021-2032)
Figure 26. South Africa Packaged Natural Mineral Water Revenue (USD Million) By Region (2021-2032)
Figure 27. Africa Packaged Natural Mineral Water Revenue (USD Million) By Region (2021-2032)
Figure 28. North America Packaged Natural Mineral Water Revenue (USD Million) By Type (2021-2032)
Figure 29. North America Packaged Natural Mineral Water Revenue (USD Million) By Application (2021-2032)
Figure 30. North America Packaged Natural Mineral Water Revenue (USD Million) By Product (2021-2032)
Figure 31. Europe Packaged Natural Mineral Water Revenue (USD Million) By Type (2021-2032)
Figure 32. Europe Packaged Natural Mineral Water Revenue (USD Million) By Application (2021-2032)
Figure 33. Europe Packaged Natural Mineral Water Revenue (USD Million) By Product (2021-2032)
Figure 34. Asia Pacific Packaged Natural Mineral Water Revenue (USD Million) By Type (2021-2032)
Figure 35. Asia Pacific Packaged Natural Mineral Water Revenue (USD Million) By Application (2021-2032)
Figure 36. Asia Pacific Packaged Natural Mineral Water Revenue (USD Million) By Product (2021-2032)
Figure 37. South America Packaged Natural Mineral Water Revenue (USD Million) By Type (2021-2032)
Figure 38. South America Packaged Natural Mineral Water Revenue (USD Million) By Application (2021-2032)
Figure 39. South America Packaged Natural Mineral Water Revenue (USD Million) By Product (2021-2032)
Figure 40. Middle East and Africa Packaged Natural Mineral Water Revenue (USD Million) By Type (2021-2032)
Figure 41. Middle East and Africa Packaged Natural Mineral Water Revenue (USD Million) By Application (2021-2032)
Figure 42. Middle East and Africa Packaged Natural Mineral Water Revenue (USD Million) By Product (2021-2032)
By Product
Packaged natural sparkling mineral water
Packaged natural still mineral water
Countries Analyzed
North America (US, Canada, Mexico)
Europe (Germany, UK, France, Spain, Italy, Russia, Rest of Europe)
Asia Pacific (China, India, Japan, South Korea, Australia, South East Asia, Rest of Asia)
South America (Brazil, Argentina, Rest of South America)
Middle East and Africa (Saudi Arabia, UAE, Rest of Middle East, South Africa, Egypt, Rest of Africa)
