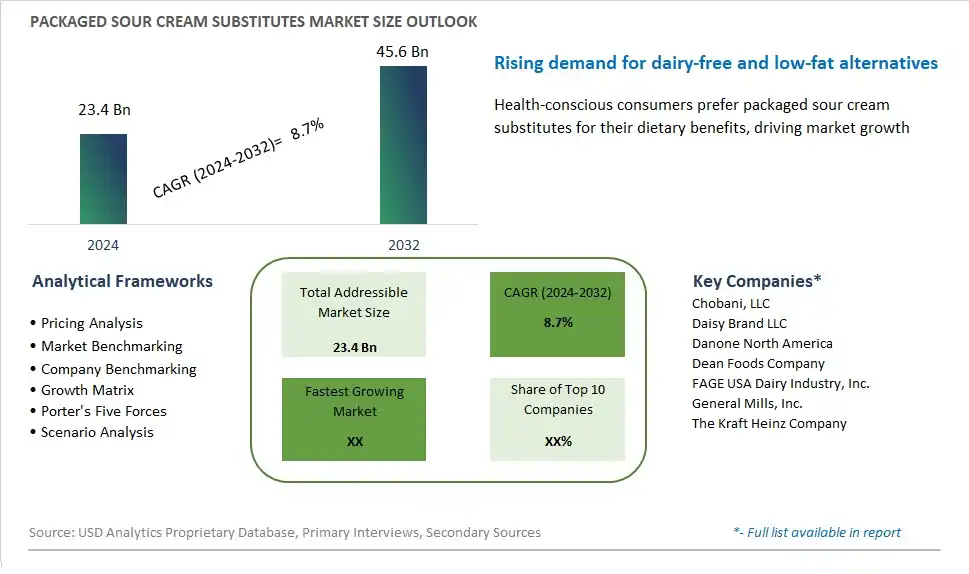
Global Packaged Sour Cream Substitutes Market Size is valued at $23.4 Billion in 2024 and is forecast to register a growth rate (CAGR) of 8.7% to reach $45.6 Billion by 2032.
The global Packaged Sour Cream Substitutes Market Comprehensive Study analyzes and forecasts the market size across 6 regions and 24 countries for diverse segments -By Type (Packaged Greek yogurt, Packaged cottage cheese, Others), By Application (Cream Sauces and Soups, Baked Products, Chocolate, Ice Cream)
An Introduction to Packaged Sour Cream Substitutes Market
The market for packaged sour cream substitutes offers consumers a dairy-free and vegan alternative to traditional sour cream, catering to those with dietary restrictions or preferences. Sour cream substitutes are made from plant-based ingredients such as cashews, coconut milk, tofu, or soy yogurt, blended with probiotics and flavorings to create a tangy and creamy texture similar to traditional sour cream. Packaged in tubs or squeeze bottles, sour cream substitutes provide convenience and versatility, allowing consumers to enjoy their favorite creamy toppings without sacrificing taste or texture. These products are often used as a topping for tacos, baked potatoes, soups, and dips, as well as in recipes for dressings, sauces, and desserts. With the growing popularity of plant-based diets and the demand for dairy-free alternatives, sour cream substitutes offer a flavorful and nutritious option for individuals seeking to reduce their consumption of animal products. Moreover, sour cream substitutes may be lower in fat, calories, and cholesterol compared to traditional sour cream, appealing to health-conscious consumers looking to make healthier choices without sacrificing flavor. As awareness of dairy alternatives continues to grow and dietary preferences diversify, the market for packaged sour cream substitutes is expected to continue expanding, driven by innovation, taste, and consumer demand for plant-based options that support their health and lifestyle goals.
Packaged Sour Cream Substitutes Competitive Landscape
The market report analyses the leading companies in the industry including Chobani, LLC, Daisy Brand LLC, Danone North America, Dean Foods Company, FAGE USA Dairy Industry, Inc., General Mills, Inc., The Kraft Heinz Company, and Others.
Packaged Sour Cream Substitutes Market Dynamics
Packaged Sour Cream Substitutes Market Trend: Growing Demand for Dairy-Free and Plant-Based Alternatives
A significant trend in the packaged sour cream substitutes market is the increasing demand for dairy-free and plant-based alternatives. With more consumers adopting vegan, lactose-free, or dairy-free diets due to health, ethical, or environmental reasons, there is a rising interest in alternative products that mimic the taste and texture of traditional dairy-based foods like sour cream. Packaged sour cream substitutes, made from plant-based ingredients such as coconut milk, cashews, or tofu, are gaining popularity as viable alternatives for those seeking dairy-free options. This trend is driven by the growing awareness of lactose intolerance, dairy allergies, and ethical concerns surrounding animal agriculture, making packaged sour cream substitutes a preferred choice among health-conscious and ethically minded consumers.
Market Driver: Health and Wellness Consciousness
A key driver propelling the packaged sour cream substitutes market is the increasing focus on health and wellness. As consumers become more health-conscious and mindful of their dietary choices, there is a growing demand for food products that offer nutritional benefits and align with specific dietary preferences or restrictions. Packaged sour cream substitutes, particularly those made from natural and minimally processed ingredients, appeal to health-conscious consumers seeking lighter, lower-fat alternatives to traditional sour cream. This driver is fueled by the desire for clean-label products free from artificial additives, preservatives, and GMOs, as well as the perceived health benefits associated with plant-based diets, driving the adoption of packaged sour cream substitutes among individuals prioritizing health and wellness.
Market Opportunity: Expansion into Flavor Varieties and Culinary Applications
An opportunity for market expansion in the packaged sour cream substitutes segment lies in the expansion into flavor varieties and culinary applications. While traditional sour cream substitutes may offer plain or original flavors, there is potential to introduce new and innovative flavor profiles, such as herb-infused, garlic, onion, or chipotle, to cater to diverse taste preferences and usage occasions. Additionally, there is room for innovation in product formulations and culinary applications, such as ready-to-use dips, sauces, dressings, or dessert toppings, to offer consumers greater versatility and convenience in their cooking and meal preparation. By exploring opportunities for flavor innovation and culinary creativity, companies can differentiate their products, attract new consumer segments, and drive growth in the packaged sour cream substitutes market.
Packaged Sour Cream Substitutes Market Share Analysis: Packaged Greek Yogurt held the dominant market share in 2024
In the Packaged Sour Cream Substitutes Market segmented by type, Packaged Greek Yogurt is the largest segment. This dominance can be attributed to several factors. Firstly, Greek yogurt offers a creamy texture and tangy flavor profile similar to sour cream, making it a popular and versatile substitute in various culinary applications. Additionally, Packaged Greek Yogurt is widely recognized for its nutritional benefits, including high protein content, probiotics, and calcium, appealing to health-conscious consumers seeking wholesome alternatives. Further, the convenience of packaged Greek yogurt, available in various flavors and portion sizes, contributes to its widespread availability and consumption in supermarkets, convenience stores, and online retailers. As consumers continue to prioritize healthier eating habits and seek versatile ingredients for cooking and snacking, the demand for Packaged Greek Yogurt as a sour cream substitute is expected to remain strong, solidifying its position as the largest segment in the Packaged Sour Cream Substitutes Market.
Packaged Sour Cream Substitutes Market Share Analysis: Baked Products market is poised to register the fastest growth rae over the forecast period to 2032
Among the segmented applications in the Packaged Sour Cream Substitutes Market, Baked Products emerge as the fastest-growing segment. This growth is driven by several factors. Firstly, sour cream substitutes are increasingly being used in baked goods such as cakes, muffins, and bread to enhance moisture, texture, and flavor without the added fat content of traditional sour cream. Additionally, consumers are seeking healthier alternatives in their baked goods, and sour cream substitutes offer lower fat and calorie content while still providing the desired creamy texture. Further, the versatility of sour cream substitutes allows for their incorporation into a wide range of baked products, catering to diverse taste preferences and dietary needs. As consumer interest in healthier baking options continues to rise, the demand for sour cream substitutes in baked products is expected to grow rapidly, solidifying this segment as the fastest-growing in the Packaged Sour Cream Substitutes Market.
Packaged Sour Cream Substitutes Market Segmentation
By Type
Packaged Greek yogurt
Packaged cottage cheese
Others
By Application
Cream Sauces and Soups
Baked Products
Chocolate
Ice Cream
Countries Analyzed
North America (US, Canada, Mexico)
Europe (Germany, UK, France, Spain, Italy, Russia, Rest of Europe)
Asia Pacific (China, India, Japan, South Korea, Australia, South East Asia, Rest of Asia)
South America (Brazil, Argentina, Rest of South America)
Middle East and Africa (Saudi Arabia, UAE, Rest of Middle East, South Africa, Egypt, Rest of Africa)
Packaged Sour Cream Substitutes Companies Profiled in the Study
Chobani, LLC
Daisy Brand LLC
Danone North America
Dean Foods Company
FAGE USA Dairy Industry, Inc.
General Mills, Inc.
The Kraft Heinz Company
*- List Not Exhaustive
Chapter 1. TABLE OF CONTENTS
Chapter 2. Introduction to Packaged Sour Cream Substitutes Market
2.1. Market Overview
2.2. Key Statistics and Report Highlights
2.3. Scope of the Comprehensive Study
2.3.1. Market Definition
2.3.2 Countries and Regions Covered
2.3.3 Research Objective
2.3.4 Units, Currency, and Conversions
2.3.5 Industry Value Chain
2.4. Key Market Segments
2.5. Key Companies
2.6. Study Period
Chapter 3. Strategic Analysis Review
3.1. Packaged Sour Cream Substitutes Pricing Analysis and Forecast
3.2. Porter’s Five Forces
3.3. Market Ecosystem
3.4. SWOT Analysis
3.5. Regulatory Scenario
3.3. Effects of Inflation, Russia-Ukraine War, moderating economic growth, and other macroeconomic factors
Chapter 4. Competitive Landscape
4.1. Market Share Analysis
4.1.1. Global Packaged Sour Cream Substitutes Market Share by Company, 2023
4.1.2. Product Offerings of Leading Packaged Sour Cream Substitutes Companies
4.2. Market Entropy
4.2.1. New Product Launches in the Industry
4.2.2. Mergers, Acquisitions, Joint ventures, and Partnerships
4.3. Key Strategies and Best Practices
Chapter 5. Global Market Projections: Best, Reference, and Low Case Scenarios
5.1. Growth Analysis- Case Scenario Definitions
5.2. Low Growth Case Scenario Forecasts
5.3. Reference Growth Case Scenario Forecasts
5.4. High Growth Case Scenario Forecasts
Chapter 6. Market Dynamics
6.1. Packaged Sour Cream Substitutes Market Drivers
6.2. Packaged Sour Cream Substitutes Market Challenges
6.6. Packaged Sour Cream Substitutes Market Opportunities
6.4. Packaged Sour Cream Substitutes Market Trends
Chapter 7. Global Packaged Sour Cream Substitutes Market Outlook Trends
7.1. Global Packaged Sour Cream Substitutes Revenue (USD Million) and CAGR (%) by Type (2021-2032)
7.2. Global Packaged Sour Cream Substitutes Revenue (USD Million) and CAGR (%) by Application (2021-2032)
7.3. Global Packaged Sour Cream Substitutes Revenue (USD Million) and CAGR (%) by Product (2021-2032)
By Type
Packaged Greek yogurt
Packaged cottage cheese
Others
By Application
Cream Sauces and Soups
Baked Products
Chocolate
Ice Cream
Chapter 8. Global Packaged Sour Cream Substitutes Regional Analysis and Outlook
8.1. Global Packaged Sour Cream Substitutes Revenue (USD Million) By Regions (2021- 2032)
8.2. North America Packaged Sour Cream Substitutes Revenue (USD Million) by Country (2021-2032)
8.2.1. United States Packaged Sour Cream Substitutes Regional Analysis and Outlook
8.2.2. Canada Packaged Sour Cream Substitutes Regional Analysis and Outlook
8.2.3. Mexico Packaged Sour Cream Substitutes Regional Analysis and Outlook
8.3. Europe Packaged Sour Cream Substitutes Revenue (USD Million), by Country (2021-2032)
8.3.1. Germany Packaged Sour Cream Substitutes Regional Analysis and Outlook
8.3.2. France Packaged Sour Cream Substitutes Regional Analysis and Outlook
8.3.3. United Kingdom Packaged Sour Cream Substitutes Regional Analysis and Outlook
8.3.4. Spain Packaged Sour Cream Substitutes Regional Analysis and Outlook
8.3.5. Italy Packaged Sour Cream Substitutes Regional Analysis and Outlook
8.3.6. Russia Packaged Sour Cream Substitutes Regional Analysis and Outlook
8.3.7. Rest of Europe Packaged Sour Cream Substitutes Regional Analysis and Outlook
8.4. Asia Pacific Packaged Sour Cream Substitutes Revenue (USD Million) by Country (2021-2032)
8.4.1. China Packaged Sour Cream Substitutes Regional Analysis and Outlook
8.4.2. Japan Packaged Sour Cream Substitutes Regional Analysis and Outlook
8.4.3. India Packaged Sour Cream Substitutes Regional Analysis and Outlook
8.4.4. South Korea Packaged Sour Cream Substitutes Regional Analysis and Outlook
8.4.5. Australia Packaged Sour Cream Substitutes Regional Analysis and Outlook
8.4.6. South East Asia Packaged Sour Cream Substitutes Regional Analysis and Outlook
8.4.7. Rest of Asia Pacific Packaged Sour Cream Substitutes Regional Analysis and Outlook
8.5. South America Packaged Sour Cream Substitutes Revenue (USD Million), by Country (2021-2032)
8.5.1. Brazil Packaged Sour Cream Substitutes Regional Analysis and Outlook
8.5.2. Argentina Packaged Sour Cream Substitutes Regional Analysis and Outlook
8.5.3. Rest of South America Packaged Sour Cream Substitutes Regional Analysis and Outlook
8.6. Middle East and Africa Packaged Sour Cream Substitutes Revenue (USD Million) by Country (2021-2032)
8.6.1. Middle East Packaged Sour Cream Substitutes Regional Analysis and Outlook
8.6.2. Africa Packaged Sour Cream Substitutes Regional Analysis and Outlook
Chapter 9. North America Packaged Sour Cream Substitutes Analysis and Outlook
9.1. North America Packaged Sour Cream Substitutes Revenue (USD Million) by Segments (2021-2032)
9.1.1. North America Packaged Sour Cream Substitutes Revenue (USD Million) by Type (2021-2032)
9.1.2. North America Packaged Sour Cream Substitutes Revenue (USD Million) by Application (2021-2032)
9.1.3. North America Packaged Sour Cream Substitutes Revenue (USD Million) by Product (2021-2032)
By Type
Packaged Greek yogurt
Packaged cottage cheese
Others
By Application
Cream Sauces and Soups
Baked Products
Chocolate
Ice Cream
Chapter 10. Europe Packaged Sour Cream Substitutes Analysis and Outlook
10.1. Europe Packaged Sour Cream Substitutes Revenue (USD Million), by Segments (USD Million) (2021-2032)
10.1.1. Europe Packaged Sour Cream Substitutes Revenue (USD Million) by Type (2021-2032)
10.1.2. Europe Packaged Sour Cream Substitutes Revenue (USD Million) by Application (2021-2032)
10.1.3. Europe Packaged Sour Cream Substitutes Revenue (USD Million) by Product (2021-2032)
By Type
Packaged Greek yogurt
Packaged cottage cheese
Others
By Application
Cream Sauces and Soups
Baked Products
Chocolate
Ice Cream
Chapter 11. Asia Pacific Packaged Sour Cream Substitutes Analysis and Outlook
11.1. Asia Pacific Packaged Sour Cream Substitutes Revenue (USD Million), and Revenue (USD Million) by Segments (2021-2032)
11.1.1. Asia Pacific Packaged Sour Cream Substitutes Revenue (USD Million) by Type (2021-2032)
11.1.2. Asia Pacific Packaged Sour Cream Substitutes Revenue (USD Million) by Application (2021-2032)
11.1.3. Asia Pacific Packaged Sour Cream Substitutes Revenue (USD Million) by Product (2021-2032)
By Type
Packaged Greek yogurt
Packaged cottage cheese
Others
By Application
Cream Sauces and Soups
Baked Products
Chocolate
Ice Cream
Chapter 12. South America Packaged Sour Cream Substitutes Analysis and Outlook
12.1. South America Packaged Sour Cream Substitutes Revenue (USD Million), by Segments (2021-2032)
12.1.1. South America Packaged Sour Cream Substitutes Revenue (USD Million) by Type (2021-2032)
12.1.2. South America Packaged Sour Cream Substitutes Revenue (USD Million) by Application (2021-2032)
12.1.3. South America Packaged Sour Cream Substitutes Revenue (USD Million) by Product (2021-2032)
By Type
Packaged Greek yogurt
Packaged cottage cheese
Others
By Application
Cream Sauces and Soups
Baked Products
Chocolate
Ice Cream
Chapter 13. Middle East and Africa Packaged Sour Cream Substitutes Analysis and Outlook
13.1. Middle East and Africa Packaged Sour Cream Substitutes Revenue (USD Million), by Segments (2021-2032)
13.1.1. Middle East and Africa Packaged Sour Cream Substitutes Revenue (USD Million) by Type (2021-2032)
13.1.2. Middle East and Africa Packaged Sour Cream Substitutes Revenue (USD Million) by Application (2021-2032)
13.1.3. Middle East and Africa Packaged Sour Cream Substitutes Revenue (USD Million) by Product (2021-2032)
By Type
Packaged Greek yogurt
Packaged cottage cheese
Others
By Application
Cream Sauces and Soups
Baked Products
Chocolate
Ice Cream
Chapter 14. Packaged Sour Cream Substitutes Company Profiles
14.1 Business Overview
14.2 Product Profiles
14.3 SWOT Profiles
14.5 Recent Developments
14.6 Financial Profile
List of Companies
Chobani, LLC
Daisy Brand LLC
Danone North America
Dean Foods Company
FAGE USA Dairy Industry, Inc.
General Mills, Inc.
The Kraft Heinz Company
15. Methodology and Data Sources
15.1 Customization Offerings
15.2 Subscription Services
15.3 Related Reports
15.4 Publisher Expertise
LIST OF TABLES
Table 1 Market Segmentation Analysis
Table 2 Global Packaged Sour Cream Substitutes Market Share of Leading Companies, 2023
Table 3 Product Offerings of Leading Companies
Table 4 Low Growth Scenario Forecasts
Table 5 Reference Case Growth Scenario
Table 6 High Growth Case Scenario
Table 7 Global Packaged Sour Cream Substitutes Revenue (USD Million) And CAGR (%) By Type (2021-2032)
Table 8 Global Packaged Sour Cream Substitutes Revenue (USD Million) And CAGR (%) By Application (2021-2032)
Table 9 Global Packaged Sour Cream Substitutes Revenue (USD Million) And CAGR (%) By Product (2021-2032)
Table 10 Global Packaged Sour Cream Substitutes Market Revenue (USD Million) By Regions (2021-2032)
Table 11 Global Packaged Sour Cream Substitutes Market Share (%) By Regions (2021-2032)
Table 12 North America Packaged Sour Cream Substitutes Revenue (USD Million) By Country (2021-2032)
Table 13 Europe Packaged Sour Cream Substitutes Revenue (USD Million) By Country (2021-2032)
Table 14 Asia Pacific Packaged Sour Cream Substitutes Revenue (USD Million) By Country (2021-2032)
Table 15 South America Packaged Sour Cream Substitutes Revenue (USD Million) By Country (2021-2032)
Table 16 Middle East and Africa Packaged Sour Cream Substitutes Revenue (USD Million) By Region (2021-2032)
Table 17 North America Packaged Sour Cream Substitutes Revenue (USD Million) By Type (2021-2032)
Table 18 North America Packaged Sour Cream Substitutes Revenue (USD Million) By Application (2021-2032)
Table 19 North America Packaged Sour Cream Substitutes Revenue (USD Million) By Product (2021-2032)
Table 20 Europe Packaged Sour Cream Substitutes Revenue (USD Million) By Type (2021-2032)
Table 21 Europe Packaged Sour Cream Substitutes Revenue (USD Million) By Application (2021-2032)
Table 22 Europe Packaged Sour Cream Substitutes Revenue (USD Million) By Product (2021-2032)
Table 23 Asia Pacific Packaged Sour Cream Substitutes Revenue (USD Million) By Type (2021-2032)
Table 24 Asia Pacific Packaged Sour Cream Substitutes Revenue (USD Million) By Application (2021-2032)
Table 25 Asia Pacific Packaged Sour Cream Substitutes Revenue (USD Million) By Product (2021-2032)
Table 26 South America Packaged Sour Cream Substitutes Revenue (USD Million) By Type (2021-2032)
Table 27 South America Packaged Sour Cream Substitutes Revenue (USD Million) By Application (2021-2032)
Table 28 South America Packaged Sour Cream Substitutes Revenue (USD Million) By Product (2021-2032)
Table 29 Middle East and Africa Packaged Sour Cream Substitutes Revenue (USD Million) By Type (2021-2032)
Table 30 Middle East and Africa Packaged Sour Cream Substitutes Revenue (USD Million) By Application (2021-2032)
Table 31 Middle East and Africa Packaged Sour Cream Substitutes Revenue (USD Million) By Product (2021-2032)
LIST OF FIGURES
Figure 1. Market Scope
Figure 2. Pricing Forecasts Per Unit, 2023- 2032
Figure 3. Porter’s Five Forces
Figure 4. Global Packaged Sour Cream Substitutes Market Revenue (USD Million) By Regions (2021-2032)
Figure 5. Global Packaged Sour Cream Substitutes Market Share (%) By Regions (2023)
Figure 6. North America Packaged Sour Cream Substitutes Revenue (USD Million) By Country (2021-2032)
Figure 7. United States Packaged Sour Cream Substitutes Revenue (USD Million) By Country (2021-2032)
Figure 8. Canada Packaged Sour Cream Substitutes Revenue (USD Million) By Country (2021-2032)
Figure 9. Mexico Packaged Sour Cream Substitutes Revenue (USD Million) By Country (2021-2032)
Figure 10. Europe Packaged Sour Cream Substitutes Revenue (USD Million) By Country (2021-2032)
Figure 11. Germany Packaged Sour Cream Substitutes Revenue (USD Million) By Country (2021-2032)
Figure 12. France Packaged Sour Cream Substitutes Revenue (USD Million) By Country (2021-2032)
Figure 13. United Kingdom Packaged Sour Cream Substitutes Revenue (USD Million) By Country (2021-2032)
Figure 14. Spain Packaged Sour Cream Substitutes Revenue (USD Million) By Country (2021-2032)
Figure 15. Italy Packaged Sour Cream Substitutes Revenue (USD Million) By Country (2021-2032)
Figure 16. Russia Packaged Sour Cream Substitutes Revenue (USD Million) By Country (2021-2032)
Figure 17. Rest of Europe Packaged Sour Cream Substitutes Revenue (USD Million) By Country (2021-2032)
Figure 11. Asia Pacific Packaged Sour Cream Substitutes Revenue (USD Million) By Country (2021-2032)
Figure 12. China Packaged Sour Cream Substitutes Revenue (USD Million) By Country (2021-2032)
Figure 13. Japan Packaged Sour Cream Substitutes Revenue (USD Million) By Country (2021-2032)
Figure 14. India Packaged Sour Cream Substitutes Revenue (USD Million) By Country (2021-2032)
Figure 15. South Korea Packaged Sour Cream Substitutes Revenue (USD Million) By Country (2021-2032)
Figure 16. Australia Packaged Sour Cream Substitutes Revenue (USD Million) By Country (2021-2032)
Figure 17. South East Asia Packaged Sour Cream Substitutes Revenue (USD Million) By Country (2021-2032)
Figure 18. South America Packaged Sour Cream Substitutes Revenue (USD Million) By Country (2021-2032)
Figure 19. Brazil Packaged Sour Cream Substitutes Revenue (USD Million) By Country (2021-2032)
Figure 20. Argentina Packaged Sour Cream Substitutes Revenue (USD Million) By Country (2021-2032)
Figure 21. Rest of Asia Pacific Packaged Sour Cream Substitutes Revenue (USD Million) By Country (2021-2032)
Figure 22. Middle East and Africa Packaged Sour Cream Substitutes Revenue (USD Million) By Region (2021-2032)
Figure 23. Saudi Arabia Packaged Sour Cream Substitutes Revenue (USD Million) By Region (2021-2032)
Figure 24. The UAE Packaged Sour Cream Substitutes Revenue (USD Million) By Region (2021-2032)
Figure 25. Rest of Middle East Packaged Sour Cream Substitutes Revenue (USD Million) By Region (2021-2032)
Figure 26. South Africa Packaged Sour Cream Substitutes Revenue (USD Million) By Region (2021-2032)
Figure 27. Africa Packaged Sour Cream Substitutes Revenue (USD Million) By Region (2021-2032)
Figure 28. North America Packaged Sour Cream Substitutes Revenue (USD Million) By Type (2021-2032)
Figure 29. North America Packaged Sour Cream Substitutes Revenue (USD Million) By Application (2021-2032)
Figure 30. North America Packaged Sour Cream Substitutes Revenue (USD Million) By Product (2021-2032)
Figure 31. Europe Packaged Sour Cream Substitutes Revenue (USD Million) By Type (2021-2032)
Figure 32. Europe Packaged Sour Cream Substitutes Revenue (USD Million) By Application (2021-2032)
Figure 33. Europe Packaged Sour Cream Substitutes Revenue (USD Million) By Product (2021-2032)
Figure 34. Asia Pacific Packaged Sour Cream Substitutes Revenue (USD Million) By Type (2021-2032)
Figure 35. Asia Pacific Packaged Sour Cream Substitutes Revenue (USD Million) By Application (2021-2032)
Figure 36. Asia Pacific Packaged Sour Cream Substitutes Revenue (USD Million) By Product (2021-2032)
Figure 37. South America Packaged Sour Cream Substitutes Revenue (USD Million) By Type (2021-2032)
Figure 38. South America Packaged Sour Cream Substitutes Revenue (USD Million) By Application (2021-2032)
Figure 39. South America Packaged Sour Cream Substitutes Revenue (USD Million) By Product (2021-2032)
Figure 40. Middle East and Africa Packaged Sour Cream Substitutes Revenue (USD Million) By Type (2021-2032)
Figure 41. Middle East and Africa Packaged Sour Cream Substitutes Revenue (USD Million) By Application (2021-2032)
Figure 42. Middle East and Africa Packaged Sour Cream Substitutes Revenue (USD Million) By Product (2021-2032)
By Type
Packaged Greek yogurt
Packaged cottage cheese
Others
By Application
Cream Sauces and Soups
Baked Products
Chocolate
Ice Cream
Countries Analyzed
North America (US, Canada, Mexico)
Europe (Germany, UK, France, Spain, Italy, Russia, Rest of Europe)
Asia Pacific (China, India, Japan, South Korea, Australia, South East Asia, Rest of Asia)
South America (Brazil, Argentina, Rest of South America)
Middle East and Africa (Saudi Arabia, UAE, Rest of Middle East, South Africa, Egypt, Rest of Africa)
