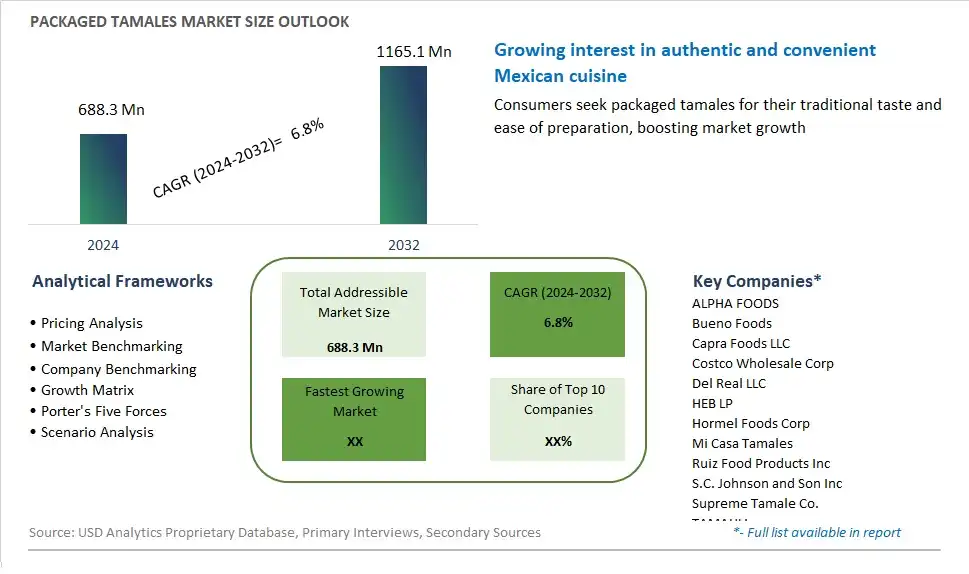
Global Packaged Tamales Market Size is valued at $688.3 Million in 2024 and is forecast to register a growth rate (CAGR) of 6.8% to reach $1165.1 Million by 2032.
The global Packaged Tamales Market Comprehensive Study analyzes and forecasts the market size across 6 regions and 24 countries for diverse segments -By Product (Meat and seafood-based packaged tamales, Vegetables, Others), By Distribution Channel (Offline, Online)
An Introduction to Packaged Tamales Market
In 2024, the market for packaged tamales offers consumers a convenient and authentic option for enjoying this traditional Mexican dish at home. Tamales are made from masa dough filled with a variety of savory or sweet fillings, such as meats, cheeses, vegetables, or fruits, wrapped in corn husks or banana leaves and steamed to perfection. Packaged tamales provide convenience and accessibility, allowing consumers to enjoy the flavors of homemade tamales without the time-consuming preparation process. These products are typically sold frozen or refrigerated, ready to heat and serve in minutes, making them a convenient option for busy individuals and families. With their rich and comforting flavors, tamales appeal to consumers seeking a taste of authentic Mexican cuisine and cultural experience. Moreover, packaged tamales may offer a variety of fillings and flavor options to suit different preferences and dietary needs, including vegetarian, vegan, and gluten-free options. As interest in global cuisines continues to grow and consumers seek out convenient and flavorful meal solutions, the market for packaged tamales is expected to continue expanding, driven by their appeal to food enthusiasts, multicultural consumers, and those looking to explore new culinary experiences at home.
Packaged Tamales Competitive Landscape
The market report analyses the leading companies in the industry including ALPHA FOODS, Bueno Foods, Capra Foods LLC, Costco Wholesale Corp, Del Real LLC, HEB LP, Hormel Foods Corp, Mi Casa Tamales, Ruiz Food Products Inc, S.C. Johnson and Son Inc, Supreme Tamale Co., TAMAHLI, Tamale Addiction, Tastes Better From Scratch, Texas Lone Star Tamales, Texas Tamale Co., Todos los derechos reservados La Costeña, Tucson Tamale, Valley Markets Inc , XLNT Foods Corp, and Others.
Packaged Tamales Market Dynamics
Packaged Tamales Market Trend: Rising Demand for Ethnic and Ready-to-Eat Foods
The packaged tamales market is experiencing a significant trend with the rising demand for ethnic and ready-to-eat foods. As consumers increasingly seek diverse culinary experiences and convenient meal solutions, there is a growing interest in packaged tamales, a traditional Mexican dish made of masa dough filled with various savory or sweet fillings, wrapped in corn husks, and steamed. Packaged tamales offer consumers an authentic taste of Mexican cuisine in a convenient and ready-to-eat format, catering to busy lifestyles and the desire for flavorful, restaurant-quality meals at home. This trend is driven by the growing popularity of ethnic foods, the desire for convenience, and the appeal of exploring new flavors and cultural traditions.
Market Driver: Convenience and Time-Saving Solutions
A key driver propelling the packaged tamales market is the demand for convenience and time-saving solutions. With hectic schedules and an emphasis on convenience-driven lifestyles, consumers are seeking meal options that are quick to prepare without compromising on taste or quality. Packaged tamales offer a convenient solution for busy households and individuals, requiring minimal preparation and cooking time compared to homemade tamales. This driver is fueled by the desire for hassle-free meal solutions that deliver authentic flavors and textures, making packaged tamales a popular choice for weeknight dinners, entertaining, and on-the-go meals.
Market Opportunity: Expansion into Gourmet and Artisanal Varieties
An opportunity for market expansion in the packaged tamales segment lies in the expansion into gourmet and artisanal varieties. While traditional tamales are made with classic fillings such as pork, chicken, or cheese, there is potential to introduce new and innovative flavor combinations, premium ingredients, and artisanal recipes to cater to evolving consumer tastes and preferences. Manufacturers can explore options such as gourmet seafood tamales, vegetarian or vegan varieties, or fusion-inspired flavors that offer a contemporary twist on traditional recipes. Additionally, there is room for innovation in packaging formats, such as single-serve portions, heat-and-eat trays, or frozen convenience packs, to offer consumers greater convenience and flexibility in their meal options. By capitalizing on opportunities for flavor innovation and product differentiation, companies can attract new consumers, drive product adoption, and fuel growth in the packaged tamales market.
Packaged Tamales Market Share Analysis: Meat and Seafood-based Packaged Tamales held the dominant market share in 2024
In the Packaged Tamales Market segmented by product, Meat and Seafood-based Packaged Tamales emerge as the largest segment. This dominance can be attributed to several factors. Firstly, meat and seafood-based tamales are traditional favorites among consumers, offering rich flavors and hearty fillings that are deeply ingrained in culinary traditions across various cultures. These tamales often feature savory meats such as pork, chicken, or beef, as well as seafood options like shrimp or fish, appealing to a wide range of palates. Additionally, meat and seafood-based tamales are perceived as satisfying and substantial meal options, making them popular choices for both everyday meals and special occasions. Further, the availability of packaged meat and seafood-based tamales in supermarkets, convenience stores, and specialty food outlets further contributes to their widespread consumption and dominance in the Packaged Tamales Market. As consumers continue to seek convenient and authentic meal solutions that reflect diverse culinary preferences, the demand for meat and seafood-based packaged tamales is expected to remain strong, solidifying their position as the largest segment in the market.
Packaged Tamales Market Share Analysis: Online market is poised to register the fastest growth rae over the forecast period to 2032
Among the segmented distribution channels in the Packaged Tamales Market, the Online category is the fastest-growing segment. This growth is driven by several factors. Firstly, the increasing prevalence of e-commerce platforms provides consumers with convenient access to a wide variety of packaged tamales from the comfort of their homes. Online retailers offer a seamless shopping experience, with features such as user-friendly interfaces, personalized recommendations, and doorstep delivery services, catering to the evolving needs and preferences of consumers. Additionally, the COVID-19 pandemic has accelerated the shift towards online shopping as consumers prioritize safety and social distancing measures. Furthermore, online sales channels often provide promotional offers, discounts, and bundling options, attracting consumers seeking value for their purchases. As a result, the Online segment is experiencing rapid growth in the Packaged Tamales Market, capturing a larger share of consumer spending on authentic and convenient meal solutions. With the continued digitalization of retail and the convenience-driven shopping behavior of consumers, the Online segment is expected to maintain its momentum and emerge as a dominant distribution channel for packaged tamales.
Packaged Tamales Market Segmentation
By Product
Meat and seafood-based packaged tamales
Vegetables
Others
By Distribution Channel
Offline
Online
Countries Analyzed
North America (US, Canada, Mexico)
Europe (Germany, UK, France, Spain, Italy, Russia, Rest of Europe)
Asia Pacific (China, India, Japan, South Korea, Australia, South East Asia, Rest of Asia)
South America (Brazil, Argentina, Rest of South America)
Middle East and Africa (Saudi Arabia, UAE, Rest of Middle East, South Africa, Egypt, Rest of Africa)
Packaged Tamales Companies Profiled in the Study
ALPHA FOODS
Bueno Foods
Capra Foods LLC
Costco Wholesale Corp
Del Real LLC
HEB LP
Hormel Foods Corp
Mi Casa Tamales
Ruiz Food Products Inc
S.C. Johnson and Son Inc
Supreme Tamale Co.
TAMAHLI
Tamale Addiction
Tastes Better From Scratch
Texas Lone Star Tamales
Texas Tamale Co.
Todos los derechos reservados La Costeña
Tucson Tamale
Valley Markets Inc
XLNT Foods Corp
*- List Not Exhaustive
Chapter 1. TABLE OF CONTENTS
Chapter 2. Introduction to Packaged Tamales Market
2.1. Market Overview
2.2. Key Statistics and Report Highlights
2.3. Scope of the Comprehensive Study
2.3.1. Market Definition
2.3.2 Countries and Regions Covered
2.3.3 Research Objective
2.3.4 Units, Currency, and Conversions
2.3.5 Industry Value Chain
2.4. Key Market Segments
2.5. Key Companies
2.6. Study Period
Chapter 3. Strategic Analysis Review
3.1. Packaged Tamales Pricing Analysis and Forecast
3.2. Porter’s Five Forces
3.3. Market Ecosystem
3.4. SWOT Analysis
3.5. Regulatory Scenario
3.3. Effects of Inflation, Russia-Ukraine War, moderating economic growth, and other macroeconomic factors
Chapter 4. Competitive Landscape
4.1. Market Share Analysis
4.1.1. Global Packaged Tamales Market Share by Company, 2023
4.1.2. Product Offerings of Leading Packaged Tamales Companies
4.2. Market Entropy
4.2.1. New Product Launches in the Industry
4.2.2. Mergers, Acquisitions, Joint ventures, and Partnerships
4.3. Key Strategies and Best Practices
Chapter 5. Global Market Projections: Best, Reference, and Low Case Scenarios
5.1. Growth Analysis- Case Scenario Definitions
5.2. Low Growth Case Scenario Forecasts
5.3. Reference Growth Case Scenario Forecasts
5.4. High Growth Case Scenario Forecasts
Chapter 6. Market Dynamics
6.1. Packaged Tamales Market Drivers
6.2. Packaged Tamales Market Challenges
6.6. Packaged Tamales Market Opportunities
6.4. Packaged Tamales Market Trends
Chapter 7. Global Packaged Tamales Market Outlook Trends
7.1. Global Packaged Tamales Revenue (USD Million) and CAGR (%) by Type (2021-2032)
7.2. Global Packaged Tamales Revenue (USD Million) and CAGR (%) by Application (2021-2032)
7.3. Global Packaged Tamales Revenue (USD Million) and CAGR (%) by Product (2021-2032)
By Product
Meat and seafood-based packaged tamales
Vegetables
Others
By Distribution Channel
Offline
Online
Chapter 8. Global Packaged Tamales Regional Analysis and Outlook
8.1. Global Packaged Tamales Revenue (USD Million) By Regions (2021- 2032)
8.2. North America Packaged Tamales Revenue (USD Million) by Country (2021-2032)
8.2.1. United States Packaged Tamales Regional Analysis and Outlook
8.2.2. Canada Packaged Tamales Regional Analysis and Outlook
8.2.3. Mexico Packaged Tamales Regional Analysis and Outlook
8.3. Europe Packaged Tamales Revenue (USD Million), by Country (2021-2032)
8.3.1. Germany Packaged Tamales Regional Analysis and Outlook
8.3.2. France Packaged Tamales Regional Analysis and Outlook
8.3.3. United Kingdom Packaged Tamales Regional Analysis and Outlook
8.3.4. Spain Packaged Tamales Regional Analysis and Outlook
8.3.5. Italy Packaged Tamales Regional Analysis and Outlook
8.3.6. Russia Packaged Tamales Regional Analysis and Outlook
8.3.7. Rest of Europe Packaged Tamales Regional Analysis and Outlook
8.4. Asia Pacific Packaged Tamales Revenue (USD Million) by Country (2021-2032)
8.4.1. China Packaged Tamales Regional Analysis and Outlook
8.4.2. Japan Packaged Tamales Regional Analysis and Outlook
8.4.3. India Packaged Tamales Regional Analysis and Outlook
8.4.4. South Korea Packaged Tamales Regional Analysis and Outlook
8.4.5. Australia Packaged Tamales Regional Analysis and Outlook
8.4.6. South East Asia Packaged Tamales Regional Analysis and Outlook
8.4.7. Rest of Asia Pacific Packaged Tamales Regional Analysis and Outlook
8.5. South America Packaged Tamales Revenue (USD Million), by Country (2021-2032)
8.5.1. Brazil Packaged Tamales Regional Analysis and Outlook
8.5.2. Argentina Packaged Tamales Regional Analysis and Outlook
8.5.3. Rest of South America Packaged Tamales Regional Analysis and Outlook
8.6. Middle East and Africa Packaged Tamales Revenue (USD Million) by Country (2021-2032)
8.6.1. Middle East Packaged Tamales Regional Analysis and Outlook
8.6.2. Africa Packaged Tamales Regional Analysis and Outlook
Chapter 9. North America Packaged Tamales Analysis and Outlook
9.1. North America Packaged Tamales Revenue (USD Million) by Segments (2021-2032)
9.1.1. North America Packaged Tamales Revenue (USD Million) by Type (2021-2032)
9.1.2. North America Packaged Tamales Revenue (USD Million) by Application (2021-2032)
9.1.3. North America Packaged Tamales Revenue (USD Million) by Product (2021-2032)
By Product
Meat and seafood-based packaged tamales
Vegetables
Others
By Distribution Channel
Offline
Online
Chapter 10. Europe Packaged Tamales Analysis and Outlook
10.1. Europe Packaged Tamales Revenue (USD Million), by Segments (USD Million) (2021-2032)
10.1.1. Europe Packaged Tamales Revenue (USD Million) by Type (2021-2032)
10.1.2. Europe Packaged Tamales Revenue (USD Million) by Application (2021-2032)
10.1.3. Europe Packaged Tamales Revenue (USD Million) by Product (2021-2032)
By Product
Meat and seafood-based packaged tamales
Vegetables
Others
By Distribution Channel
Offline
Online
Chapter 11. Asia Pacific Packaged Tamales Analysis and Outlook
11.1. Asia Pacific Packaged Tamales Revenue (USD Million), and Revenue (USD Million) by Segments (2021-2032)
11.1.1. Asia Pacific Packaged Tamales Revenue (USD Million) by Type (2021-2032)
11.1.2. Asia Pacific Packaged Tamales Revenue (USD Million) by Application (2021-2032)
11.1.3. Asia Pacific Packaged Tamales Revenue (USD Million) by Product (2021-2032)
By Product
Meat and seafood-based packaged tamales
Vegetables
Others
By Distribution Channel
Offline
Online
Chapter 12. South America Packaged Tamales Analysis and Outlook
12.1. South America Packaged Tamales Revenue (USD Million), by Segments (2021-2032)
12.1.1. South America Packaged Tamales Revenue (USD Million) by Type (2021-2032)
12.1.2. South America Packaged Tamales Revenue (USD Million) by Application (2021-2032)
12.1.3. South America Packaged Tamales Revenue (USD Million) by Product (2021-2032)
By Product
Meat and seafood-based packaged tamales
Vegetables
Others
By Distribution Channel
Offline
Online
Chapter 13. Middle East and Africa Packaged Tamales Analysis and Outlook
13.1. Middle East and Africa Packaged Tamales Revenue (USD Million), by Segments (2021-2032)
13.1.1. Middle East and Africa Packaged Tamales Revenue (USD Million) by Type (2021-2032)
13.1.2. Middle East and Africa Packaged Tamales Revenue (USD Million) by Application (2021-2032)
13.1.3. Middle East and Africa Packaged Tamales Revenue (USD Million) by Product (2021-2032)
By Product
Meat and seafood-based packaged tamales
Vegetables
Others
By Distribution Channel
Offline
Online
Chapter 14. Packaged Tamales Company Profiles
14.1 Business Overview
14.2 Product Profiles
14.3 SWOT Profiles
14.5 Recent Developments
14.6 Financial Profile
List of Companies
ALPHA FOODS
Bueno Foods
Capra Foods LLC
Costco Wholesale Corp
Del Real LLC
HEB LP
Hormel Foods Corp
Mi Casa Tamales
Ruiz Food Products Inc
S.C. Johnson and Son Inc
Supreme Tamale Co.
TAMAHLI
Tamale Addiction
Tastes Better From Scratch
Texas Lone Star Tamales
Texas Tamale Co.
Todos los derechos reservados La Costeña
Tucson Tamale
Valley Markets Inc
XLNT Foods Corp
15. Methodology and Data Sources
15.1 Customization Offerings
15.2 Subscription Services
15.3 Related Reports
15.4 Publisher Expertise
LIST OF TABLES
Table 1 Market Segmentation Analysis
Table 2 Global Packaged Tamales Market Share of Leading Companies, 2023
Table 3 Product Offerings of Leading Companies
Table 4 Low Growth Scenario Forecasts
Table 5 Reference Case Growth Scenario
Table 6 High Growth Case Scenario
Table 7 Global Packaged Tamales Revenue (USD Million) And CAGR (%) By Type (2021-2032)
Table 8 Global Packaged Tamales Revenue (USD Million) And CAGR (%) By Application (2021-2032)
Table 9 Global Packaged Tamales Revenue (USD Million) And CAGR (%) By Product (2021-2032)
Table 10 Global Packaged Tamales Market Revenue (USD Million) By Regions (2021-2032)
Table 11 Global Packaged Tamales Market Share (%) By Regions (2021-2032)
Table 12 North America Packaged Tamales Revenue (USD Million) By Country (2021-2032)
Table 13 Europe Packaged Tamales Revenue (USD Million) By Country (2021-2032)
Table 14 Asia Pacific Packaged Tamales Revenue (USD Million) By Country (2021-2032)
Table 15 South America Packaged Tamales Revenue (USD Million) By Country (2021-2032)
Table 16 Middle East and Africa Packaged Tamales Revenue (USD Million) By Region (2021-2032)
Table 17 North America Packaged Tamales Revenue (USD Million) By Type (2021-2032)
Table 18 North America Packaged Tamales Revenue (USD Million) By Application (2021-2032)
Table 19 North America Packaged Tamales Revenue (USD Million) By Product (2021-2032)
Table 20 Europe Packaged Tamales Revenue (USD Million) By Type (2021-2032)
Table 21 Europe Packaged Tamales Revenue (USD Million) By Application (2021-2032)
Table 22 Europe Packaged Tamales Revenue (USD Million) By Product (2021-2032)
Table 23 Asia Pacific Packaged Tamales Revenue (USD Million) By Type (2021-2032)
Table 24 Asia Pacific Packaged Tamales Revenue (USD Million) By Application (2021-2032)
Table 25 Asia Pacific Packaged Tamales Revenue (USD Million) By Product (2021-2032)
Table 26 South America Packaged Tamales Revenue (USD Million) By Type (2021-2032)
Table 27 South America Packaged Tamales Revenue (USD Million) By Application (2021-2032)
Table 28 South America Packaged Tamales Revenue (USD Million) By Product (2021-2032)
Table 29 Middle East and Africa Packaged Tamales Revenue (USD Million) By Type (2021-2032)
Table 30 Middle East and Africa Packaged Tamales Revenue (USD Million) By Application (2021-2032)
Table 31 Middle East and Africa Packaged Tamales Revenue (USD Million) By Product (2021-2032)
LIST OF FIGURES
Figure 1. Market Scope
Figure 2. Pricing Forecasts Per Unit, 2023- 2032
Figure 3. Porter’s Five Forces
Figure 4. Global Packaged Tamales Market Revenue (USD Million) By Regions (2021-2032)
Figure 5. Global Packaged Tamales Market Share (%) By Regions (2023)
Figure 6. North America Packaged Tamales Revenue (USD Million) By Country (2021-2032)
Figure 7. United States Packaged Tamales Revenue (USD Million) By Country (2021-2032)
Figure 8. Canada Packaged Tamales Revenue (USD Million) By Country (2021-2032)
Figure 9. Mexico Packaged Tamales Revenue (USD Million) By Country (2021-2032)
Figure 10. Europe Packaged Tamales Revenue (USD Million) By Country (2021-2032)
Figure 11. Germany Packaged Tamales Revenue (USD Million) By Country (2021-2032)
Figure 12. France Packaged Tamales Revenue (USD Million) By Country (2021-2032)
Figure 13. United Kingdom Packaged Tamales Revenue (USD Million) By Country (2021-2032)
Figure 14. Spain Packaged Tamales Revenue (USD Million) By Country (2021-2032)
Figure 15. Italy Packaged Tamales Revenue (USD Million) By Country (2021-2032)
Figure 16. Russia Packaged Tamales Revenue (USD Million) By Country (2021-2032)
Figure 17. Rest of Europe Packaged Tamales Revenue (USD Million) By Country (2021-2032)
Figure 11. Asia Pacific Packaged Tamales Revenue (USD Million) By Country (2021-2032)
Figure 12. China Packaged Tamales Revenue (USD Million) By Country (2021-2032)
Figure 13. Japan Packaged Tamales Revenue (USD Million) By Country (2021-2032)
Figure 14. India Packaged Tamales Revenue (USD Million) By Country (2021-2032)
Figure 15. South Korea Packaged Tamales Revenue (USD Million) By Country (2021-2032)
Figure 16. Australia Packaged Tamales Revenue (USD Million) By Country (2021-2032)
Figure 17. South East Asia Packaged Tamales Revenue (USD Million) By Country (2021-2032)
Figure 18. South America Packaged Tamales Revenue (USD Million) By Country (2021-2032)
Figure 19. Brazil Packaged Tamales Revenue (USD Million) By Country (2021-2032)
Figure 20. Argentina Packaged Tamales Revenue (USD Million) By Country (2021-2032)
Figure 21. Rest of Asia Pacific Packaged Tamales Revenue (USD Million) By Country (2021-2032)
Figure 22. Middle East and Africa Packaged Tamales Revenue (USD Million) By Region (2021-2032)
Figure 23. Saudi Arabia Packaged Tamales Revenue (USD Million) By Region (2021-2032)
Figure 24. The UAE Packaged Tamales Revenue (USD Million) By Region (2021-2032)
Figure 25. Rest of Middle East Packaged Tamales Revenue (USD Million) By Region (2021-2032)
Figure 26. South Africa Packaged Tamales Revenue (USD Million) By Region (2021-2032)
Figure 27. Africa Packaged Tamales Revenue (USD Million) By Region (2021-2032)
Figure 28. North America Packaged Tamales Revenue (USD Million) By Type (2021-2032)
Figure 29. North America Packaged Tamales Revenue (USD Million) By Application (2021-2032)
Figure 30. North America Packaged Tamales Revenue (USD Million) By Product (2021-2032)
Figure 31. Europe Packaged Tamales Revenue (USD Million) By Type (2021-2032)
Figure 32. Europe Packaged Tamales Revenue (USD Million) By Application (2021-2032)
Figure 33. Europe Packaged Tamales Revenue (USD Million) By Product (2021-2032)
Figure 34. Asia Pacific Packaged Tamales Revenue (USD Million) By Type (2021-2032)
Figure 35. Asia Pacific Packaged Tamales Revenue (USD Million) By Application (2021-2032)
Figure 36. Asia Pacific Packaged Tamales Revenue (USD Million) By Product (2021-2032)
Figure 37. South America Packaged Tamales Revenue (USD Million) By Type (2021-2032)
Figure 38. South America Packaged Tamales Revenue (USD Million) By Application (2021-2032)
Figure 39. South America Packaged Tamales Revenue (USD Million) By Product (2021-2032)
Figure 40. Middle East and Africa Packaged Tamales Revenue (USD Million) By Type (2021-2032)
Figure 41. Middle East and Africa Packaged Tamales Revenue (USD Million) By Application (2021-2032)
Figure 42. Middle East and Africa Packaged Tamales Revenue (USD Million) By Product (2021-2032)
By Product
Meat and seafood-based packaged tamales
Vegetables
Others
By Distribution Channel
Offline
Online
Countries Analyzed
North America (US, Canada, Mexico)
Europe (Germany, UK, France, Spain, Italy, Russia, Rest of Europe)
Asia Pacific (China, India, Japan, South Korea, Australia, South East Asia, Rest of Asia)
South America (Brazil, Argentina, Rest of South America)
Middle East and Africa (Saudi Arabia, UAE, Rest of Middle East, South Africa, Egypt, Rest of Africa)
