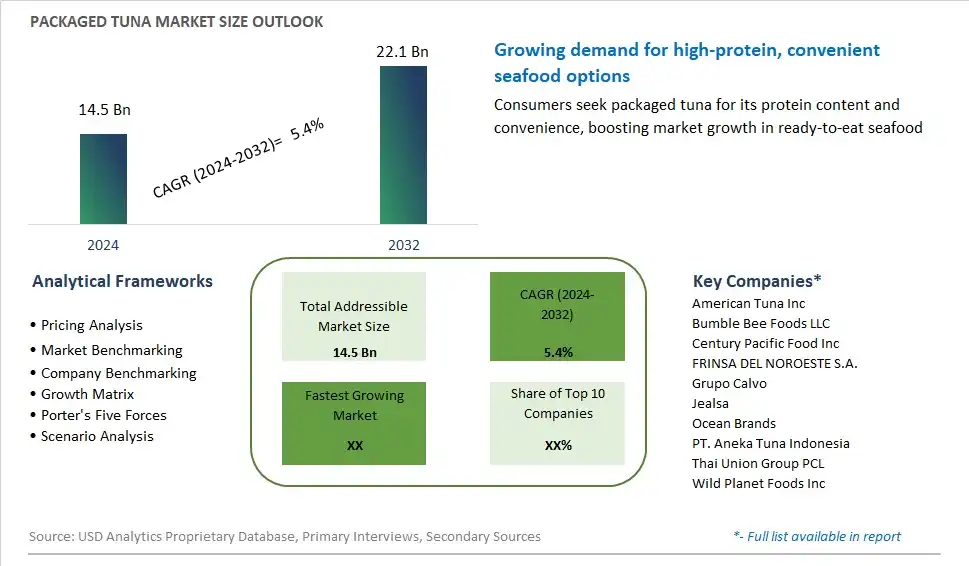
<h3><Strong><i>Global Packaged Tuna Market Size is valued at $14.5 Billion in 2024 and is forecast to register a growth rate (CAGR) of 5.4% to reach $22.1 Billion by 2032.</h3></Strong></i>The global Packaged Tuna Market Comprehensive Study analyzes and forecasts the market size across 6 regions and 24 countries for diverse segments -By Form (Canned, Pouches, Others), By Distribution Channel (Hypermarkets/Supermarkets, Specialty Stores, Convenience Stores, Online, Others)
<h2>An Introduction to Packaged Tuna Market</h2>The packaged tuna market in 2024 is experiencing robust growth, driven by increasing consumer demand for convenient, high-protein meal options. Packaged tuna, available in cans, pouches, and jars, is a versatile product that can be used in a variety of dishes, from sandwiches and salads to casseroles and pasta. Health-conscious consumers are drawn to tuna for its rich protein content, omega-3 fatty acids, and essential nutrients. The market includes a wide range of products, including traditional packed in water or oil, as well as flavored and gourmet options. Sustainable fishing practices and eco-friendly packaging are becoming increasingly important in this market, with many consumers prioritizing brands that support environmental conservation and responsible sourcing. Innovations in product formulations and packaging have enhanced the convenience and appeal of packaged tuna. As consumers continue to seek nutritious and easy-to-prepare meal options, the packaged tuna market is set for sustained growth and innovation.
<h2>Packaged Tuna Competitive Landscape</h2>The market report analyses the leading companies in the industry including American Tuna Inc, Bumble Bee Foods LLC, Century Pacific Food Inc, FRINSA DEL NOROESTE S.A., Grupo Calvo, Jealsa, Ocean Brands, PT. Aneka Tuna Indonesia, Thai Union Group PCL, Wild Planet Foods Inc, and Others.<h2>Packaged Tuna Market Dynamics</h2><h3>Packaged Tuna Market Trend: Growing Demand for Convenient and Healthy Protein Sources</h3>Packaged tuna is experiencing a prominent trend towards increased consumer demand, driven by a growing preference for convenient and healthy protein sources. This trend reflects a broader shift towards health-conscious eating habits and busy lifestyles, with consumers seeking out convenient options that offer high-quality protein and nutritional benefits. Packaged tuna provides a convenient solution for consumers looking to incorporate lean protein into their diets without the need for extensive preparation. As more individuals prioritize health and convenience in their dietary choices, the market for packaged tuna is witnessing steady growth and innovation to meet their evolving needs and preferences.<h3>Market Driver: Health-Conscious Consumers and Sustainability Awareness</h3>The rapid expansion of the packaged tuna market is primarily driven by health-conscious consumers and increasing awareness of sustainability issues in seafood production. With growing concerns about the health effects of processed foods and the environmental impact of overfishing, consumers are turning to packaged tuna as a healthier and more sustainable option. Tuna is rich in omega-3 fatty acids, vitamins, and minerals, making it a popular choice for health-conscious consumers seeking nutritious meal options. Moreover, the availability of responsibly sourced and certified sustainable tuna products addresses consumer concerns about the environmental impact of fishing practices, driving demand for ethically sourced options.<h3>Market Opportunity: Innovation in Product Variety and Packaging Formats</h3>One significant opportunity within the packaged tuna market lies in innovation in product variety and packaging formats to meet the diverse needs and preferences of consumers. Brands can differentiate themselves by offering a wider range of tuna varieties, including skipjack, albacore, and yellowfin, catering to different taste preferences and culinary applications. Additionally, incorporating innovative packaging formats such as single-serve pouches, resealable cans, and flavored tuna packs can enhance convenience and portability, appealing to busy lifestyles and creating new consumption occasions. Furthermore, exploring value-added products such as seasoned tuna blends, tuna salad kits, and ready-to-eat tuna meals can provide added convenience and appeal to consumers seeking quick and easy meal solutions. Collaborations with chefs, nutritionists, and food experts can drive product innovation and recipe development, ensuring that packaged tuna remains a convenient, versatile, and nutritious protein option for consumers seeking healthier choices on-the-go. As the market for packaged tuna continues to evolve, brands that prioritize innovation, differentiation, and sustainability are well-positioned to capitalize on the growing demand for convenient and sustainable seafood products.<h3>Packaged Tuna Market Share Analysis: Canned Tuna held the dominant market share in 2024</h3>In the segmented landscape of the Packaged Tuna Market categorized by Form, the Canned variety is the largest and most prevalent segment, owing to several key factors. Canned tuna holds a longstanding position in the market, favored by consumers for its convenience, versatility, and extended shelf life. Its popularity stems from its suitability for various culinary applications, including salads, sandwiches, casseroles, and pasta dishes, making it a staple in households worldwide. Additionally, canned tuna is prized for its affordability and availability across a wide range of retail outlets, including supermarkets, convenience stores, and online platforms. The enduring appeal of canned tuna is further bolstered by its convenience for on-the-go consumption, making it a preferred choice for busy consumers seeking quick and nutritious meal solutions. As a result, the Canned Tuna segment continues to dominate the Packaged Tuna Market, maintaining its stronghold and driving overall market growth.<h3>Packaged Tuna Market Share Analysis: Online Distribution market is poised to register the fastest growth rae over the forecast period to 2032</h3>In the dynamic landscape of the Packaged Tuna Market segmented by Distribution Channel, the Online segment is the fastest-growing player, driven by evolving consumer preferences and digitalization trends. The convenience, accessibility, and wide array of options offered by online platforms have significantly contributed to the rapid expansion of this segment. Consumers increasingly favor the ease of purchasing tuna products online, as it eliminates the need for physical store visits and offers the flexibility of browsing and buying from the comfort of their homes. Further, the proliferation of e-commerce platforms and digital marketplaces has expanded the reach of Packaged Tuna to a broader audience, including consumers in remote areas. Furthermore, the COVID-19 pandemic has accelerated the adoption of online shopping habits, further propelling the growth of the Online Distribution segment. As consumers continue to prioritize convenience and safety in their purchasing behaviors, the Online Distribution channel is poised to sustain its rapid growth trajectory in the Packaged Tuna Market.<h2>Packaged Tuna Market Segmentation</h2><Strong>By Form</Strong>
Canned
Pouches
Others
<Strong>By Distribution Channel</Strong>
Hypermarkets/Supermarkets
Specialty Stores
Convenience Stores
Online
Others
<Strong>Countries Analyzed</Strong>
North America (US, Canada, Mexico)
Europe (Germany, UK, France, Spain, Italy, Russia, Rest of Europe)
Asia Pacific (China, India, Japan, South Korea, Australia, South East Asia, Rest of Asia)
South America (Brazil, Argentina, Rest of South America)
Middle East and Africa (Saudi Arabia, UAE, Rest of Middle East, South Africa, Egypt, Rest of Africa)<h2>Packaged Tuna Companies Profiled in the Study</h2>American Tuna Inc
Bumble Bee Foods LLC
Century Pacific Food Inc
FRINSA DEL NOROESTE S.A.
Grupo Calvo
Jealsa
Ocean Brands
PT. Aneka Tuna Indonesia
Thai Union Group PCL
Wild Planet Foods Inc
*- List Not Exhaustive
<Strong>Chapter 1. TABLE OF CONTENTS</Strong>
<Strong>Chapter 2. Introduction to Packaged Tuna Market </Strong>
2.1. Market Overview
2.2. Key Statistics and Report Highlights
2.3. Scope of the Comprehensive Study
2.3.1. Market Definition
2.3.2 Countries and Regions Covered
2.3.3 Research Objective
2.3.4 Units, Currency, and Conversions
2.3.5 Industry Value Chain
2.4. Key Market Segments
2.5. Key Companies
2.6. Study Period
<Strong>Chapter 3. Strategic Analysis Review</Strong>
3.1. Packaged Tuna Pricing Analysis and Forecast
3.2. Porter’s Five Forces
3.3. Market Ecosystem
3.4. SWOT Analysis
3.5. Regulatory Scenario
3.3. Effects of Inflation, Russia-Ukraine War, moderating economic growth, and other macroeconomic factors
<Strong>Chapter 4. Competitive Landscape</Strong>
4.1. Market Share Analysis
4.1.1. Global Packaged Tuna Market Share by Company, 2023
4.1.2. Product Offerings of Leading Packaged Tuna Companies
4.2. Market Entropy
4.2.1. New Product Launches in the Industry
4.2.2. Mergers, Acquisitions, Joint ventures, and Partnerships
4.3. Key Strategies and Best Practices
<Strong>Chapter 5. Global Market Projections: Best, Reference, and Low Case Scenarios</Strong>
5.1. Growth Analysis- Case Scenario Definitions
5.2. Low Growth Case Scenario Forecasts
5.3. Reference Growth Case Scenario Forecasts
5.4. High Growth Case Scenario Forecasts
<Strong>Chapter 6. Market Dynamics</Strong>
6.1. Packaged Tuna Market Drivers
6.2. Packaged Tuna Market Challenges
6.6. Packaged Tuna Market Opportunities
6.4. Packaged Tuna Market Trends
<Strong>Chapter 7. Global Packaged Tuna Market Outlook Trends</Strong>
7.1. Global Packaged Tuna Revenue (USD Million) and CAGR (%) by Type (2021-2032)
7.2. Global Packaged Tuna Revenue (USD Million) and CAGR (%) by Application (2021-2032)
7.3. Global Packaged Tuna Revenue (USD Million) and CAGR (%) by Product (2021-2032)
<Strong>By Form</Strong>
Canned
Pouches
Others
<Strong>By Distribution Channel</Strong>
Hypermarkets/Supermarkets
Specialty Stores
Convenience Stores
Online
Others
<Strong>Chapter 8. Global Packaged Tuna Regional Analysis and Outlook</Strong>
8.1. Global Packaged Tuna Revenue (USD Million) By Regions (2021- 2032)
8.2. North America Packaged Tuna Revenue (USD Million) by Country (2021-2032)
8.2.1. United States Packaged Tuna Regional Analysis and Outlook
8.2.2. Canada Packaged Tuna Regional Analysis and Outlook
8.2.3. Mexico Packaged Tuna Regional Analysis and Outlook
8.3. Europe Packaged Tuna Revenue (USD Million), by Country (2021-2032)
8.3.1. Germany Packaged Tuna Regional Analysis and Outlook
8.3.2. France Packaged Tuna Regional Analysis and Outlook
8.3.3. United Kingdom Packaged Tuna Regional Analysis and Outlook
8.3.4. Spain Packaged Tuna Regional Analysis and Outlook
8.3.5. Italy Packaged Tuna Regional Analysis and Outlook
8.3.6. Russia Packaged Tuna Regional Analysis and Outlook
8.3.7. Rest of Europe Packaged Tuna Regional Analysis and Outlook
8.4. Asia Pacific Packaged Tuna Revenue (USD Million) by Country (2021-2032)
8.4.1. China Packaged Tuna Regional Analysis and Outlook
8.4.2. Japan Packaged Tuna Regional Analysis and Outlook
8.4.3. India Packaged Tuna Regional Analysis and Outlook
8.4.4. South Korea Packaged Tuna Regional Analysis and Outlook
8.4.5. Australia Packaged Tuna Regional Analysis and Outlook
8.4.6. South East Asia Packaged Tuna Regional Analysis and Outlook
8.4.7. Rest of Asia Pacific Packaged Tuna Regional Analysis and Outlook
8.5. South America Packaged Tuna Revenue (USD Million), by Country (2021-2032)
8.5.1. Brazil Packaged Tuna Regional Analysis and Outlook
8.5.2. Argentina Packaged Tuna Regional Analysis and Outlook
8.5.3. Rest of South America Packaged Tuna Regional Analysis and Outlook
8.6. Middle East and Africa Packaged Tuna Revenue (USD Million) by Country (2021-2032)
8.6.1. Middle East Packaged Tuna Regional Analysis and Outlook
8.6.2. Africa Packaged Tuna Regional Analysis and Outlook
<Strong>Chapter 9. North America Packaged Tuna Analysis and Outlook</Strong>
9.1. North America Packaged Tuna Revenue (USD Million) by Segments (2021-2032)
9.1.1. North America Packaged Tuna Revenue (USD Million) by Type (2021-2032)
9.1.2. North America Packaged Tuna Revenue (USD Million) by Application (2021-2032)
9.1.3. North America Packaged Tuna Revenue (USD Million) by Product (2021-2032)
<Strong>By Form</Strong>
Canned
Pouches
Others
<Strong>By Distribution Channel</Strong>
Hypermarkets/Supermarkets
Specialty Stores
Convenience Stores
Online
Others
<Strong>Chapter 10. Europe Packaged Tuna Analysis and Outlook</Strong>
10.1. Europe Packaged Tuna Revenue (USD Million), by Segments (USD Million) (2021-2032)
10.1.1. Europe Packaged Tuna Revenue (USD Million) by Type (2021-2032)
10.1.2. Europe Packaged Tuna Revenue (USD Million) by Application (2021-2032)
10.1.3. Europe Packaged Tuna Revenue (USD Million) by Product (2021-2032)
<Strong>By Form</Strong>
Canned
Pouches
Others
<Strong>By Distribution Channel</Strong>
Hypermarkets/Supermarkets
Specialty Stores
Convenience Stores
Online
Others
<Strong>Chapter 11. Asia Pacific Packaged Tuna Analysis and Outlook</Strong>
11.1. Asia Pacific Packaged Tuna Revenue (USD Million), and Revenue (USD Million) by Segments (2021-2032)
11.1.1. Asia Pacific Packaged Tuna Revenue (USD Million) by Type (2021-2032)
11.1.2. Asia Pacific Packaged Tuna Revenue (USD Million) by Application (2021-2032)
11.1.3. Asia Pacific Packaged Tuna Revenue (USD Million) by Product (2021-2032)
<Strong>By Form</Strong>
Canned
Pouches
Others
<Strong>By Distribution Channel</Strong>
Hypermarkets/Supermarkets
Specialty Stores
Convenience Stores
Online
Others
<Strong>Chapter 12. South America Packaged Tuna Analysis and Outlook</Strong>
12.1. South America Packaged Tuna Revenue (USD Million), by Segments (2021-2032)
12.1.1. South America Packaged Tuna Revenue (USD Million) by Type (2021-2032)
12.1.2. South America Packaged Tuna Revenue (USD Million) by Application (2021-2032)
12.1.3. South America Packaged Tuna Revenue (USD Million) by Product (2021-2032)
<Strong>By Form</Strong>
Canned
Pouches
Others
<Strong>By Distribution Channel</Strong>
Hypermarkets/Supermarkets
Specialty Stores
Convenience Stores
Online
Others
<Strong>Chapter 13. Middle East and Africa Packaged Tuna Analysis and Outlook</Strong>
13.1. Middle East and Africa Packaged Tuna Revenue (USD Million), by Segments (2021-2032)
13.1.1. Middle East and Africa Packaged Tuna Revenue (USD Million) by Type (2021-2032)
13.1.2. Middle East and Africa Packaged Tuna Revenue (USD Million) by Application (2021-2032)
13.1.3. Middle East and Africa Packaged Tuna Revenue (USD Million) by Product (2021-2032)
<Strong>By Form</Strong>
Canned
Pouches
Others
<Strong>By Distribution Channel</Strong>
Hypermarkets/Supermarkets
Specialty Stores
Convenience Stores
Online
Others
<Strong>Chapter 14. Packaged Tuna Company Profiles</Strong>
14.1 Business Overview
14.2 Product Profiles
14.3 SWOT Profiles
14.5 Recent Developments
14.6 Financial Profile
List of Companies
American Tuna Inc
Bumble Bee Foods LLC
Century Pacific Food Inc
FRINSA DEL NOROESTE S.A.
Grupo Calvo
Jealsa
Ocean Brands
PT. Aneka Tuna Indonesia
Thai Union Group PCL
Wild Planet Foods Inc
<Strong>15. Methodology and Data Sources</Strong>
15.1 Customization Offerings
15.2 Subscription Services
15.3 Related Reports
15.4 Publisher Expertise
<Strong>LIST OF TABLES</Strong>
Table 1 Market Segmentation Analysis
Table 2 Global Packaged Tuna Market Share of Leading Companies, 2023
Table 3 Product Offerings of Leading Companies
Table 4 Low Growth Scenario Forecasts
Table 5 Reference Case Growth Scenario
Table 6 High Growth Case Scenario
Table 7 Global Packaged Tuna Revenue (USD Million) And CAGR (%) By Type (2021-2032)
Table 8 Global Packaged Tuna Revenue (USD Million) And CAGR (%) By Application (2021-2032)
Table 9 Global Packaged Tuna Revenue (USD Million) And CAGR (%) By Product (2021-2032)
Table 10 Global Packaged Tuna Market Revenue (USD Million) By Regions (2021-2032)
Table 11 Global Packaged Tuna Market Share (%) By Regions (2021-2032)
Table 12 North America Packaged Tuna Revenue (USD Million) By Country (2021-2032)
Table 13 Europe Packaged Tuna Revenue (USD Million) By Country (2021-2032)
Table 14 Asia Pacific Packaged Tuna Revenue (USD Million) By Country (2021-2032)
Table 15 South America Packaged Tuna Revenue (USD Million) By Country (2021-2032)
Table 16 Middle East and Africa Packaged Tuna Revenue (USD Million) By Region (2021-2032)
Table 17 North America Packaged Tuna Revenue (USD Million) By Type (2021-2032)
Table 18 North America Packaged Tuna Revenue (USD Million) By Application (2021-2032)
Table 19 North America Packaged Tuna Revenue (USD Million) By Product (2021-2032)
Table 20 Europe Packaged Tuna Revenue (USD Million) By Type (2021-2032)
Table 21 Europe Packaged Tuna Revenue (USD Million) By Application (2021-2032)
Table 22 Europe Packaged Tuna Revenue (USD Million) By Product (2021-2032)
Table 23 Asia Pacific Packaged Tuna Revenue (USD Million) By Type (2021-2032)
Table 24 Asia Pacific Packaged Tuna Revenue (USD Million) By Application (2021-2032)
Table 25 Asia Pacific Packaged Tuna Revenue (USD Million) By Product (2021-2032)
Table 26 South America Packaged Tuna Revenue (USD Million) By Type (2021-2032)
Table 27 South America Packaged Tuna Revenue (USD Million) By Application (2021-2032)
Table 28 South America Packaged Tuna Revenue (USD Million) By Product (2021-2032)
Table 29 Middle East and Africa Packaged Tuna Revenue (USD Million) By Type (2021-2032)
Table 30 Middle East and Africa Packaged Tuna Revenue (USD Million) By Application (2021-2032)
Table 31 Middle East and Africa Packaged Tuna Revenue (USD Million) By Product (2021-2032)
<Strong>LIST OF FIGURES</Strong>
Figure 1. Market Scope
Figure 2. Pricing Forecasts Per Unit, 2023- 2032
Figure 3. Porter’s Five Forces
Figure 4. Global Packaged Tuna Market Revenue (USD Million) By Regions (2021-2032)
Figure 5. Global Packaged Tuna Market Share (%) By Regions (2023)
Figure 6. North America Packaged Tuna Revenue (USD Million) By Country (2021-2032)
Figure 7. United States Packaged Tuna Revenue (USD Million) By Country (2021-2032)
Figure 8. Canada Packaged Tuna Revenue (USD Million) By Country (2021-2032)
Figure 9. Mexico Packaged Tuna Revenue (USD Million) By Country (2021-2032)
Figure 10. Europe Packaged Tuna Revenue (USD Million) By Country (2021-2032)
Figure 11. Germany Packaged Tuna Revenue (USD Million) By Country (2021-2032)
Figure 12. France Packaged Tuna Revenue (USD Million) By Country (2021-2032)
Figure 13. United Kingdom Packaged Tuna Revenue (USD Million) By Country (2021-2032)
Figure 14. Spain Packaged Tuna Revenue (USD Million) By Country (2021-2032)
Figure 15. Italy Packaged Tuna Revenue (USD Million) By Country (2021-2032)
Figure 16. Russia Packaged Tuna Revenue (USD Million) By Country (2021-2032)
Figure 17. Rest of Europe Packaged Tuna Revenue (USD Million) By Country (2021-2032)
Figure 11. Asia Pacific Packaged Tuna Revenue (USD Million) By Country (2021-2032)
Figure 12. China Packaged Tuna Revenue (USD Million) By Country (2021-2032)
Figure 13. Japan Packaged Tuna Revenue (USD Million) By Country (2021-2032)
Figure 14. India Packaged Tuna Revenue (USD Million) By Country (2021-2032)
Figure 15. South Korea Packaged Tuna Revenue (USD Million) By Country (2021-2032)
Figure 16. Australia Packaged Tuna Revenue (USD Million) By Country (2021-2032)
Figure 17. South East Asia Packaged Tuna Revenue (USD Million) By Country (2021-2032)
Figure 18. South America Packaged Tuna Revenue (USD Million) By Country (2021-2032)
Figure 19. Brazil Packaged Tuna Revenue (USD Million) By Country (2021-2032)
Figure 20. Argentina Packaged Tuna Revenue (USD Million) By Country (2021-2032)
Figure 21. Rest of Asia Pacific Packaged Tuna Revenue (USD Million) By Country (2021-2032)
Figure 22. Middle East and Africa Packaged Tuna Revenue (USD Million) By Region (2021-2032)
Figure 23. Saudi Arabia Packaged Tuna Revenue (USD Million) By Region (2021-2032)
Figure 24. The UAE Packaged Tuna Revenue (USD Million) By Region (2021-2032)
Figure 25. Rest of Middle East Packaged Tuna Revenue (USD Million) By Region (2021-2032)
Figure 26. South Africa Packaged Tuna Revenue (USD Million) By Region (2021-2032)
Figure 27. Africa Packaged Tuna Revenue (USD Million) By Region (2021-2032)
Figure 28. North America Packaged Tuna Revenue (USD Million) By Type (2021-2032)
Figure 29. North America Packaged Tuna Revenue (USD Million) By Application (2021-2032)
Figure 30. North America Packaged Tuna Revenue (USD Million) By Product (2021-2032)
Figure 31. Europe Packaged Tuna Revenue (USD Million) By Type (2021-2032)
Figure 32. Europe Packaged Tuna Revenue (USD Million) By Application (2021-2032)
Figure 33. Europe Packaged Tuna Revenue (USD Million) By Product (2021-2032)
Figure 34. Asia Pacific Packaged Tuna Revenue (USD Million) By Type (2021-2032)
Figure 35. Asia Pacific Packaged Tuna Revenue (USD Million) By Application (2021-2032)
Figure 36. Asia Pacific Packaged Tuna Revenue (USD Million) By Product (2021-2032)
Figure 37. South America Packaged Tuna Revenue (USD Million) By Type (2021-2032)
Figure 38. South America Packaged Tuna Revenue (USD Million) By Application (2021-2032)
Figure 39. South America Packaged Tuna Revenue (USD Million) By Product (2021-2032)
Figure 40. Middle East and Africa Packaged Tuna Revenue (USD Million) By Type (2021-2032)
Figure 41. Middle East and Africa Packaged Tuna Revenue (USD Million) By Application (2021-2032)
Figure 42. Middle East and Africa Packaged Tuna Revenue (USD Million) By Product (2021-2032)
