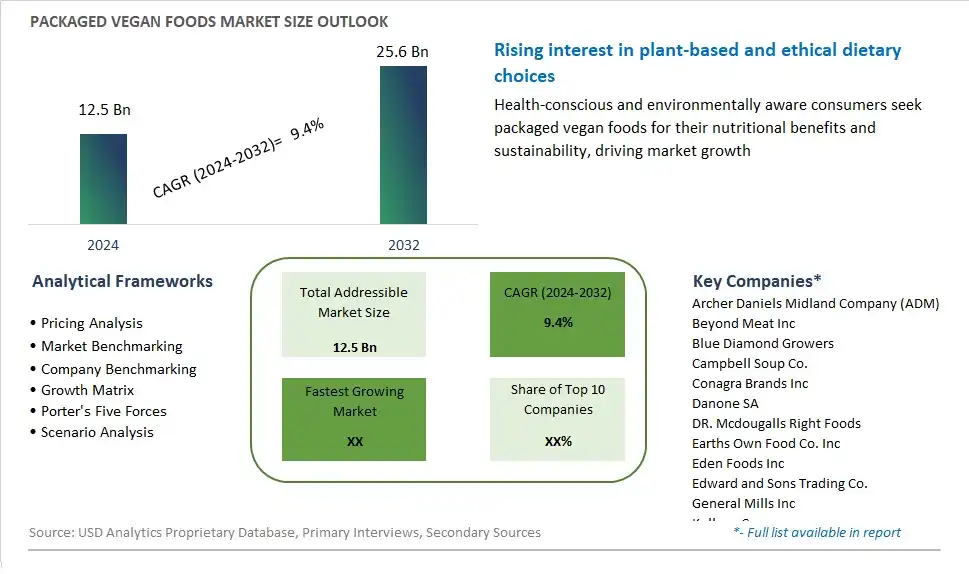
Global Packaged Vegan Foods Market Size is valued at $12.5 Billion in 2024 and is forecast to register a growth rate (CAGR) of 9.4% to reach $25.6 Billion by 2032.
The global Packaged Vegan Foods Market Comprehensive Study analyzes and forecasts the market size across 6 regions and 24 countries for diverse segments -By Product (Dairy alternatives, Meat alternatives & packaged vegan meals, Vegan bakery & confectionery products, Others), By Distribution Channel (Supermarket/ Hypermarkets, Convenience Stores, Online Stores, Others)
An Introduction to Packaged Vegan Foods Market
In 2024, the market for packaged vegan foods continues to grow as consumers embrace plant-based diets for health, environmental, and ethical reasons. Packaged vegan foods encompass a wide range of products, including meat substitutes, dairy alternatives, plant-based snacks, prepared meals, and convenience foods. These products are formulated without any animal-derived ingredients, offering cruelty-free and sustainable alternatives to traditional animal products. Packaged vegan foods provide convenience and accessibility, allowing consumers to enjoy their favorite dishes and flavors without compromising on taste or nutrition. With advancements in food technology and culinary innovation, vegan foods now come in a variety of forms and flavors, catering to diverse dietary preferences and culinary traditions. Moreover, packaged vegan foods may offer additional health benefits, such as being lower in saturated fat, cholesterol, and calories compared to their animal-based counterparts. As awareness of the environmental impact of animal agriculture grows and consumers seek out healthier and more sustainable food options, the market for packaged vegan foods is expected to continue expanding, driven by innovation, taste, and consumer demand for plant-based alternatives that support their health and values.
Packaged Vegan Foods Competitive Landscape
The market report analyses the leading companies in the industry including Archer Daniels Midland Company (ADM), Beyond Meat Inc, Blue Diamond Growers, Campbell Soup Co., Conagra Brands Inc, Danone SA, DR. Mcdougalls Right Foods, Earths Own Food Co. Inc, Eden Foods Inc, Edward and Sons Trading Co., General Mills Inc, Kellogg Co., Otsuka Holdings Co. Ltd, Post Holdings Inc, Ripple Foods PBC, and Others.
Packaged Vegan Foods Market Dynamics
Packaged Vegan Foods Market Trend: Rising Popularity of Plant-Based Diets and Vegan Lifestyle
One significant trend in the packaged vegan foods market is the rising popularity of plant-based diets and the vegan lifestyle. As more consumers become aware of the environmental, ethical, and health benefits associated with reducing their consumption of animal products, there is a growing interest in vegan alternatives across various food categories. Packaged vegan foods offer consumers a convenient and accessible way to incorporate plant-based options into their diet, whether they are committed vegans, flexitarians, or individuals seeking healthier and more sustainable food choices. This trend is driven by the increasing awareness of animal welfare, concerns over the environmental impact of animal agriculture, and the growing availability of innovative vegan products that replicate the taste and texture of traditional animal-based foods.
Market Driver: Health-Conscious Consumer Behavior and Dietary Restrictions
A key driver propelling the packaged vegan foods market is health-conscious consumer behavior and dietary restrictions. With more consumers prioritizing their health and wellness, there is a growing demand for foods that are perceived as healthier, cleaner, and free from animal-derived ingredients, additives, or allergens. Packaged vegan foods appeal to individuals seeking nutritious alternatives that are low in saturated fat, cholesterol-free, and rich in vitamins, minerals, and plant-based proteins. This driver is also fueled by the increasing prevalence of dietary restrictions, including lactose intolerance, egg allergies, and gluten sensitivities, which drive consumers to seek out vegan options that accommodate their specific dietary needs and preferences.
Market Opportunity: Expansion into Convenience and Snack Foods
An opportunity for market expansion in the packaged vegan foods segment lies in the expansion into convenience and snack foods. While vegan foods have traditionally been associated with staples like fruits, vegetables, grains, and legumes, there is potential to introduce new and innovative vegan options in convenient and snackable formats. Manufacturers can explore options such as vegan protein bars, plant-based jerky, dairy-free cheese snacks, or grab-and-go meal kits to offer consumers greater convenience, portability, and versatility in their plant-based eating choices. Additionally, there is room for innovation in flavor profiles, packaging designs, and marketing strategies to appeal to a wider audience and drive adoption of packaged vegan foods beyond the traditional vegan demographic. By tapping into opportunities in convenience and snack foods, companies can expand their reach, attract new consumer segments, and capitalize on the growing demand for plant-based alternatives in the mainstream market.
Packaged Vegan Foods Market Share Analysis: Dairy Alternatives held the dominant market share in 2024
In the Packaged Vegan Foods Market segmented by product, Dairy Alternatives emerge as the largest segment. This dominance can be attributed to several factors. Firstly, dairy alternatives cater to a growing consumer base seeking plant-based alternatives to traditional dairy products such as milk, cheese, and yogurt. These alternatives, often made from soy, almonds, coconut, or oats, provide options for individuals with lactose intolerance, dairy allergies, or those choosing to follow a vegan lifestyle for ethical or environmental reasons. Additionally, dairy alternatives are versatile and can be used in various culinary applications, including cooking, baking, and as standalone beverages or snacks. Further, the increasing awareness of the health benefits associated with reducing dairy consumption, such as improved digestion and lower cholesterol levels, further drives the demand for dairy alternatives in the Packaged Vegan Foods Market. As consumers continue to prioritize health, sustainability, and ethical considerations in their food choices, the demand for dairy alternatives is expected to remain strong, solidifying their position as the largest segment in the market.
Packaged Vegan Foods Market Share Analysis: Online Stores market is poised to register the fastest growth rae over the forecast period to 2032
Among the segmented distribution channels in the Packaged Vegan Foods Market, Online Stores emerge as the fastest-growing segment. This growth is propelled by several factors. Firstly, the increasing prevalence of e-commerce platforms offers consumers convenient access to a wide variety of packaged vegan foods from the comfort of their homes. Online stores provide a seamless shopping experience, featuring user-friendly interfaces, personalized recommendations, and doorstep delivery services, catering to the evolving needs and preferences of consumers. Additionally, the COVID-19 pandemic has accelerated the adoption of online shopping as consumers prioritize safety and social distancing measures. Furthermore, online sales channels often offer a broader selection of vegan products, including specialty items and niche brands, attracting consumers seeking variety and innovation in plant-based foods. As a result, the Online Stores segment experiences rapid growth in the Packaged Vegan Foods Market, capturing a larger share of consumer spending on ethical, sustainable, and health-conscious food options. With the ongoing digitalization of retail and the convenience-driven shopping behavior of consumers, the Online Stores segment is expected to maintain its momentum and emerge as a dominant distribution channel for packaged vegan foods.
Packaged Vegan Foods Market Segmentation
By Product
Dairy alternatives
Meat alternatives & packaged vegan meals
Vegan bakery & confectionery products
Others
By Distribution Channel
Supermarket/ Hypermarkets
Convenience Stores
Online Stores
Others
Countries Analyzed
North America (US, Canada, Mexico)
Europe (Germany, UK, France, Spain, Italy, Russia, Rest of Europe)
Asia Pacific (China, India, Japan, South Korea, Australia, South East Asia, Rest of Asia)
South America (Brazil, Argentina, Rest of South America)
Middle East and Africa (Saudi Arabia, UAE, Rest of Middle East, South Africa, Egypt, Rest of Africa)
Packaged Vegan Foods Companies Profiled in the Study
Archer Daniels Midland Company (ADM)
Beyond Meat Inc
Blue Diamond Growers
Campbell Soup Co.
Conagra Brands Inc
Danone SA
DR. Mcdougalls Right Foods
Earths Own Food Co. Inc
Eden Foods Inc
Edward and Sons Trading Co.
General Mills Inc
Kellogg Co.
Otsuka Holdings Co. Ltd
Post Holdings Inc
Ripple Foods PBC
*- List Not Exhaustive
Chapter 1. TABLE OF CONTENTS
Chapter 2. Introduction to Packaged Vegan Foods Market
2.1. Market Overview
2.2. Key Statistics and Report Highlights
2.3. Scope of the Comprehensive Study
2.3.1. Market Definition
2.3.2 Countries and Regions Covered
2.3.3 Research Objective
2.3.4 Units, Currency, and Conversions
2.3.5 Industry Value Chain
2.4. Key Market Segments
2.5. Key Companies
2.6. Study Period
Chapter 3. Strategic Analysis Review
3.1. Packaged Vegan Foods Pricing Analysis and Forecast
3.2. Porter’s Five Forces
3.3. Market Ecosystem
3.4. SWOT Analysis
3.5. Regulatory Scenario
3.3. Effects of Inflation, Russia-Ukraine War, moderating economic growth, and other macroeconomic factors
Chapter 4. Competitive Landscape
4.1. Market Share Analysis
4.1.1. Global Packaged Vegan Foods Market Share by Company, 2023
4.1.2. Product Offerings of Leading Packaged Vegan Foods Companies
4.2. Market Entropy
4.2.1. New Product Launches in the Industry
4.2.2. Mergers, Acquisitions, Joint ventures, and Partnerships
4.3. Key Strategies and Best Practices
Chapter 5. Global Market Projections: Best, Reference, and Low Case Scenarios
5.1. Growth Analysis- Case Scenario Definitions
5.2. Low Growth Case Scenario Forecasts
5.3. Reference Growth Case Scenario Forecasts
5.4. High Growth Case Scenario Forecasts
Chapter 6. Market Dynamics
6.1. Packaged Vegan Foods Market Drivers
6.2. Packaged Vegan Foods Market Challenges
6.6. Packaged Vegan Foods Market Opportunities
6.4. Packaged Vegan Foods Market Trends
Chapter 7. Global Packaged Vegan Foods Market Outlook Trends
7.1. Global Packaged Vegan Foods Revenue (USD Million) and CAGR (%) by Type (2021-2032)
7.2. Global Packaged Vegan Foods Revenue (USD Million) and CAGR (%) by Application (2021-2032)
7.3. Global Packaged Vegan Foods Revenue (USD Million) and CAGR (%) by Product (2021-2032)
By Product
Dairy alternatives
Meat alternatives & packaged vegan meals
Vegan bakery & confectionery products
Others
By Distribution Channel
Supermarket/ Hypermarkets
Convenience Stores
Online Stores
Others
Chapter 8. Global Packaged Vegan Foods Regional Analysis and Outlook
8.1. Global Packaged Vegan Foods Revenue (USD Million) By Regions (2021- 2032)
8.2. North America Packaged Vegan Foods Revenue (USD Million) by Country (2021-2032)
8.2.1. United States Packaged Vegan Foods Regional Analysis and Outlook
8.2.2. Canada Packaged Vegan Foods Regional Analysis and Outlook
8.2.3. Mexico Packaged Vegan Foods Regional Analysis and Outlook
8.3. Europe Packaged Vegan Foods Revenue (USD Million), by Country (2021-2032)
8.3.1. Germany Packaged Vegan Foods Regional Analysis and Outlook
8.3.2. France Packaged Vegan Foods Regional Analysis and Outlook
8.3.3. United Kingdom Packaged Vegan Foods Regional Analysis and Outlook
8.3.4. Spain Packaged Vegan Foods Regional Analysis and Outlook
8.3.5. Italy Packaged Vegan Foods Regional Analysis and Outlook
8.3.6. Russia Packaged Vegan Foods Regional Analysis and Outlook
8.3.7. Rest of Europe Packaged Vegan Foods Regional Analysis and Outlook
8.4. Asia Pacific Packaged Vegan Foods Revenue (USD Million) by Country (2021-2032)
8.4.1. China Packaged Vegan Foods Regional Analysis and Outlook
8.4.2. Japan Packaged Vegan Foods Regional Analysis and Outlook
8.4.3. India Packaged Vegan Foods Regional Analysis and Outlook
8.4.4. South Korea Packaged Vegan Foods Regional Analysis and Outlook
8.4.5. Australia Packaged Vegan Foods Regional Analysis and Outlook
8.4.6. South East Asia Packaged Vegan Foods Regional Analysis and Outlook
8.4.7. Rest of Asia Pacific Packaged Vegan Foods Regional Analysis and Outlook
8.5. South America Packaged Vegan Foods Revenue (USD Million), by Country (2021-2032)
8.5.1. Brazil Packaged Vegan Foods Regional Analysis and Outlook
8.5.2. Argentina Packaged Vegan Foods Regional Analysis and Outlook
8.5.3. Rest of South America Packaged Vegan Foods Regional Analysis and Outlook
8.6. Middle East and Africa Packaged Vegan Foods Revenue (USD Million) by Country (2021-2032)
8.6.1. Middle East Packaged Vegan Foods Regional Analysis and Outlook
8.6.2. Africa Packaged Vegan Foods Regional Analysis and Outlook
Chapter 9. North America Packaged Vegan Foods Analysis and Outlook
9.1. North America Packaged Vegan Foods Revenue (USD Million) by Segments (2021-2032)
9.1.1. North America Packaged Vegan Foods Revenue (USD Million) by Type (2021-2032)
9.1.2. North America Packaged Vegan Foods Revenue (USD Million) by Application (2021-2032)
9.1.3. North America Packaged Vegan Foods Revenue (USD Million) by Product (2021-2032)
By Product
Dairy alternatives
Meat alternatives & packaged vegan meals
Vegan bakery & confectionery products
Others
By Distribution Channel
Supermarket/ Hypermarkets
Convenience Stores
Online Stores
Others
Chapter 10. Europe Packaged Vegan Foods Analysis and Outlook
10.1. Europe Packaged Vegan Foods Revenue (USD Million), by Segments (USD Million) (2021-2032)
10.1.1. Europe Packaged Vegan Foods Revenue (USD Million) by Type (2021-2032)
10.1.2. Europe Packaged Vegan Foods Revenue (USD Million) by Application (2021-2032)
10.1.3. Europe Packaged Vegan Foods Revenue (USD Million) by Product (2021-2032)
By Product
Dairy alternatives
Meat alternatives & packaged vegan meals
Vegan bakery & confectionery products
Others
By Distribution Channel
Supermarket/ Hypermarkets
Convenience Stores
Online Stores
Others
Chapter 11. Asia Pacific Packaged Vegan Foods Analysis and Outlook
11.1. Asia Pacific Packaged Vegan Foods Revenue (USD Million), and Revenue (USD Million) by Segments (2021-2032)
11.1.1. Asia Pacific Packaged Vegan Foods Revenue (USD Million) by Type (2021-2032)
11.1.2. Asia Pacific Packaged Vegan Foods Revenue (USD Million) by Application (2021-2032)
11.1.3. Asia Pacific Packaged Vegan Foods Revenue (USD Million) by Product (2021-2032)
By Product
Dairy alternatives
Meat alternatives & packaged vegan meals
Vegan bakery & confectionery products
Others
By Distribution Channel
Supermarket/ Hypermarkets
Convenience Stores
Online Stores
Others
Chapter 12. South America Packaged Vegan Foods Analysis and Outlook
12.1. South America Packaged Vegan Foods Revenue (USD Million), by Segments (2021-2032)
12.1.1. South America Packaged Vegan Foods Revenue (USD Million) by Type (2021-2032)
12.1.2. South America Packaged Vegan Foods Revenue (USD Million) by Application (2021-2032)
12.1.3. South America Packaged Vegan Foods Revenue (USD Million) by Product (2021-2032)
By Product
Dairy alternatives
Meat alternatives & packaged vegan meals
Vegan bakery & confectionery products
Others
By Distribution Channel
Supermarket/ Hypermarkets
Convenience Stores
Online Stores
Others
Chapter 13. Middle East and Africa Packaged Vegan Foods Analysis and Outlook
13.1. Middle East and Africa Packaged Vegan Foods Revenue (USD Million), by Segments (2021-2032)
13.1.1. Middle East and Africa Packaged Vegan Foods Revenue (USD Million) by Type (2021-2032)
13.1.2. Middle East and Africa Packaged Vegan Foods Revenue (USD Million) by Application (2021-2032)
13.1.3. Middle East and Africa Packaged Vegan Foods Revenue (USD Million) by Product (2021-2032)
By Product
Dairy alternatives
Meat alternatives & packaged vegan meals
Vegan bakery & confectionery products
Others
By Distribution Channel
Supermarket/ Hypermarkets
Convenience Stores
Online Stores
Others
Chapter 14. Packaged Vegan Foods Company Profiles
14.1 Business Overview
14.2 Product Profiles
14.3 SWOT Profiles
14.5 Recent Developments
14.6 Financial Profile
List of Companies
Archer Daniels Midland Company (ADM)
Beyond Meat Inc
Blue Diamond Growers
Campbell Soup Co.
Conagra Brands Inc
Danone SA
DR. Mcdougalls Right Foods
Earths Own Food Co. Inc
Eden Foods Inc
Edward and Sons Trading Co.
General Mills Inc
Kellogg Co.
Otsuka Holdings Co. Ltd
Post Holdings Inc
Ripple Foods PBC
15. Methodology and Data Sources
15.1 Customization Offerings
15.2 Subscription Services
15.3 Related Reports
15.4 Publisher Expertise
LIST OF TABLES
Table 1 Market Segmentation Analysis
Table 2 Global Packaged Vegan Foods Market Share of Leading Companies, 2023
Table 3 Product Offerings of Leading Companies
Table 4 Low Growth Scenario Forecasts
Table 5 Reference Case Growth Scenario
Table 6 High Growth Case Scenario
Table 7 Global Packaged Vegan Foods Revenue (USD Million) And CAGR (%) By Type (2021-2032)
Table 8 Global Packaged Vegan Foods Revenue (USD Million) And CAGR (%) By Application (2021-2032)
Table 9 Global Packaged Vegan Foods Revenue (USD Million) And CAGR (%) By Product (2021-2032)
Table 10 Global Packaged Vegan Foods Market Revenue (USD Million) By Regions (2021-2032)
Table 11 Global Packaged Vegan Foods Market Share (%) By Regions (2021-2032)
Table 12 North America Packaged Vegan Foods Revenue (USD Million) By Country (2021-2032)
Table 13 Europe Packaged Vegan Foods Revenue (USD Million) By Country (2021-2032)
Table 14 Asia Pacific Packaged Vegan Foods Revenue (USD Million) By Country (2021-2032)
Table 15 South America Packaged Vegan Foods Revenue (USD Million) By Country (2021-2032)
Table 16 Middle East and Africa Packaged Vegan Foods Revenue (USD Million) By Region (2021-2032)
Table 17 North America Packaged Vegan Foods Revenue (USD Million) By Type (2021-2032)
Table 18 North America Packaged Vegan Foods Revenue (USD Million) By Application (2021-2032)
Table 19 North America Packaged Vegan Foods Revenue (USD Million) By Product (2021-2032)
Table 20 Europe Packaged Vegan Foods Revenue (USD Million) By Type (2021-2032)
Table 21 Europe Packaged Vegan Foods Revenue (USD Million) By Application (2021-2032)
Table 22 Europe Packaged Vegan Foods Revenue (USD Million) By Product (2021-2032)
Table 23 Asia Pacific Packaged Vegan Foods Revenue (USD Million) By Type (2021-2032)
Table 24 Asia Pacific Packaged Vegan Foods Revenue (USD Million) By Application (2021-2032)
Table 25 Asia Pacific Packaged Vegan Foods Revenue (USD Million) By Product (2021-2032)
Table 26 South America Packaged Vegan Foods Revenue (USD Million) By Type (2021-2032)
Table 27 South America Packaged Vegan Foods Revenue (USD Million) By Application (2021-2032)
Table 28 South America Packaged Vegan Foods Revenue (USD Million) By Product (2021-2032)
Table 29 Middle East and Africa Packaged Vegan Foods Revenue (USD Million) By Type (2021-2032)
Table 30 Middle East and Africa Packaged Vegan Foods Revenue (USD Million) By Application (2021-2032)
Table 31 Middle East and Africa Packaged Vegan Foods Revenue (USD Million) By Product (2021-2032)
LIST OF FIGURES
Figure 1. Market Scope
Figure 2. Pricing Forecasts Per Unit, 2023- 2032
Figure 3. Porter’s Five Forces
Figure 4. Global Packaged Vegan Foods Market Revenue (USD Million) By Regions (2021-2032)
Figure 5. Global Packaged Vegan Foods Market Share (%) By Regions (2023)
Figure 6. North America Packaged Vegan Foods Revenue (USD Million) By Country (2021-2032)
Figure 7. United States Packaged Vegan Foods Revenue (USD Million) By Country (2021-2032)
Figure 8. Canada Packaged Vegan Foods Revenue (USD Million) By Country (2021-2032)
Figure 9. Mexico Packaged Vegan Foods Revenue (USD Million) By Country (2021-2032)
Figure 10. Europe Packaged Vegan Foods Revenue (USD Million) By Country (2021-2032)
Figure 11. Germany Packaged Vegan Foods Revenue (USD Million) By Country (2021-2032)
Figure 12. France Packaged Vegan Foods Revenue (USD Million) By Country (2021-2032)
Figure 13. United Kingdom Packaged Vegan Foods Revenue (USD Million) By Country (2021-2032)
Figure 14. Spain Packaged Vegan Foods Revenue (USD Million) By Country (2021-2032)
Figure 15. Italy Packaged Vegan Foods Revenue (USD Million) By Country (2021-2032)
Figure 16. Russia Packaged Vegan Foods Revenue (USD Million) By Country (2021-2032)
Figure 17. Rest of Europe Packaged Vegan Foods Revenue (USD Million) By Country (2021-2032)
Figure 11. Asia Pacific Packaged Vegan Foods Revenue (USD Million) By Country (2021-2032)
Figure 12. China Packaged Vegan Foods Revenue (USD Million) By Country (2021-2032)
Figure 13. Japan Packaged Vegan Foods Revenue (USD Million) By Country (2021-2032)
Figure 14. India Packaged Vegan Foods Revenue (USD Million) By Country (2021-2032)
Figure 15. South Korea Packaged Vegan Foods Revenue (USD Million) By Country (2021-2032)
Figure 16. Australia Packaged Vegan Foods Revenue (USD Million) By Country (2021-2032)
Figure 17. South East Asia Packaged Vegan Foods Revenue (USD Million) By Country (2021-2032)
Figure 18. South America Packaged Vegan Foods Revenue (USD Million) By Country (2021-2032)
Figure 19. Brazil Packaged Vegan Foods Revenue (USD Million) By Country (2021-2032)
Figure 20. Argentina Packaged Vegan Foods Revenue (USD Million) By Country (2021-2032)
Figure 21. Rest of Asia Pacific Packaged Vegan Foods Revenue (USD Million) By Country (2021-2032)
Figure 22. Middle East and Africa Packaged Vegan Foods Revenue (USD Million) By Region (2021-2032)
Figure 23. Saudi Arabia Packaged Vegan Foods Revenue (USD Million) By Region (2021-2032)
Figure 24. The UAE Packaged Vegan Foods Revenue (USD Million) By Region (2021-2032)
Figure 25. Rest of Middle East Packaged Vegan Foods Revenue (USD Million) By Region (2021-2032)
Figure 26. South Africa Packaged Vegan Foods Revenue (USD Million) By Region (2021-2032)
Figure 27. Africa Packaged Vegan Foods Revenue (USD Million) By Region (2021-2032)
Figure 28. North America Packaged Vegan Foods Revenue (USD Million) By Type (2021-2032)
Figure 29. North America Packaged Vegan Foods Revenue (USD Million) By Application (2021-2032)
Figure 30. North America Packaged Vegan Foods Revenue (USD Million) By Product (2021-2032)
Figure 31. Europe Packaged Vegan Foods Revenue (USD Million) By Type (2021-2032)
Figure 32. Europe Packaged Vegan Foods Revenue (USD Million) By Application (2021-2032)
Figure 33. Europe Packaged Vegan Foods Revenue (USD Million) By Product (2021-2032)
Figure 34. Asia Pacific Packaged Vegan Foods Revenue (USD Million) By Type (2021-2032)
Figure 35. Asia Pacific Packaged Vegan Foods Revenue (USD Million) By Application (2021-2032)
Figure 36. Asia Pacific Packaged Vegan Foods Revenue (USD Million) By Product (2021-2032)
Figure 37. South America Packaged Vegan Foods Revenue (USD Million) By Type (2021-2032)
Figure 38. South America Packaged Vegan Foods Revenue (USD Million) By Application (2021-2032)
Figure 39. South America Packaged Vegan Foods Revenue (USD Million) By Product (2021-2032)
Figure 40. Middle East and Africa Packaged Vegan Foods Revenue (USD Million) By Type (2021-2032)
Figure 41. Middle East and Africa Packaged Vegan Foods Revenue (USD Million) By Application (2021-2032)
Figure 42. Middle East and Africa Packaged Vegan Foods Revenue (USD Million) By Product (2021-2032)
By Product
Dairy alternatives
Meat alternatives & packaged vegan meals
Vegan bakery & confectionery products
Others
By Distribution Channel
Supermarket/ Hypermarkets
Convenience Stores
Online Stores
Others
Countries Analyzed
North America (US, Canada, Mexico)
Europe (Germany, UK, France, Spain, Italy, Russia, Rest of Europe)
Asia Pacific (China, India, Japan, South Korea, Australia, South East Asia, Rest of Asia)
South America (Brazil, Argentina, Rest of South America)
Middle East and Africa (Saudi Arabia, UAE, Rest of Middle East, South Africa, Egypt, Rest of Africa)
