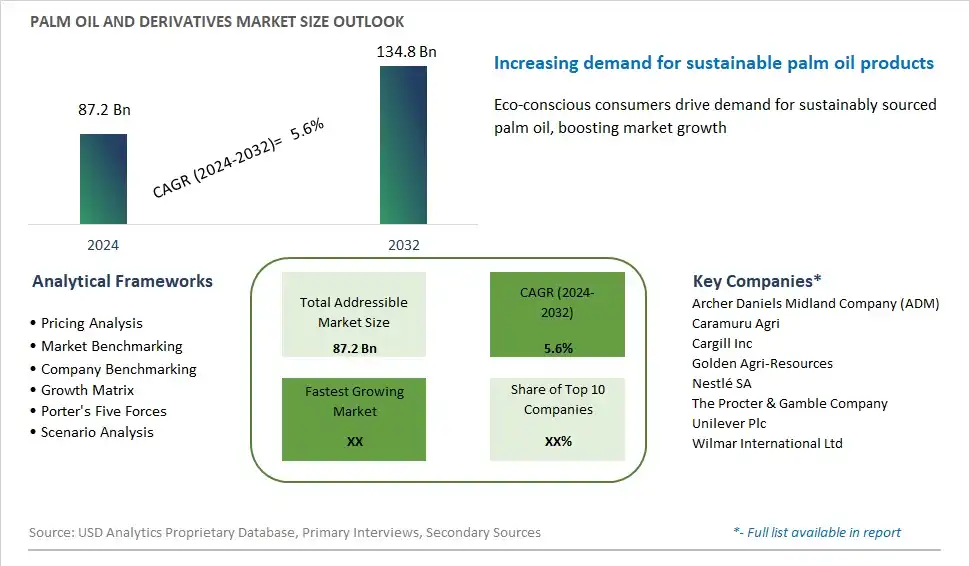
Global Palm Oil and Derivatives Market Size is valued at $87.2 Billion in 2024 and is forecast to register a growth rate (CAGR) of 5.6% to reach $134.8 Billion by 2032.
The global Palm Oil and Derivatives Market Comprehensive Study analyzes and forecasts the market size across 6 regions and 24 countries for diverse segments -By Product (Crude Palm Oil (CPO), Palm Kernel Oil (PKO), Refined, Bleached, Deodorized (RBD) Palm Oil, Palm Olein, Palm Stearin, Others), By Application (Food, Personal Care, Pharmaceuticals, Biofuels, Animal Feed, Others), By Distribution Channel (Food & Beverage, Personal Care, Pharmaceuticals, Biofuel, Animal Feed, Others)
An Introduction to Palm Oil and Derivatives Market
In 2024, the palm oil and palm oil derivatives market remains a cornerstone of the global agribusiness industry, driving economic growth and providing essential raw materials for various sectors such as food, cosmetics, pharmaceuticals, and biofuels. Palm oil, derived from the fruit of the oil palm tree, is prized for its high productivity, versatility, and cost-effectiveness, making it the most widely consumed vegetable oil worldwide. Palm oil derivatives, including oleochemicals such as fatty acids, glycerin, and surfactants, serve as essential ingredients in a wide range of consumer and industrial products. Despite its utility, the palm oil industry faces scrutiny over environmental and social sustainability concerns, including deforestation, habitat destruction, and labor practices. Efforts to address these challenges have led to the development of sustainable palm oil certification schemes and initiatives aimed at promoting responsible production practices and conservation efforts. As demand for sustainable and traceable palm oil grows, industry stakeholders are increasingly adopting measures to improve transparency, accountability, and environmental stewardship throughout the palm oil supply chain, ensuring the long-term viability of this vital commodity.
Palm Oil and Derivatives Competitive Landscape
The market report analyses the leading companies in the industry including Archer Daniels Midland Company (ADM), Caramuru Agri, Cargill Inc, Golden Agri-Resources, Nestlé SA, The Procter & Gamble Company, Unilever Plc, Wilmar International Ltd, and Others.
Palm Oil and Derivatives Market Dynamics
Palm Oil And Palm Oil Derivatives Market Trend: Increasing Demand for Sustainable Palm Oil
The market for Palm Oil and Palm Oil Derivatives is experiencing a prominent trend driven by the increasing demand for sustainable palm oil products. With growing awareness of the environmental and social impacts of palm oil production, there is a rising preference among consumers, retailers, and manufacturers for sustainably sourced palm oil that adheres to certified standards such as RSPO (Roundtable on Sustainable Palm Oil). Companies are committing to sourcing sustainable palm oil to mitigate deforestation, biodiversity loss, and social conflicts associated with conventional palm oil production. This trend is fueled by consumer activism, corporate sustainability commitments, and regulatory pressure to promote responsible palm oil sourcing practices, driving the adoption of sustainable palm oil across various industries worldwide.
Market Driver: Versatility and Cost-Effectiveness of Palm Oil Derivatives
The market for Palm Oil and Palm Oil Derivatives is primarily driven by the versatility and cost-effectiveness of palm oil derivatives in a wide range of applications. Palm oil is a highly versatile vegetable oil used extensively in food, cosmetics, pharmaceuticals, and industrial products due to its unique properties such as high oxidative stability, creamy texture, and neutral flavor profile. Palm oil derivatives such as palm kernel oil, palm stearin, and palm olein are widely utilized as ingredients, additives, and functional components in various consumer goods and industrial processes. The abundant availability and affordability of palm oil make it an attractive choice for manufacturers seeking cost-effective solutions without compromising product quality or performance. This driver is reinforced by the growing demand for palm oil derivatives in emerging markets, as well as the expanding applications in biofuels, oleochemicals, and renewable materials, driving the growth of the palm oil industry globally.
Market Opportunity: Expansion into Sustainable Product Innovation
The market for Palm Oil and Palm Oil Derivatives presents a significant opportunity for companies to expand into sustainable product innovation and differentiation to meet evolving consumer preferences and regulatory requirements. Companies can invest in research and development to develop sustainable alternatives to conventional palm oil derivatives, such as non-GMO, organic, or certified sustainable palm oil derivatives. Additionally, there are opportunities to explore novel applications and formulations of palm oil derivatives in eco-friendly products, green technologies, and renewable materials to support the transition towards a circular economy and low-carbon future. By embracing sustainable practices and innovation, companies can differentiate their products, enhance brand reputation, and capture market share in the growing market for sustainable palm oil and derivatives.
Palm Oil And Palm Oil Derivatives Market Share Analysis: Crude Palm Oil (CPO) held the dominant market share in 2024
The "Crude Palm Oil (CPO)" segment is the largest within the Palm Oil And Palm Oil Derivatives Market, driven by its versatile applications, high yield, and widespread use in various industries. CPO serves as the primary product derived from palm oil extraction, offering a cost-effective and efficient source of vegetable oil for food, pharmaceutical, and industrial applications. Its natural properties, such as resistance to oxidation and stability at high temperatures, make it suitable for cooking oils, margarine production, and food processing. Further, CPO serves as a vital feedstock for the production of palm kernel oil (PKO) and refined, bleached, deodorized (RBD) palm oil, further enhancing its significance in the palm oil derivatives market. Additionally, the global demand for vegetable oils and fats, coupled with the efficient cultivation and extraction processes of palm oil, contribute to the dominance of the CPO segment. As the leading product in the palm oil and derivatives market, CPO is expected to maintain its prominent position, driving growth and innovation across various industries.
Palm Oil And Palm Oil Derivatives Market Share Analysis: Biofuels market is poised to register the fastest growth rae over the forecast period to 2032
The "Biofuels" segment is the fastest-growing within the Palm Oil And Palm Oil Derivatives Market, driven by increasing global initiatives to reduce greenhouse gas emissions and promote sustainable energy sources. Palm oil and its derivatives, such as palm methyl ester (PME) and biodiesel, serve as valuable feedstocks for the production of renewable biofuels. Governments worldwide are implementing policies and regulations to incentivize the use of biofuels as a cleaner alternative to fossil fuels, thereby fostering the growth of the biofuels market. Additionally, palm oil-based biofuels offer several advantages, including high energy content, low carbon footprint, and compatibility with existing infrastructure, making them attractive options for blending with conventional diesel fuel. Further, the scalability and cost-effectiveness of palm oil production further support the expansion of the biofuels segment. As the global focus on sustainable energy solutions intensifies, the biofuels segment is poised to sustain its rapid growth trajectory, driving innovation and investment in the Palm Oil And Palm Oil Derivatives Market.
Palm Oil And Palm Oil Derivatives Market Share Analysis: Food & Beverage held the dominant market share in 2024
The "Food & Beverage" segment stands as the largest within the Palm Oil And Palm Oil Derivatives Market distribution channels, commanding this position due to its extensive utilization of palm oil derivatives across a myriad of culinary applications. Palm oil's intrinsic attributes, including its high oxidative stability and versatility, render it indispensable in the food and beverage industry, where it serves as a key ingredient in various products spanning from cooking oils to baked goods and processed foods. Further, its neutral flavor profile and ability to enhance texture and shelf life make it a preferred choice among food manufacturers seeking reliable and cost-effective solutions. The sheer magnitude of palm oil's consumption in food and beverage formulations underscores its dominance in this segment. As consumer demand for processed foods continues to escalate and global food industries expand, the Food & Beverage distribution channel is poised to maintain its preeminence in driving the Palm Oil And Palm Oil Derivatives Market forward.
Palm Oil and Derivatives Market Segmentation
By Product
Crude Palm Oil (CPO)
Palm Kernel Oil (PKO)
Refined
Bleached
Deodorized (RBD) Palm Oil
Palm Olein
Palm Stearin
Others
By Application
Food
Personal Care
Pharmaceuticals
Biofuels
Animal Feed
Others
By Distribution Channel
Food & Beverage
Personal Care
Pharmaceuticals
Biofuel
Animal Feed
Others
Countries Analyzed
North America (US, Canada, Mexico)
Europe (Germany, UK, France, Spain, Italy, Russia, Rest of Europe)
Asia Pacific (China, India, Japan, South Korea, Australia, South East Asia, Rest of Asia)
South America (Brazil, Argentina, Rest of South America)
Middle East and Africa (Saudi Arabia, UAE, Rest of Middle East, South Africa, Egypt, Rest of Africa)
Palm Oil and Derivatives Companies Profiled in the Study
Archer Daniels Midland Company (ADM)
Caramuru Agri
Cargill Inc
Golden Agri-Resources
Nestlé SA
The Procter & Gamble Company
Unilever Plc
Wilmar International Ltd
*- List Not Exhaustive
Chapter 1. TABLE OF CONTENTS
Chapter 2. Introduction to Palm Oil and Derivatives Market
2.1. Market Overview
2.2. Key Statistics and Report Highlights
2.3. Scope of the Comprehensive Study
2.3.1. Market Definition
2.3.2 Countries and Regions Covered
2.3.3 Research Objective
2.3.4 Units, Currency, and Conversions
2.3.5 Industry Value Chain
2.4. Key Market Segments
2.5. Key Companies
2.6. Study Period
Chapter 3. Strategic Analysis Review
3.1. Palm Oil and Derivatives Pricing Analysis and Forecast
3.2. Porter’s Five Forces
3.3. Market Ecosystem
3.4. SWOT Analysis
3.5. Regulatory Scenario
3.3. Effects of Inflation, Russia-Ukraine War, moderating economic growth, and other macroeconomic factors
Chapter 4. Competitive Landscape
4.1. Market Share Analysis
4.1.1. Global Palm Oil and Derivatives Market Share by Company, 2023
4.1.2. Product Offerings of Leading Palm Oil and Derivatives Companies
4.2. Market Entropy
4.2.1. New Product Launches in the Industry
4.2.2. Mergers, Acquisitions, Joint ventures, and Partnerships
4.3. Key Strategies and Best Practices
Chapter 5. Global Market Projections: Best, Reference, and Low Case Scenarios
5.1. Growth Analysis- Case Scenario Definitions
5.2. Low Growth Case Scenario Forecasts
5.3. Reference Growth Case Scenario Forecasts
5.4. High Growth Case Scenario Forecasts
Chapter 6. Market Dynamics
6.1. Palm Oil and Derivatives Market Drivers
6.2. Palm Oil and Derivatives Market Challenges
6.6. Palm Oil and Derivatives Market Opportunities
6.4. Palm Oil and Derivatives Market Trends
Chapter 7. Global Palm Oil and Derivatives Market Outlook Trends
7.1. Global Palm Oil and Derivatives Revenue (USD Million) and CAGR (%) by Type (2021-2032)
7.2. Global Palm Oil and Derivatives Revenue (USD Million) and CAGR (%) by Application (2021-2032)
7.3. Global Palm Oil and Derivatives Revenue (USD Million) and CAGR (%) by Product (2021-2032)
By Product
Crude Palm Oil (CPO)
Palm Kernel Oil (PKO)
Refined
Bleached
Deodorized (RBD) Palm Oil
Palm Olein
Palm Stearin
Others
By Application
Food
Personal Care
Pharmaceuticals
Biofuels
Animal Feed
Others
By Distribution Channel
Food & Beverage
Personal Care
Pharmaceuticals
Biofuel
Animal Feed
Others
Chapter 8. Global Palm Oil and Derivatives Regional Analysis and Outlook
8.1. Global Palm Oil and Derivatives Revenue (USD Million) By Regions (2021- 2032)
8.2. North America Palm Oil and Derivatives Revenue (USD Million) by Country (2021-2032)
8.2.1. United States Palm Oil and Derivatives Regional Analysis and Outlook
8.2.2. Canada Palm Oil and Derivatives Regional Analysis and Outlook
8.2.3. Mexico Palm Oil and Derivatives Regional Analysis and Outlook
8.3. Europe Palm Oil and Derivatives Revenue (USD Million), by Country (2021-2032)
8.3.1. Germany Palm Oil and Derivatives Regional Analysis and Outlook
8.3.2. France Palm Oil and Derivatives Regional Analysis and Outlook
8.3.3. United Kingdom Palm Oil and Derivatives Regional Analysis and Outlook
8.3.4. Spain Palm Oil and Derivatives Regional Analysis and Outlook
8.3.5. Italy Palm Oil and Derivatives Regional Analysis and Outlook
8.3.6. Russia Palm Oil and Derivatives Regional Analysis and Outlook
8.3.7. Rest of Europe Palm Oil and Derivatives Regional Analysis and Outlook
8.4. Asia Pacific Palm Oil and Derivatives Revenue (USD Million) by Country (2021-2032)
8.4.1. China Palm Oil and Derivatives Regional Analysis and Outlook
8.4.2. Japan Palm Oil and Derivatives Regional Analysis and Outlook
8.4.3. India Palm Oil and Derivatives Regional Analysis and Outlook
8.4.4. South Korea Palm Oil and Derivatives Regional Analysis and Outlook
8.4.5. Australia Palm Oil and Derivatives Regional Analysis and Outlook
8.4.6. South East Asia Palm Oil and Derivatives Regional Analysis and Outlook
8.4.7. Rest of Asia Pacific Palm Oil and Derivatives Regional Analysis and Outlook
8.5. South America Palm Oil and Derivatives Revenue (USD Million), by Country (2021-2032)
8.5.1. Brazil Palm Oil and Derivatives Regional Analysis and Outlook
8.5.2. Argentina Palm Oil and Derivatives Regional Analysis and Outlook
8.5.3. Rest of South America Palm Oil and Derivatives Regional Analysis and Outlook
8.6. Middle East and Africa Palm Oil and Derivatives Revenue (USD Million) by Country (2021-2032)
8.6.1. Middle East Palm Oil and Derivatives Regional Analysis and Outlook
8.6.2. Africa Palm Oil and Derivatives Regional Analysis and Outlook
Chapter 9. North America Palm Oil and Derivatives Analysis and Outlook
9.1. North America Palm Oil and Derivatives Revenue (USD Million) by Segments (2021-2032)
9.1.1. North America Palm Oil and Derivatives Revenue (USD Million) by Type (2021-2032)
9.1.2. North America Palm Oil and Derivatives Revenue (USD Million) by Application (2021-2032)
9.1.3. North America Palm Oil and Derivatives Revenue (USD Million) by Product (2021-2032)
By Product
Crude Palm Oil (CPO)
Palm Kernel Oil (PKO)
Refined
Bleached
Deodorized (RBD) Palm Oil
Palm Olein
Palm Stearin
Others
By Application
Food
Personal Care
Pharmaceuticals
Biofuels
Animal Feed
Others
By Distribution Channel
Food & Beverage
Personal Care
Pharmaceuticals
Biofuel
Animal Feed
Others
Chapter 10. Europe Palm Oil and Derivatives Analysis and Outlook
10.1. Europe Palm Oil and Derivatives Revenue (USD Million), by Segments (USD Million) (2021-2032)
10.1.1. Europe Palm Oil and Derivatives Revenue (USD Million) by Type (2021-2032)
10.1.2. Europe Palm Oil and Derivatives Revenue (USD Million) by Application (2021-2032)
10.1.3. Europe Palm Oil and Derivatives Revenue (USD Million) by Product (2021-2032)
By Product
Crude Palm Oil (CPO)
Palm Kernel Oil (PKO)
Refined
Bleached
Deodorized (RBD) Palm Oil
Palm Olein
Palm Stearin
Others
By Application
Food
Personal Care
Pharmaceuticals
Biofuels
Animal Feed
Others
By Distribution Channel
Food & Beverage
Personal Care
Pharmaceuticals
Biofuel
Animal Feed
Others
Chapter 11. Asia Pacific Palm Oil and Derivatives Analysis and Outlook
11.1. Asia Pacific Palm Oil and Derivatives Revenue (USD Million), and Revenue (USD Million) by Segments (2021-2032)
11.1.1. Asia Pacific Palm Oil and Derivatives Revenue (USD Million) by Type (2021-2032)
11.1.2. Asia Pacific Palm Oil and Derivatives Revenue (USD Million) by Application (2021-2032)
11.1.3. Asia Pacific Palm Oil and Derivatives Revenue (USD Million) by Product (2021-2032)
By Product
Crude Palm Oil (CPO)
Palm Kernel Oil (PKO)
Refined
Bleached
Deodorized (RBD) Palm Oil
Palm Olein
Palm Stearin
Others
By Application
Food
Personal Care
Pharmaceuticals
Biofuels
Animal Feed
Others
By Distribution Channel
Food & Beverage
Personal Care
Pharmaceuticals
Biofuel
Animal Feed
Others
Chapter 12. South America Palm Oil and Derivatives Analysis and Outlook
12.1. South America Palm Oil and Derivatives Revenue (USD Million), by Segments (2021-2032)
12.1.1. South America Palm Oil and Derivatives Revenue (USD Million) by Type (2021-2032)
12.1.2. South America Palm Oil and Derivatives Revenue (USD Million) by Application (2021-2032)
12.1.3. South America Palm Oil and Derivatives Revenue (USD Million) by Product (2021-2032)
By Product
Crude Palm Oil (CPO)
Palm Kernel Oil (PKO)
Refined
Bleached
Deodorized (RBD) Palm Oil
Palm Olein
Palm Stearin
Others
By Application
Food
Personal Care
Pharmaceuticals
Biofuels
Animal Feed
Others
By Distribution Channel
Food & Beverage
Personal Care
Pharmaceuticals
Biofuel
Animal Feed
Others
Chapter 13. Middle East and Africa Palm Oil and Derivatives Analysis and Outlook
13.1. Middle East and Africa Palm Oil and Derivatives Revenue (USD Million), by Segments (2021-2032)
13.1.1. Middle East and Africa Palm Oil and Derivatives Revenue (USD Million) by Type (2021-2032)
13.1.2. Middle East and Africa Palm Oil and Derivatives Revenue (USD Million) by Application (2021-2032)
13.1.3. Middle East and Africa Palm Oil and Derivatives Revenue (USD Million) by Product (2021-2032)
By Product
Crude Palm Oil (CPO)
Palm Kernel Oil (PKO)
Refined
Bleached
Deodorized (RBD) Palm Oil
Palm Olein
Palm Stearin
Others
By Application
Food
Personal Care
Pharmaceuticals
Biofuels
Animal Feed
Others
By Distribution Channel
Food & Beverage
Personal Care
Pharmaceuticals
Biofuel
Animal Feed
Others
Chapter 14. Palm Oil and Derivatives Company Profiles
14.1 Business Overview
14.2 Product Profiles
14.3 SWOT Profiles
14.5 Recent Developments
14.6 Financial Profile
List of Companies
Archer Daniels Midland Company (ADM)
Caramuru Agri
Cargill Inc
Golden Agri-Resources
Nestlé SA
The Procter & Gamble Company
Unilever Plc
Wilmar International Ltd
15. Methodology and Data Sources
15.1 Customization Offerings
15.2 Subscription Services
15.3 Related Reports
15.4 Publisher Expertise
LIST OF TABLES
Table 1 Market Segmentation Analysis
Table 2 Global Palm Oil and Derivatives Market Share of Leading Companies, 2023
Table 3 Product Offerings of Leading Companies
Table 4 Low Growth Scenario Forecasts
Table 5 Reference Case Growth Scenario
Table 6 High Growth Case Scenario
Table 7 Global Palm Oil and Derivatives Revenue (USD Million) And CAGR (%) By Type (2021-2032)
Table 8 Global Palm Oil and Derivatives Revenue (USD Million) And CAGR (%) By Application (2021-2032)
Table 9 Global Palm Oil and Derivatives Revenue (USD Million) And CAGR (%) By Product (2021-2032)
Table 10 Global Palm Oil and Derivatives Market Revenue (USD Million) By Regions (2021-2032)
Table 11 Global Palm Oil and Derivatives Market Share (%) By Regions (2021-2032)
Table 12 North America Palm Oil and Derivatives Revenue (USD Million) By Country (2021-2032)
Table 13 Europe Palm Oil and Derivatives Revenue (USD Million) By Country (2021-2032)
Table 14 Asia Pacific Palm Oil and Derivatives Revenue (USD Million) By Country (2021-2032)
Table 15 South America Palm Oil and Derivatives Revenue (USD Million) By Country (2021-2032)
Table 16 Middle East and Africa Palm Oil and Derivatives Revenue (USD Million) By Region (2021-2032)
Table 17 North America Palm Oil and Derivatives Revenue (USD Million) By Type (2021-2032)
Table 18 North America Palm Oil and Derivatives Revenue (USD Million) By Application (2021-2032)
Table 19 North America Palm Oil and Derivatives Revenue (USD Million) By Product (2021-2032)
Table 20 Europe Palm Oil and Derivatives Revenue (USD Million) By Type (2021-2032)
Table 21 Europe Palm Oil and Derivatives Revenue (USD Million) By Application (2021-2032)
Table 22 Europe Palm Oil and Derivatives Revenue (USD Million) By Product (2021-2032)
Table 23 Asia Pacific Palm Oil and Derivatives Revenue (USD Million) By Type (2021-2032)
Table 24 Asia Pacific Palm Oil and Derivatives Revenue (USD Million) By Application (2021-2032)
Table 25 Asia Pacific Palm Oil and Derivatives Revenue (USD Million) By Product (2021-2032)
Table 26 South America Palm Oil and Derivatives Revenue (USD Million) By Type (2021-2032)
Table 27 South America Palm Oil and Derivatives Revenue (USD Million) By Application (2021-2032)
Table 28 South America Palm Oil and Derivatives Revenue (USD Million) By Product (2021-2032)
Table 29 Middle East and Africa Palm Oil and Derivatives Revenue (USD Million) By Type (2021-2032)
Table 30 Middle East and Africa Palm Oil and Derivatives Revenue (USD Million) By Application (2021-2032)
Table 31 Middle East and Africa Palm Oil and Derivatives Revenue (USD Million) By Product (2021-2032)
LIST OF FIGURES
Figure 1. Market Scope
Figure 2. Pricing Forecasts Per Unit, 2023- 2032
Figure 3. Porter’s Five Forces
Figure 4. Global Palm Oil and Derivatives Market Revenue (USD Million) By Regions (2021-2032)
Figure 5. Global Palm Oil and Derivatives Market Share (%) By Regions (2023)
Figure 6. North America Palm Oil and Derivatives Revenue (USD Million) By Country (2021-2032)
Figure 7. United States Palm Oil and Derivatives Revenue (USD Million) By Country (2021-2032)
Figure 8. Canada Palm Oil and Derivatives Revenue (USD Million) By Country (2021-2032)
Figure 9. Mexico Palm Oil and Derivatives Revenue (USD Million) By Country (2021-2032)
Figure 10. Europe Palm Oil and Derivatives Revenue (USD Million) By Country (2021-2032)
Figure 11. Germany Palm Oil and Derivatives Revenue (USD Million) By Country (2021-2032)
Figure 12. France Palm Oil and Derivatives Revenue (USD Million) By Country (2021-2032)
Figure 13. United Kingdom Palm Oil and Derivatives Revenue (USD Million) By Country (2021-2032)
Figure 14. Spain Palm Oil and Derivatives Revenue (USD Million) By Country (2021-2032)
Figure 15. Italy Palm Oil and Derivatives Revenue (USD Million) By Country (2021-2032)
Figure 16. Russia Palm Oil and Derivatives Revenue (USD Million) By Country (2021-2032)
Figure 17. Rest of Europe Palm Oil and Derivatives Revenue (USD Million) By Country (2021-2032)
Figure 11. Asia Pacific Palm Oil and Derivatives Revenue (USD Million) By Country (2021-2032)
Figure 12. China Palm Oil and Derivatives Revenue (USD Million) By Country (2021-2032)
Figure 13. Japan Palm Oil and Derivatives Revenue (USD Million) By Country (2021-2032)
Figure 14. India Palm Oil and Derivatives Revenue (USD Million) By Country (2021-2032)
Figure 15. South Korea Palm Oil and Derivatives Revenue (USD Million) By Country (2021-2032)
Figure 16. Australia Palm Oil and Derivatives Revenue (USD Million) By Country (2021-2032)
Figure 17. South East Asia Palm Oil and Derivatives Revenue (USD Million) By Country (2021-2032)
Figure 18. South America Palm Oil and Derivatives Revenue (USD Million) By Country (2021-2032)
Figure 19. Brazil Palm Oil and Derivatives Revenue (USD Million) By Country (2021-2032)
Figure 20. Argentina Palm Oil and Derivatives Revenue (USD Million) By Country (2021-2032)
Figure 21. Rest of Asia Pacific Palm Oil and Derivatives Revenue (USD Million) By Country (2021-2032)
Figure 22. Middle East and Africa Palm Oil and Derivatives Revenue (USD Million) By Region (2021-2032)
Figure 23. Saudi Arabia Palm Oil and Derivatives Revenue (USD Million) By Region (2021-2032)
Figure 24. The UAE Palm Oil and Derivatives Revenue (USD Million) By Region (2021-2032)
Figure 25. Rest of Middle East Palm Oil and Derivatives Revenue (USD Million) By Region (2021-2032)
Figure 26. South Africa Palm Oil and Derivatives Revenue (USD Million) By Region (2021-2032)
Figure 27. Africa Palm Oil and Derivatives Revenue (USD Million) By Region (2021-2032)
Figure 28. North America Palm Oil and Derivatives Revenue (USD Million) By Type (2021-2032)
Figure 29. North America Palm Oil and Derivatives Revenue (USD Million) By Application (2021-2032)
Figure 30. North America Palm Oil and Derivatives Revenue (USD Million) By Product (2021-2032)
Figure 31. Europe Palm Oil and Derivatives Revenue (USD Million) By Type (2021-2032)
Figure 32. Europe Palm Oil and Derivatives Revenue (USD Million) By Application (2021-2032)
Figure 33. Europe Palm Oil and Derivatives Revenue (USD Million) By Product (2021-2032)
Figure 34. Asia Pacific Palm Oil and Derivatives Revenue (USD Million) By Type (2021-2032)
Figure 35. Asia Pacific Palm Oil and Derivatives Revenue (USD Million) By Application (2021-2032)
Figure 36. Asia Pacific Palm Oil and Derivatives Revenue (USD Million) By Product (2021-2032)
Figure 37. South America Palm Oil and Derivatives Revenue (USD Million) By Type (2021-2032)
Figure 38. South America Palm Oil and Derivatives Revenue (USD Million) By Application (2021-2032)
Figure 39. South America Palm Oil and Derivatives Revenue (USD Million) By Product (2021-2032)
Figure 40. Middle East and Africa Palm Oil and Derivatives Revenue (USD Million) By Type (2021-2032)
Figure 41. Middle East and Africa Palm Oil and Derivatives Revenue (USD Million) By Application (2021-2032)
Figure 42. Middle East and Africa Palm Oil and Derivatives Revenue (USD Million) By Product (2021-2032)
By Product
Crude Palm Oil (CPO)
Palm Kernel Oil (PKO)
Refined
Bleached
Deodorized (RBD) Palm Oil
Palm Olein
Palm Stearin
Others
By Application
Food
Personal Care
Pharmaceuticals
Biofuels
Animal Feed
Others
By Distribution Channel
Food & Beverage
Personal Care
Pharmaceuticals
Biofuel
Animal Feed
Others
Countries Analyzed
North America (US, Canada, Mexico)
Europe (Germany, UK, France, Spain, Italy, Russia, Rest of Europe)
Asia Pacific (China, India, Japan, South Korea, Australia, South East Asia, Rest of Asia)
South America (Brazil, Argentina, Rest of South America)
Middle East and Africa (Saudi Arabia, UAE, Rest of Middle East, South Africa, Egypt, Rest of Africa)
