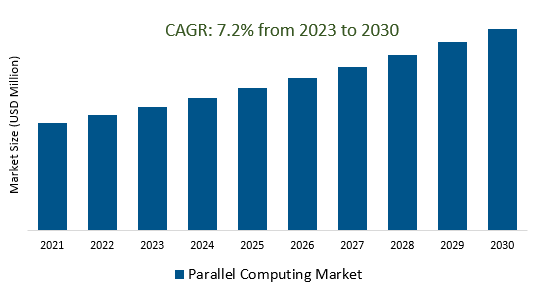
The Global Parallel Computing Market Size is estimated to register 7.2% growth over the forecast period from 2023 to 2030.
The market growth is driven by an increasing growth of deep learning and neural networks has driven the development of specialized hardware for training and inference tasks, creating demand for parallel processing. Leading Companies focusing on Exascale Computing, Quantum Computing Integration, Edge and IoT Parallel Computing, Distributed and Hybrid Computing, Security and Privacy Solutions, and others to boost market shares in the industry.
Market Overview
The parallel computing market involves the simultaneous execution of multiple tasks for enhanced computational efficiency, driven by hardware components, software frameworks, high-performance computing clusters, cloud-based services, and applications in big data analytics, AI, and quantum computing. It plays a critical role in various sectors and continues to grow, with an increasing focus on energy efficiency, security, and privacy, as well as substantial investments from governments and industry. Its future prospects are promising, as it addresses the escalating demand for high-performance computing and data-intensive applications across multiple domains.
Market Dynamics
Market Trends- Heterogeneous computing, which combines different types of processors to work together on a single task, is the future of parallel computing, as it offers the potential to significantly boost performance.
Heterogeneous computing, the integration of various processor types to collaborate on a singular task, represents the future of parallel computing. This approach holds the promise of greatly enhancing performance by leveraging the strengths of different processors. Heterogeneous computing, which combines different types of processors to work together on a single task, is the future of parallel computing, as it offers the potential to significantly boost performance.
Market Driver- The demand for cloud-based parallel computing services is growing rapidly, as businesses and organizations seek to leverage the scalability and cost-effectiveness of the cloud to accelerate their parallel computing workloads
The demand for cloud-based parallel computing services is growing rapidly, as businesses and organizations seek to leverage the scalability and cost-effectiveness of the cloud to accelerate their parallel computing workloads. Cloud-based parallel computing services offer flexibility and accessibility, allowing users to scale their computing resources on demand. This trend highlights the importance of cloud-based solutions in the parallel computing market.
Market Opportunity- AI and machine learning acceleration are driving demand for parallel computing solutions, as AI and machine learning workloads often require high levels of computational performance.
AI and machine learning are fueling the demand for parallel computing solutions due to the significant computational requirements of tasks like data processing, model training, and real-time inference. Parallel computing plays a crucial role in addressing these demands, particularly in the context of AI and machine learning applications.
Market Share Analysis- Software and Service the Parallel Computing Market will register the fastest growth
The Global Parallel Computing Market is analyzed across Software and Services, Hardware, Operations, and others. Software and Service is poised to register the fastest growth. The parallel computing market comprises software tools, such as programming models and specialized applications, along with consulting, implementation, and cloud-based services. These components are crucial for enabling efficient parallel processing, enhancing computational performance, and providing scalable access to parallel computing resources for businesses and organizations across diverse domains.
Market Share Analysis- BFSI held a significant market share in 2023
The Global Product Engineering Service Market is analyzed across various applications including BFSI, Manufacturing, Healthcare and Life Sciences, Energy and utilities, Education and research, and others. Of these, BFSI held a significant market share in 2023. In the BFSI (Banking, Financial Services, and Insurance) sector, parallel computing is essential for speeding up data processing, enhancing risk analysis, fraud detection, and financial modeling. With increasing data volumes and the demand for real-time analytics, parallel computing solutions are vital for more effective decision-making, data security, and optimizing trading strategies within the sector.
Parallel Computing Market Segmentation
By Type
- Software and Service
- Hardware
By Application
- BFSI
- Manufacturing
- Healthcare & Life Sciences
- Energy & Utilities
- Education & Research
- Others
By Region
- North America (United States, Canada, Mexico)
- Europe (Germany, France, United Kingdom, Spain, Italy, Others)
- Asia Pacific (China, India, Japan, South Korea, Australia, Others)
- Latin America (Brazil, Argentina, Others)
- Middle East and Africa (Saudi Arabia, UAE, Kuwait, Other Middle East, South Africa, Nigeria, Other Africa)
Parallel Computing Market Companies
- Amazon (AWS)
- Dell
- Lenovo
- DataDirect Networks
- IBM
- Inspur
- Hewlett Packard Enterprise (HPE)
- Microsoft
- Atos
- Huawei
- sugon
- Alibaba Cloud
*List not exhaustive
Parallel Computing Market Outlook 2023
1 Market Overview
1.1 Introduction to the Parallel Computing Market
1.2 Scope of the Study
1.3 Research Objective
1.3.1 Key Market Scope and Segments
1.3.2 Players Covered
1.3.3 Years Considered
2 Executive Summary
2.1 2023 Parallel Computing Industry- Market Statistics
3 Market Dynamics
3.1 Market Drivers
3.2 Market Challenges
3.3 Market Opportunities
3.4 Market Trends
4 Market Factor Analysis
4.1 Porter’s Five Forces
4.2 Market Entropy
4.2.1 Global Parallel Computing Market Companies with Area Served
4.2.2 Products Offerings Global Parallel Computing Market
5 COVID-19 Impact Analysis and Outlook Scenarios
5.1.1 Covid-19 Impact Analysis
5.1.2 post-COVID-19 Scenario- Low Growth Case
5.1.3 post-COVID-19 Scenario- Reference Growth Case
5.1.4 post-COVID-19 Scenario- Low Growth Case
6 Global Parallel Computing Market Trends
6.1 Global Parallel Computing Revenue (USD Million) and CAGR (%) by Type (2018-2030)
6.2 Global Parallel Computing Revenue (USD Million) and CAGR (%) by Applications (2018-2030)
6.3 Global Parallel Computing Revenue (USD Million) and CAGR (%) by regions (2018-2030)
7 Global Parallel Computing Market Revenue (USD Million) by Type, and Applications (2018-2022)
7.1 Global Parallel Computing Revenue (USD Million) by Type (2018-2022)
7.1.1 Global Parallel Computing Revenue (USD Million), Market Share (%) by Type (2018-2022)
7.2 Global Parallel Computing Revenue (USD Million) by Applications (2018-2022)
7.2.1 Global Parallel Computing Revenue (USD Million), Market Share (%) by Applications (2018-2022)
8 Global Parallel Computing Development Regional Status and Outlook
8.1 Global Parallel Computing Revenue (USD Million) By Regions (2018-2022)
8.2 North America Parallel Computing Revenue (USD Million) by Type, and Application (2018-2022)
8.2.1 North America Parallel Computing Revenue (USD Million) by Country (2018-2022)
8.2.2 North America Parallel Computing Revenue (USD Million) by Type (2018-2022)
8.2.3 North America Parallel Computing Revenue (USD Million) by Applications (2018-2022)
8.3 Europe Parallel Computing Revenue (USD Million), by Type, and Applications (USD Million) (2018-2022)
8.3.1 Europe Parallel Computing Revenue (USD Million), by Country (2018-2022)
8.3.2 Europe Parallel Computing Revenue (USD Million) by Type (2018-2022)
8.3.3 Europe Parallel Computing Revenue (USD Million) by Applications (2018-2022)
8.4 Asia Pacific Parallel Computing Revenue (USD Million), and Revenue (USD Million) by Type, and Applications (2018-2022)
8.4.1 Asia Pacific Parallel Computing Revenue (USD Million) by Country (2018-2022)
8.4.2 Asia Pacific Parallel Computing Revenue (USD Million) by Type (2018-2022)
8.4.3 Asia Pacific Parallel Computing Revenue (USD Million) by Applications (2018-2022)
8.5 South America Parallel Computing Revenue (USD Million), by Type, and Applications (2018-2022)
8.5.1 South America Parallel Computing Revenue (USD Million), by Country (2018-2022)
8.5.2 South America Parallel Computing Revenue (USD Million) by Type (2018-2022)
8.5.3 South America Parallel Computing Revenue (USD Million) by Applications (2018-2022)
8.6 Middle East and Africa Parallel Computing Revenue (USD Million), by Type, Technology, Application, Thickness (2018-2022)
8.6.1 Middle East and Africa Parallel Computing Revenue (USD Million) by Country (2018-2022)
8.6.2 Middle East and Africa Parallel Computing Revenue (USD Million) by Type (2018-2022)
8.6.3 Middle East and Africa Parallel Computing Revenue (USD Million) by Applications (2018-2022)
9 Company Profiles
10 Global Parallel Computing Market Revenue (USD Million), by Type, and Applications (2023-2030)
10.1 Global Parallel Computing Revenue (USD Million) and Market Share (%) by Type (2023-2030)
10.1.1 Global Parallel Computing Revenue (USD Million), and Market Share (%) by Type (2023-2030)
10.2 Global Parallel Computing Revenue (USD Million) and Market Share (%) by Applications (2023-2030)
10.2.1 Global Parallel Computing Revenue (USD Million), and Market Share (%) by Applications (2023-2030)
11 Global Parallel Computing Development Regional Status and Outlook Forecast
11.1 Global Parallel Computing Revenue (USD Million) By Regions (2023-2030)
11.2 North America Parallel Computing Revenue (USD Million) by Type, and Applications (2023-2030)
11.2.1 North America Parallel Computing Revenue (USD) Million by Country (2023-2030)
11.2.2 North America Parallel Computing Revenue (USD Million), by Type (2023-2030)
11.2.3 North America Parallel Computing Revenue (USD Million), Market Share (%) by Applications (2023-2030)
11.3 Europe Parallel Computing Revenue (USD Million), by Type, and Applications (2023-2030)
11.3.1 Europe Parallel Computing Revenue (USD Million), by Country (2023-2030)
11.3.2 Europe Parallel Computing Revenue (USD Million), by Type (2023-2030)
11.3.3 Europe Parallel Computing Revenue (USD Million), by Applications (2023-2030)
11.4 Asia Pacific Parallel Computing Revenue (USD Million) by Type, and Applications (2023-2030)
11.4.1 Asia Pacific Parallel Computing Revenue (USD Million), by Country (2023-2030)
11.4.2 Asia Pacific Parallel Computing Revenue (USD Million), by Type (2023-2030)
11.4.3 Asia Pacific Parallel Computing Revenue (USD Million), by Applications (2023-2030)
11.5 South America Parallel Computing Revenue (USD Million), by Type, and Applications (2023-2030)
11.5.1 South America Parallel Computing Revenue (USD Million), by Country (2023-2030)
11.5.2 South America Parallel Computing Revenue (USD Million), by Type (2023-2030)
11.5.3 South America Parallel Computing Revenue (USD Million), by Applications (2023-2030)
11.6 Middle East and Africa Parallel Computing Revenue (USD Million), by Type, and Applications (2023-2030)
11.6.1 Middle East and Africa Parallel Computing Revenue (USD Million), by region (2023-2030)
11.6.2 Middle East and Africa Parallel Computing Revenue (USD Million), by Type (2023-2030)
11.6.3 Middle East and Africa Parallel Computing Revenue (USD Million), by Applications (2023-2030)
12 Methodology and Data Sources
12.1 Methodology/Research Approach
12.1.1 Research Programs/Design
12.1.2 Market Size Estimation
12.1.3 Market Breakdown and Data Triangulation
12.2 Data Sources
12.2.1 Secondary Sources
12.2.2 Primary Sources
12.3 Disclaimer
List of Tables
Table 1 Market Segmentation Analysis
Table 2 Global Parallel Computing Market Companies with Areas Served
Table 3 Products Offerings Global Parallel Computing Market
Table 4 Low Growth Scenario Forecasts
Table 5 Reference Case Growth Scenario
Table 6 High Growth Case Scenario
Table 7 Global Parallel Computing Revenue (USD Million) And CAGR (%) By Type (2018-2030)
Table 8 Global Parallel Computing Revenue (USD Million) And CAGR (%) By Applications (2018-2030)
Table 9 Global Parallel Computing Revenue (USD Million) And CAGR (%) By Regions (2018-2030)
Table 10 Global Parallel Computing Revenue (USD Million) By Type (2018-2022)
Table 11 Global Parallel Computing Revenue Market Share (%) By Type (2018-2022)
Table 12 Global Parallel Computing Revenue (USD Million) By Applications (2018-2022)
Table 13 Global Parallel Computing Revenue Market Share (%) By Applications (2018-2022)
Table 14 Global Parallel Computing Market Revenue (USD Million) By Regions (2018-2022)
Table 15 Global Parallel Computing Market Share (%) By Regions (2018-2022)
Table 16 North America Parallel Computing Revenue (USD Million) By Country (2018-2022)
Table 17 North America Parallel Computing Revenue (USD Million) By Type (2018-2022)
Table 18 North America Parallel Computing Revenue (USD Million) By Applications (2018-2022)
Table 19 Europe Parallel Computing Revenue (USD Million) By Country (2018-2022)
Table 20 Europe Parallel Computing Revenue (USD Million) By Type (2018-2022)
Table 21 Europe Parallel Computing Revenue (USD Million) By Applications (2018-2022)
Table 22 Asia Pacific Parallel Computing Revenue (USD Million) By Country (2018-2022)
Table 23 Asia Pacific Parallel Computing Revenue (USD Million) By Type (2018-2022)
Table 24 Asia Pacific Parallel Computing Revenue (USD Million) By Applications (2018-2022)
Table 25 South America Parallel Computing Revenue (USD Million) By Country (2018-2022)
Table 26 South America Parallel Computing Revenue (USD Million) By Type (2018-2022)
Table 27 South America Parallel Computing Revenue (USD Million) By Applications (2018-2022)
Table 28 Middle East and Africa Parallel Computing Revenue (USD Million) By Region (2018-2022)
Table 29 Middle East and Africa Parallel Computing Revenue (USD Million) By Type (2018-2022)
Table 30 Middle East and Africa Parallel Computing Revenue (USD Million) By Applications (2018-2022)
Table 31 Financial Analysis
Table 32 Global Parallel Computing Revenue (USD Million) By Type (2023-2030)
Table 33 Global Parallel Computing Revenue Market Share (%) By Type (2023-2030)
Table 34 Global Parallel Computing Revenue (USD Million) By Applications (2023-2030)
Table 35 Global Parallel Computing Revenue Market Share (%) By Applications (2023-2030)
Table 36 Global Parallel Computing Market Revenue (USD Million), And Revenue (USD Million) By Regions (2023-2030)
Table 37 North America Parallel Computing Revenue (USD)By Country (2023-2030)
Table 38 North America Parallel Computing Revenue (USD Million) By Type (2023-2030)
Table 39 North America Parallel Computing Revenue (USD Million) By Applications (2023-2030)
Table 40 Europe Parallel Computing Revenue (USD Million) By Country (2023-2030)
Table 41 Europe Parallel Computing Revenue (USD Million) By Type (2023-2030)
Table 42 Europe Parallel Computing Revenue (USD Million) By Applications (2023-2030)
Table 43 Asia Pacific Parallel Computing Revenue (USD Million) By Country (2023-2030)
Table 44 Asia Pacific Parallel Computing Revenue (USD Million) By Type (2023-2030)
Table 45 Asia Pacific Parallel Computing Revenue (USD Million) By Applications (2023-2030)
Table 46 South America Parallel Computing Revenue (USD Million) By Country (2023-2030)
Table 47 South America Parallel Computing Revenue (USD Million) By Type (2023-2030)
Table 48 South America Parallel Computing Revenue (USD Million) By Applications (2023-2030)
Table 49 Middle East and Africa Parallel Computing Revenue (USD Million) By Region (2023-2030)
Table 50 Middle East and Africa Parallel Computing Revenue (USD Million) By Region (2023-2030)
Table 51 Middle East and Africa Parallel Computing Revenue (USD Million) By Type (2023-2030)
Table 52 Middle East and Africa Parallel Computing Revenue (USD Million) By Applications (2023-2030)
Table 53 Research Programs/Design for This Report
Table 54 Key Data Information from Secondary Sources
Table 55 Key Data Information from Primary Sources
List of Figures
Figure 1 Market Scope
Figure 2 Porter’s Five Forces
Figure 3 Global Parallel Computing Revenue (USD Million) By Type (2018-2022)
Figure 4 Global Parallel Computing Revenue Market Share (%) By Type (2022)
Figure 5 Global Parallel Computing Revenue (USD Million) By Applications (2018-2022)
Figure 6 Global Parallel Computing Revenue Market Share (%) By Applications (2022)
Figure 7 Global Parallel Computing Market Revenue (USD Million) By Regions (2018-2022)
Figure 8 Global Parallel Computing Market Share (%) By Regions (2022)
Figure 9 North America Parallel Computing Revenue (USD Million) By Country (2018-2022)
Figure 10 North America Parallel Computing Revenue (USD Million) By Type (2018-2022)
Figure 11 North America Parallel Computing Revenue (USD Million) By Applications (2018-2022)
Figure 12 Europe Parallel Computing Revenue (USD Million) By Country (2018-2022)
Figure 13 Europe Parallel Computing Revenue (USD Million) By Type (2018-2022)
Figure 14 Europe Parallel Computing Revenue (USD Million) By Applications (2018-2022)
Figure 15 Asia Pacific Parallel Computing Revenue (USD Million) By Country (2018-2022)
Figure 16 Asia Pacific Parallel Computing Revenue (USD Million) By Type (2018-2022)
Figure 17 Asia Pacific Parallel Computing Revenue (USD Million) By Applications (2018-2022)
Figure 18 South America Parallel Computing Revenue (USD Million) By Country (2018-2022)
Figure 19 South America Parallel Computing Revenue (USD Million) By Type (2018-2022)
Figure 20 South America Parallel Computing Revenue (USD Million) By Applications (2018-2022)
Figure 21 Middle East and Africa Parallel Computing Revenue (USD Million) By Region (2018-2022)
Figure 22 Middle East and Africa Parallel Computing Revenue (USD Million) By Type (2018-2022)
Figure 23 Middle East and Africa Parallel Computing Revenue (USD Million) By Applications (2018-2022)
Figure 24 Global Parallel Computing Revenue (USD Million) By Type (2023-2030)
Figure 25 Global Parallel Computing Revenue Market Share (%) By Type (2030)
Figure 26 Global Parallel Computing Revenue (USD Million) By Applications (2023-2030)
Figure 27 Global Parallel Computing Revenue Market Share (%) By Applications (2030)
Figure 28 Global Parallel Computing Market Revenue (USD Million) By Regions (2023-2030)
Figure 29 North America Parallel Computing Revenue (USD Million) By Country (2023-2030)
Figure 30 North America Parallel Computing Revenue (USD Million) By Type (2023-2030)
Figure 31 North America Parallel Computing Revenue (USD Million) By Applications (2023-2030)
Figure 32 Europe Parallel Computing Revenue (USD Million) By Country (2023-2030)
Figure 33 Europe Parallel Computing Revenue (USD Million) By Type (2023-2030)
Figure 34 Europe Parallel Computing Revenue (USD Million) By Applications (2023-2030)
Figure 35 Asia Pacific Parallel Computing Revenue (USD Million) By Country (2023-2030)
Figure 36 Asia Pacific Parallel Computing Revenue (USD Million) By Type (2023-2030)
Figure 37 Asia Pacific Parallel Computing Revenue (USD Million) By Applications (2023-2030)
Figure 38 South America Parallel Computing Revenue (USD Million) By Country (2023-2030)
Figure 39 South America Parallel Computing Revenue (USD Million) By Type (2023-2030)
Figure 40 South America Parallel Computing Revenue (USD Million) By Applications (2023-2030)
Figure 41 Middle East and Africa Parallel Computing Revenue (USD Million) By Region (2023-2030)
Figure 42 Middle East and Africa Parallel Computing Revenue (USD Million) By Region (2023-2030)
Figure 43 Middle East and Africa Parallel Computing Revenue (USD Million) By Type (2023-2030)
Figure 44 Middle East and Africa Parallel Computing Revenue (USD Million) By Applications (2023-2030)
Figure 45 Bottom-Up and Top-Down Approaches for This Report
Figure 46 Data Triangulation
