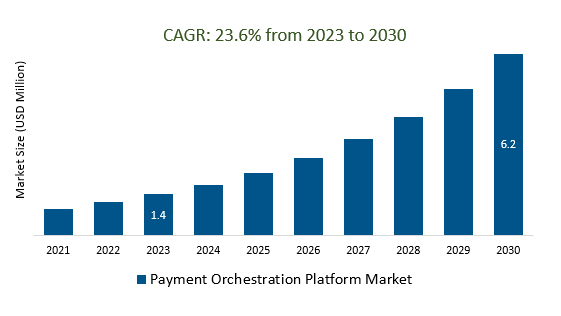
The Global Payment Orchestration Platform Market Size is estimated to be US 1.4 billion in 2023 and is poised to register 23.6% growth over the forecast period from 2023 to 2030 to reach US $ 6.2 billion in 2030.
The market growth is driven by the increasing businesses across industries that are increasingly adopting digital payment methods to streamline their operations and enhance the customer experience. Payment orchestration platforms help facilitate this transformation by providing a unified approach to managing diverse payment methods. Leading companies that are focused on E-commerce Growth, Globalization, Emerging Markets, Fintech Innovation, Customer Experience Focus, Market Consolidation, and others to boost market shares in the industry.
Market Overview
Payment Orchestration Platforms (POPs) are central hubs that streamline and optimize payment processes, offering businesses the ability to manage multiple payment methods, providers, and gateways efficiently. Key features include payment method aggregation, PSP integration, cross-border capabilities, security and compliance, payment routing and optimization, analytics, and customization. The POP market is driven by e-commerce growth, global expansion, fintech innovation, regulatory changes, a focus on customer experience, data-driven insights, and support for real-time payments.
Market Dynamics
Market Trends - Data Analytics and Insights: The Key to Driving Payment Orchestration Success
Data analytics and insights are essential for the success of Payment Orchestration. They empower businesses to optimize payments, enhance security, reduce costs, and improve the customer experience. Leveraging transaction data for intelligent decision-making leads to higher payment success rates and better alignment with customer preferences, making it a fundamental aspect of Payment Orchestration success in today's evolving payment landscape.
Market Driver- Digital Transformation Demand Payment Orchestration Platform Market
The Payment Orchestration Platform (POP) market is witnessing growing demand driven by the imperative for digital transformation in businesses. As companies increasingly embrace digital strategies to enhance customer experiences and streamline operations, POPs have become essential tools. They enable efficient management of diverse digital payment methods, integration with multiple payment service providers, and adaptation to the evolving digital landscape, making them crucial for delivering seamless and secure digital payment experiences and a key component of modern business strategies.
Market Opportunity-Introduction of Demand for Real-time Payments
The Payment Orchestration Platform (POP) market is strongly influenced by the increasing demand for real-time payments. Businesses and consumers now expect rapid transaction processing, prompting POPs to adapt and support real-time payment capabilities to ensure swift and efficient payment processing. This demand for instant transactions aligns with the broader trend of providing convenience and immediate satisfaction, making real-time capabilities a pivotal factor for the ongoing growth and significance of POPs in the payment industry.
Market Share Analysis- The B2B Payment Orchestration Platform Market will register the fastest growth
The Global Payment Orchestration Platform Market is analyzed across B2B, B2C, C2C, and others. B2B is poised to register the fastest growth. The B2B (Business-to-Business) segment represents a significant and growing market for Payment Orchestration Platforms (POPs). B2B businesses increasingly rely on POPs to manage diverse payment methods, streamline transactions, enhance security, and offer flexible payment options to clients. These platforms play a vital role in optimizing payment processes and providing valuable data insights, making them essential for B2B organizations navigating complex payment ecosystems.
Market Share Analysis- Advanced Analytics & Reporting held a significant market share in 2023
The Global Payment Orchestration Platform Market is analyzed across various Functions including Cross Border Transactions, Risk Management, Advanced Analytics & Reporting, and others. Of these, Advanced Analytics & Reporting held a significant market share in 2023. Advanced analytics and reporting are integral to the Payment Orchestration Platform (POP) market, offering businesses powerful tools for deriving actionable insights from transaction data. This enables optimization of payment strategies, improved decision-making, fraud detection, and enhanced customer payment experiences. Robust reporting features provide visibility into key performance metrics, allowing businesses to track transaction success rates and identify trends.
Payment Orchestration Platform Market Segmentation
By Type
By Functionality
- Cross Border Transactions
- Risk Management
- Advanced Analytics & Reporting
By End-User
- BFSI
- E-commerce
- Healthcare
- Travel & Hospitality
- Others
By Region
- North America (United States, Canada, Mexico)
- Europe (Germany, France, United Kingdom, Spain, Italy, Others)
- Asia Pacific (China, India, Japan, South Korea, Australia, Others)
- Latin America (Brazil, Argentina, Others)
- Middle East and Africa (Saudi Arabia, UAE, Kuwait, Other Middle East, South Africa, Nigeria, Other Africa)
Payment Orchestration Platform Market Companies
- Cellpointer Digital
- IXOLIT Group
- Payoneer Inc.
- APEXX Fintech Limited
- Rebilly
- Spreedly
- Modo Payments
- Akurateco
- BNT Soft
- Aye4fin GmbH
*List not exhaustive
Payment Orchestration Platform Market Outlook 2023
1 Market Overview
1.1 Introduction to the Payment Orchestration Platform Market
1.2 Scope of the Study
1.3 Research Objective
1.3.1 Key Market Scope and Segments
1.3.2 Players Covered
1.3.3 Years Considered
2 Executive Summary
2.1 2023 Payment Orchestration Platform Industry- Market Statistics
3 Market Dynamics
3.1 Market Drivers
3.2 Market Challenges
3.3 Market Opportunities
3.4 Market Trends
4 Market Factor Analysis
4.1 Porter’s Five Forces
4.2 Market Entropy
4.2.1 Global Payment Orchestration Platform Market Companies with Area Served
4.2.2 Products Offerings Global Payment Orchestration Platform Market
5 COVID-19 Impact Analysis and Outlook Scenarios
5.1.1 Covid-19 Impact Analysis
5.1.2 post-COVID-19 Scenario- Low Growth Case
5.1.3 post-COVID-19 Scenario- Reference Growth Case
5.1.4 post-COVID-19 Scenario- Low Growth Case
6 Global Payment Orchestration Platform Market Trends
6.1 Global Payment Orchestration Platform Revenue (USD Million) and CAGR (%) by Type (2018-2030)
6.2 Global Payment Orchestration Platform Revenue (USD Million) and CAGR (%) by Applications (2018-2030)
6.3 Global Payment Orchestration Platform Revenue (USD Million) and CAGR (%) by regions (2018-2030)
7 Global Payment Orchestration Platform Market Revenue (USD Million) by Type, and Applications (2018-2022)
7.1 Global Payment Orchestration Platform Revenue (USD Million) by Type (2018-2022)
7.1.1 Global Payment Orchestration Platform Revenue (USD Million), Market Share (%) by Type (2018-2022)
7.2 Global Payment Orchestration Platform Revenue (USD Million) by Applications (2018-2022)
7.2.1 Global Payment Orchestration Platform Revenue (USD Million), Market Share (%) by Applications (2018-2022)
8 Global Payment Orchestration Platform Development Regional Status and Outlook
8.1 Global Payment Orchestration Platform Revenue (USD Million) By Regions (2018-2022)
8.2 North America Payment Orchestration Platform Revenue (USD Million) by Type, and Application (2018-2022)
8.2.1 North America Payment Orchestration Platform Revenue (USD Million) by Country (2018-2022)
8.2.2 North America Payment Orchestration Platform Revenue (USD Million) by Type (2018-2022)
8.2.3 North America Payment Orchestration Platform Revenue (USD Million) by Applications (2018-2022)
8.3 Europe Payment Orchestration Platform Revenue (USD Million), by Type, and Applications (USD Million) (2018-2022)
8.3.1 Europe Payment Orchestration Platform Revenue (USD Million), by Country (2018-2022)
8.3.2 Europe Payment Orchestration Platform Revenue (USD Million) by Type (2018-2022)
8.3.3 Europe Payment Orchestration Platform Revenue (USD Million) by Applications (2018-2022)
8.4 Asia Pacific Payment Orchestration Platform Revenue (USD Million), and Revenue (USD Million) by Type, and Applications (2018-2022)
8.4.1 Asia Pacific Payment Orchestration Platform Revenue (USD Million) by Country (2018-2022)
8.4.2 Asia Pacific Payment Orchestration Platform Revenue (USD Million) by Type (2018-2022)
8.4.3 Asia Pacific Payment Orchestration Platform Revenue (USD Million) by Applications (2018-2022)
8.5 South America Payment Orchestration Platform Revenue (USD Million), by Type, and Applications (2018-2022)
8.5.1 South America Payment Orchestration Platform Revenue (USD Million), by Country (2018-2022)
8.5.2 South America Payment Orchestration Platform Revenue (USD Million) by Type (2018-2022)
8.5.3 South America Payment Orchestration Platform Revenue (USD Million) by Applications (2018-2022)
8.6 Middle East and Africa Payment Orchestration Platform Revenue (USD Million), by Type, Technology, Application, Thickness (2018-2022)
8.6.1 Middle East and Africa Payment Orchestration Platform Revenue (USD Million) by Country (2018-2022)
8.6.2 Middle East and Africa Payment Orchestration Platform Revenue (USD Million) by Type (2018-2022)
8.6.3 Middle East and Africa Payment Orchestration Platform Revenue (USD Million) by Applications (2018-2022)
9 Company Profiles
10 Global Payment Orchestration Platform Market Revenue (USD Million), by Type, and Applications (2023-2030)
10.1 Global Payment Orchestration Platform Revenue (USD Million) and Market Share (%) by Type (2023-2030)
10.1.1 Global Payment Orchestration Platform Revenue (USD Million), and Market Share (%) by Type (2023-2030)
10.2 Global Payment Orchestration Platform Revenue (USD Million) and Market Share (%) by Applications (2023-2030)
10.2.1 Global Payment Orchestration Platform Revenue (USD Million), and Market Share (%) by Applications (2023-2030)
11 Global Payment Orchestration Platform Development Regional Status and Outlook Forecast
11.1 Global Payment Orchestration Platform Revenue (USD Million) By Regions (2023-2030)
11.2 North America Payment Orchestration Platform Revenue (USD Million) by Type, and Applications (2023-2030)
11.2.1 North America Payment Orchestration Platform Revenue (USD) Million by Country (2023-2030)
11.2.2 North America Payment Orchestration Platform Revenue (USD Million), by Type (2023-2030)
11.2.3 North America Payment Orchestration Platform Revenue (USD Million), Market Share (%) by Applications (2023-2030)
11.3 Europe Payment Orchestration Platform Revenue (USD Million), by Type, and Applications (2023-2030)
11.3.1 Europe Payment Orchestration Platform Revenue (USD Million), by Country (2023-2030)
11.3.2 Europe Payment Orchestration Platform Revenue (USD Million), by Type (2023-2030)
11.3.3 Europe Payment Orchestration Platform Revenue (USD Million), by Applications (2023-2030)
11.4 Asia Pacific Payment Orchestration Platform Revenue (USD Million) by Type, and Applications (2023-2030)
11.4.1 Asia Pacific Payment Orchestration Platform Revenue (USD Million), by Country (2023-2030)
11.4.2 Asia Pacific Payment Orchestration Platform Revenue (USD Million), by Type (2023-2030)
11.4.3 Asia Pacific Payment Orchestration Platform Revenue (USD Million), by Applications (2023-2030)
11.5 South America Payment Orchestration Platform Revenue (USD Million), by Type, and Applications (2023-2030)
11.5.1 South America Payment Orchestration Platform Revenue (USD Million), by Country (2023-2030)
11.5.2 South America Payment Orchestration Platform Revenue (USD Million), by Type (2023-2030)
11.5.3 South America Payment Orchestration Platform Revenue (USD Million), by Applications (2023-2030)
11.6 Middle East and Africa Payment Orchestration Platform Revenue (USD Million), by Type, and Applications (2023-2030)
11.6.1 Middle East and Africa Payment Orchestration Platform Revenue (USD Million), by region (2023-2030)
11.6.2 Middle East and Africa Payment Orchestration Platform Revenue (USD Million), by Type (2023-2030)
11.6.3 Middle East and Africa Payment Orchestration Platform Revenue (USD Million), by Applications (2023-2030)
12 Methodology and Data Sources
12.1 Methodology/Research Approach
12.1.1 Research Programs/Design
12.1.2 Market Size Estimation
12.1.3 Market Breakdown and Data Triangulation
12.2 Data Sources
12.2.1 Secondary Sources
12.2.2 Primary Sources
12.3 Disclaimer
List of Tables
Table 1 Market Segmentation Analysis
Table 2 Global Payment Orchestration Platform Market Companies with Areas Served
Table 3 Products Offerings Global Payment Orchestration Platform Market
Table 4 Low Growth Scenario Forecasts
Table 5 Reference Case Growth Scenario
Table 6 High Growth Case Scenario
Table 7 Global Payment Orchestration Platform Revenue (USD Million) And CAGR (%) By Type (2018-2030)
Table 8 Global Payment Orchestration Platform Revenue (USD Million) And CAGR (%) By Applications (2018-2030)
Table 9 Global Payment Orchestration Platform Revenue (USD Million) And CAGR (%) By Regions (2018-2030)
Table 10 Global Payment Orchestration Platform Revenue (USD Million) By Type (2018-2022)
Table 11 Global Payment Orchestration Platform Revenue Market Share (%) By Type (2018-2022)
Table 12 Global Payment Orchestration Platform Revenue (USD Million) By Applications (2018-2022)
Table 13 Global Payment Orchestration Platform Revenue Market Share (%) By Applications (2018-2022)
Table 14 Global Payment Orchestration Platform Market Revenue (USD Million) By Regions (2018-2022)
Table 15 Global Payment Orchestration Platform Market Share (%) By Regions (2018-2022)
Table 16 North America Payment Orchestration Platform Revenue (USD Million) By Country (2018-2022)
Table 17 North America Payment Orchestration Platform Revenue (USD Million) By Type (2018-2022)
Table 18 North America Payment Orchestration Platform Revenue (USD Million) By Applications (2018-2022)
Table 19 Europe Payment Orchestration Platform Revenue (USD Million) By Country (2018-2022)
Table 20 Europe Payment Orchestration Platform Revenue (USD Million) By Type (2018-2022)
Table 21 Europe Payment Orchestration Platform Revenue (USD Million) By Applications (2018-2022)
Table 22 Asia Pacific Payment Orchestration Platform Revenue (USD Million) By Country (2018-2022)
Table 23 Asia Pacific Payment Orchestration Platform Revenue (USD Million) By Type (2018-2022)
Table 24 Asia Pacific Payment Orchestration Platform Revenue (USD Million) By Applications (2018-2022)
Table 25 South America Payment Orchestration Platform Revenue (USD Million) By Country (2018-2022)
Table 26 South America Payment Orchestration Platform Revenue (USD Million) By Type (2018-2022)
Table 27 South America Payment Orchestration Platform Revenue (USD Million) By Applications (2018-2022)
Table 28 Middle East and Africa Payment Orchestration Platform Revenue (USD Million) By Region (2018-2022)
Table 29 Middle East and Africa Payment Orchestration Platform Revenue (USD Million) By Type (2018-2022)
Table 30 Middle East and Africa Payment Orchestration Platform Revenue (USD Million) By Applications (2018-2022)
Table 31 Financial Analysis
Table 32 Global Payment Orchestration Platform Revenue (USD Million) By Type (2023-2030)
Table 33 Global Payment Orchestration Platform Revenue Market Share (%) By Type (2023-2030)
Table 34 Global Payment Orchestration Platform Revenue (USD Million) By Applications (2023-2030)
Table 35 Global Payment Orchestration Platform Revenue Market Share (%) By Applications (2023-2030)
Table 36 Global Payment Orchestration Platform Market Revenue (USD Million), And Revenue (USD Million) By Regions (2023-2030)
Table 37 North America Payment Orchestration Platform Revenue (USD)By Country (2023-2030)
Table 38 North America Payment Orchestration Platform Revenue (USD Million) By Type (2023-2030)
Table 39 North America Payment Orchestration Platform Revenue (USD Million) By Applications (2023-2030)
Table 40 Europe Payment Orchestration Platform Revenue (USD Million) By Country (2023-2030)
Table 41 Europe Payment Orchestration Platform Revenue (USD Million) By Type (2023-2030)
Table 42 Europe Payment Orchestration Platform Revenue (USD Million) By Applications (2023-2030)
Table 43 Asia Pacific Payment Orchestration Platform Revenue (USD Million) By Country (2023-2030)
Table 44 Asia Pacific Payment Orchestration Platform Revenue (USD Million) By Type (2023-2030)
Table 45 Asia Pacific Payment Orchestration Platform Revenue (USD Million) By Applications (2023-2030)
Table 46 South America Payment Orchestration Platform Revenue (USD Million) By Country (2023-2030)
Table 47 South America Payment Orchestration Platform Revenue (USD Million) By Type (2023-2030)
Table 48 South America Payment Orchestration Platform Revenue (USD Million) By Applications (2023-2030)
Table 49 Middle East and Africa Payment Orchestration Platform Revenue (USD Million) By Region (2023-2030)
Table 50 Middle East and Africa Payment Orchestration Platform Revenue (USD Million) By Region (2023-2030)
Table 51 Middle East and Africa Payment Orchestration Platform Revenue (USD Million) By Type (2023-2030)
Table 52 Middle East and Africa Payment Orchestration Platform Revenue (USD Million) By Applications (2023-2030)
Table 53 Research Programs/Design for This Report
Table 54 Key Data Information from Secondary Sources
Table 55 Key Data Information from Primary Sources
List of Figures
Figure 1 Market Scope
Figure 2 Porter’s Five Forces
Figure 3 Global Payment Orchestration Platform Revenue (USD Million) By Type (2018-2022)
Figure 4 Global Payment Orchestration Platform Revenue Market Share (%) By Type (2022)
Figure 5 Global Payment Orchestration Platform Revenue (USD Million) By Applications (2018-2022)
Figure 6 Global Payment Orchestration Platform Revenue Market Share (%) By Applications (2022)
Figure 7 Global Payment Orchestration Platform Market Revenue (USD Million) By Regions (2018-2022)
Figure 8 Global Payment Orchestration Platform Market Share (%) By Regions (2022)
Figure 9 North America Payment Orchestration Platform Revenue (USD Million) By Country (2018-2022)
Figure 10 North America Payment Orchestration Platform Revenue (USD Million) By Type (2018-2022)
Figure 11 North America Payment Orchestration Platform Revenue (USD Million) By Applications (2018-2022)
Figure 12 Europe Payment Orchestration Platform Revenue (USD Million) By Country (2018-2022)
Figure 13 Europe Payment Orchestration Platform Revenue (USD Million) By Type (2018-2022)
Figure 14 Europe Payment Orchestration Platform Revenue (USD Million) By Applications (2018-2022)
Figure 15 Asia Pacific Payment Orchestration Platform Revenue (USD Million) By Country (2018-2022)
Figure 16 Asia Pacific Payment Orchestration Platform Revenue (USD Million) By Type (2018-2022)
Figure 17 Asia Pacific Payment Orchestration Platform Revenue (USD Million) By Applications (2018-2022)
Figure 18 South America Payment Orchestration Platform Revenue (USD Million) By Country (2018-2022)
Figure 19 South America Payment Orchestration Platform Revenue (USD Million) By Type (2018-2022)
Figure 20 South America Payment Orchestration Platform Revenue (USD Million) By Applications (2018-2022)
Figure 21 Middle East and Africa Payment Orchestration Platform Revenue (USD Million) By Region (2018-2022)
Figure 22 Middle East and Africa Payment Orchestration Platform Revenue (USD Million) By Type (2018-2022)
Figure 23 Middle East and Africa Payment Orchestration Platform Revenue (USD Million) By Applications (2018-2022)
Figure 24 Global Payment Orchestration Platform Revenue (USD Million) By Type (2023-2030)
Figure 25 Global Payment Orchestration Platform Revenue Market Share (%) By Type (2030)
Figure 26 Global Payment Orchestration Platform Revenue (USD Million) By Applications (2023-2030)
Figure 27 Global Payment Orchestration Platform Revenue Market Share (%) By Applications (2030)
Figure 28 Global Payment Orchestration Platform Market Revenue (USD Million) By Regions (2023-2030)
Figure 29 North America Payment Orchestration Platform Revenue (USD Million) By Country (2023-2030)
Figure 30 North America Payment Orchestration Platform Revenue (USD Million) By Type (2023-2030)
Figure 31 North America Payment Orchestration Platform Revenue (USD Million) By Applications (2023-2030)
Figure 32 Europe Payment Orchestration Platform Revenue (USD Million) By Country (2023-2030)
Figure 33 Europe Payment Orchestration Platform Revenue (USD Million) By Type (2023-2030)
Figure 34 Europe Payment Orchestration Platform Revenue (USD Million) By Applications (2023-2030)
Figure 35 Asia Pacific Payment Orchestration Platform Revenue (USD Million) By Country (2023-2030)
Figure 36 Asia Pacific Payment Orchestration Platform Revenue (USD Million) By Type (2023-2030)
Figure 37 Asia Pacific Payment Orchestration Platform Revenue (USD Million) By Applications (2023-2030)
Figure 38 South America Payment Orchestration Platform Revenue (USD Million) By Country (2023-2030)
Figure 39 South America Payment Orchestration Platform Revenue (USD Million) By Type (2023-2030)
Figure 40 South America Payment Orchestration Platform Revenue (USD Million) By Applications (2023-2030)
Figure 41 Middle East and Africa Payment Orchestration Platform Revenue (USD Million) By Region (2023-2030)
Figure 42 Middle East and Africa Payment Orchestration Platform Revenue (USD Million) By Region (2023-2030)
Figure 43 Middle East and Africa Payment Orchestration Platform Revenue (USD Million) By Type (2023-2030)
Figure 44 Middle East and Africa Payment Orchestration Platform Revenue (USD Million) By Applications (2023-2030)
Figure 45 Bottom-Up and Top-Down Approaches for This Report
Figure 46 Data Triangulation
