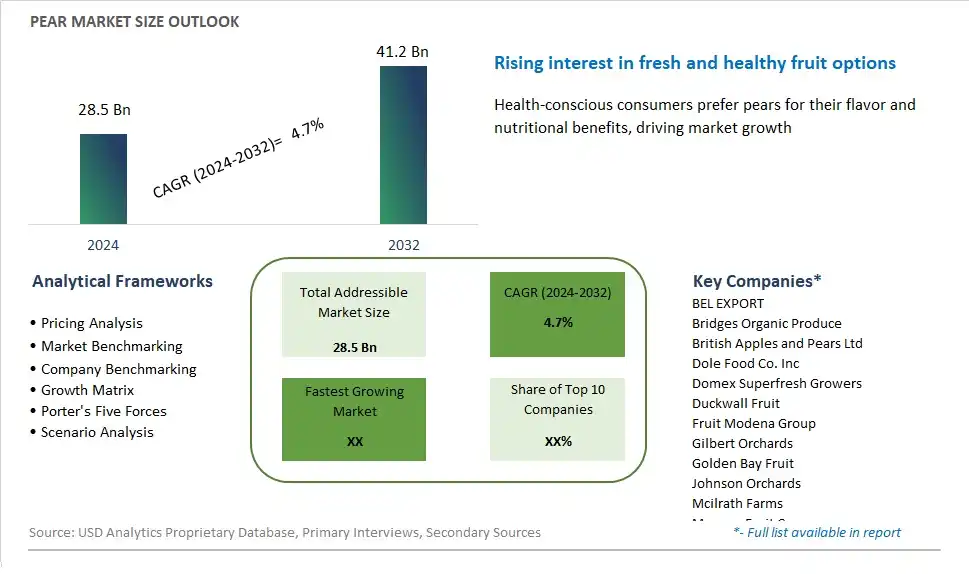
Global Pear Market Size is valued at $28.5 Billion in 2024 and is forecast to register a growth rate (CAGR) of 4.7% to reach $41.2 Billion by 2032.
The global Pear Market Comprehensive Study analyzes and forecasts the market size across 6 regions and 24 countries for diverse segments -By Product (Asian pears, European pears), By Distribution Channel (Offline, Online)
An Introduction to Pear Market
In 2024, the pear market continues to thrive as consumers embrace the diverse flavors and nutritional benefits offered by this versatile fruit. Pears are celebrated for their sweet, juicy flesh and distinctively crisp texture, making them a popular choice for snacking, baking, and cooking. With a wide range of varieties available, from Anjou and Bartlett to Bosc and Asian pears, consumers have ample options to suit their taste preferences and culinary needs. Additionally, the pear's rich fiber content, vitamins, and antioxidants contribute to its reputation as a nutritious addition to a balanced diet, further driving demand for this beloved fruit.
Pear Competitive Landscape
The market report analyses the leading companies in the industry including BEL EXPORT, Bridges Organic Produce, British Apples and Pears Ltd, Dole Food Co. Inc, Domex Superfresh Growers, Duckwall Fruit, Fruit Modena Group, Gilbert Orchards, Golden Bay Fruit, Johnson Orchards, Mcilrath Farms, Monson Fruit Co., Orchard Fruit Co., Rainier Fruit Co., Sage Fruit Co., Sloop Orchards, Stemilt Growers LLC, Underwood Fruit and Warehouse Co., Washington Fruit Growers , West Valley U Pick, and Others.
Pear Market Dynamics
Pear Market Trend: Growing Demand for Locally Sourced and Organic Produce
A significant trend in the pear market is the growing demand for locally sourced and organic produce. As consumers become more conscious of the environmental and health impacts of their food choices, there is a rising interest in purchasing pears that are grown locally and produced using organic farming practices. Locally sourced pears are perceived to be fresher, tastier, and more sustainable due to reduced transportation distances, while organic pears appeal to consumers seeking pesticide-free and environmentally friendly options. This trend is driven by the desire for transparency in food sourcing, support for local farmers, and the increasing preference for organic products among health-conscious consumers.
Market Driver: Health Benefits and Nutritional Value
A key driver propelling the pear market is the recognition of its health benefits and nutritional value. Pears are packed with essential nutrients such as dietary fiber, vitamin C, potassium, and antioxidants, making them a nutritious addition to a balanced diet. With more consumers prioritizing health and wellness, pears are increasingly valued for their potential to support digestive health, boost immunity, and reduce the risk of chronic diseases such as heart disease and diabetes. This driver is fueled by the growing emphasis on preventive healthcare, the popularity of plant-based diets, and the desire for natural and wholesome foods that contribute to overall well-being.
Market Opportunity: Innovation in Packaging and Product Varieties
An opportunity for market expansion in the pear segment lies in innovation in packaging and product varieties. While fresh pears are widely consumed, there is potential to develop and market value-added pear products that offer convenience, freshness, and versatility to consumers. Manufacturers can explore options such as pre-packaged pear slices, individually wrapped pears for on-the-go snacking, pear-infused beverages, dried pear snacks, or pear-based sauces and preserves to cater to different consumer preferences and usage occasions. Additionally, there is room for innovation in packaging formats, such as resealable pouches, portion-controlled packs, or eco-friendly packaging materials, to enhance shelf life, reduce food waste, and improve the overall consumer experience. By tapping into opportunities for innovation in packaging and product varieties, companies can differentiate their offerings, attract new consumer segments, and drive growth in the pear market.
Pear Market Share Analysis: European Pears held the dominant market share in 2024
In the Pear Market segmented by product, European pears emerge as the largest segment. This dominance can be attributed to several factors. Firstly, European pears, such as Bartlett, Anjou, and Bosc varieties, have long been popular among consumers worldwide for their sweet flavor, tender texture, and versatility in culinary applications. These pears are commonly enjoyed fresh, used in cooking, baking, or preserved through canning and drying processes. Additionally, European pears are known for their distinctive shape, often characterized by a rounded bottom and elongated neck, which contributes to their aesthetic appeal and recognition in the market. Further, European pears are widely cultivated in various regions with favorable growing conditions, ensuring consistent availability and supply throughout the year. As consumers continue to seek high-quality, flavorful fruits for consumption and culinary purposes, the demand for European pears remains strong, solidifying their position as the largest segment in the Pear Market.
Pear Market Share Analysis: Online market is poised to register the fastest growth rae over the forecast period to 2032
Among the segmented distribution channels in the Pear Market, Online is the fastest-growing segment. This growth is propelled by several factors. Firstly, the increasing prevalence of e-commerce platforms provides consumers with convenient access to a wide variety of pear varieties from the comfort of their homes. Online retailers offer a seamless shopping experience, with features such as user-friendly interfaces, personalized recommendations, and doorstep delivery services, catering to the evolving needs and preferences of consumers. Additionally, the COVID-19 pandemic has accelerated the shift towards online shopping as consumers prioritize safety and social distancing measures. Furthermore, online sales channels often provide a broader selection of pear varieties, including specialty or rare cultivars, attracting consumers seeking variety and convenience. As a result, the Online segment experiences rapid growth in the Pear Market, capturing a larger share of consumer spending on fresh produce. With the continued digitalization of retail and the convenience-driven shopping behavior of consumers, the Online segment is expected to maintain its momentum and emerge as a dominant distribution channel for pears.
Pear Market Segmentation
By Product
Asian pears
European pears
By Distribution Channel
Offline
Online
Countries Analyzed
North America (US, Canada, Mexico)
Europe (Germany, UK, France, Spain, Italy, Russia, Rest of Europe)
Asia Pacific (China, India, Japan, South Korea, Australia, South East Asia, Rest of Asia)
South America (Brazil, Argentina, Rest of South America)
Middle East and Africa (Saudi Arabia, UAE, Rest of Middle East, South Africa, Egypt, Rest of Africa)
Pear Companies Profiled in the Study
BEL EXPORT
Bridges Organic Produce
British Apples and Pears Ltd
Dole Food Co. Inc
Domex Superfresh Growers
Duckwall Fruit
Fruit Modena Group
Gilbert Orchards
Golden Bay Fruit
Johnson Orchards
Mcilrath Farms
Monson Fruit Co.
Orchard Fruit Co.
Rainier Fruit Co.
Sage Fruit Co.
Sloop Orchards
Stemilt Growers LLC
Underwood Fruit and Warehouse Co.
Washington Fruit Growers
West Valley U Pick
*- List Not Exhaustive
Chapter 1. TABLE OF CONTENTS
Chapter 2. Introduction to Pear Market
2.1. Market Overview
2.2. Key Statistics and Report Highlights
2.3. Scope of the Comprehensive Study
2.3.1. Market Definition
2.3.2 Countries and Regions Covered
2.3.3 Research Objective
2.3.4 Units, Currency, and Conversions
2.3.5 Industry Value Chain
2.4. Key Market Segments
2.5. Key Companies
2.6. Study Period
Chapter 3. Strategic Analysis Review
3.1. Pear Pricing Analysis and Forecast
3.2. Porter’s Five Forces
3.3. Market Ecosystem
3.4. SWOT Analysis
3.5. Regulatory Scenario
3.3. Effects of Inflation, Russia-Ukraine War, moderating economic growth, and other macroeconomic factors
Chapter 4. Competitive Landscape
4.1. Market Share Analysis
4.1.1. Global Pear Market Share by Company, 2023
4.1.2. Product Offerings of Leading Pear Companies
4.2. Market Entropy
4.2.1. New Product Launches in the Industry
4.2.2. Mergers, Acquisitions, Joint ventures, and Partnerships
4.3. Key Strategies and Best Practices
Chapter 5. Global Market Projections: Best, Reference, and Low Case Scenarios
5.1. Growth Analysis- Case Scenario Definitions
5.2. Low Growth Case Scenario Forecasts
5.3. Reference Growth Case Scenario Forecasts
5.4. High Growth Case Scenario Forecasts
Chapter 6. Market Dynamics
6.1. Pear Market Drivers
6.2. Pear Market Challenges
6.6. Pear Market Opportunities
6.4. Pear Market Trends
Chapter 7. Global Pear Market Outlook Trends
7.1. Global Pear Revenue (USD Million) and CAGR (%) by Type (2021-2032)
7.2. Global Pear Revenue (USD Million) and CAGR (%) by Application (2021-2032)
7.3. Global Pear Revenue (USD Million) and CAGR (%) by Product (2021-2032)
By Product
Asian pears
European pears
By Distribution Channel
Offline
Online
Chapter 8. Global Pear Regional Analysis and Outlook
8.1. Global Pear Revenue (USD Million) By Regions (2021- 2032)
8.2. North America Pear Revenue (USD Million) by Country (2021-2032)
8.2.1. United States Pear Regional Analysis and Outlook
8.2.2. Canada Pear Regional Analysis and Outlook
8.2.3. Mexico Pear Regional Analysis and Outlook
8.3. Europe Pear Revenue (USD Million), by Country (2021-2032)
8.3.1. Germany Pear Regional Analysis and Outlook
8.3.2. France Pear Regional Analysis and Outlook
8.3.3. United Kingdom Pear Regional Analysis and Outlook
8.3.4. Spain Pear Regional Analysis and Outlook
8.3.5. Italy Pear Regional Analysis and Outlook
8.3.6. Russia Pear Regional Analysis and Outlook
8.3.7. Rest of Europe Pear Regional Analysis and Outlook
8.4. Asia Pacific Pear Revenue (USD Million) by Country (2021-2032)
8.4.1. China Pear Regional Analysis and Outlook
8.4.2. Japan Pear Regional Analysis and Outlook
8.4.3. India Pear Regional Analysis and Outlook
8.4.4. South Korea Pear Regional Analysis and Outlook
8.4.5. Australia Pear Regional Analysis and Outlook
8.4.6. South East Asia Pear Regional Analysis and Outlook
8.4.7. Rest of Asia Pacific Pear Regional Analysis and Outlook
8.5. South America Pear Revenue (USD Million), by Country (2021-2032)
8.5.1. Brazil Pear Regional Analysis and Outlook
8.5.2. Argentina Pear Regional Analysis and Outlook
8.5.3. Rest of South America Pear Regional Analysis and Outlook
8.6. Middle East and Africa Pear Revenue (USD Million) by Country (2021-2032)
8.6.1. Middle East Pear Regional Analysis and Outlook
8.6.2. Africa Pear Regional Analysis and Outlook
Chapter 9. North America Pear Analysis and Outlook
9.1. North America Pear Revenue (USD Million) by Segments (2021-2032)
9.1.1. North America Pear Revenue (USD Million) by Type (2021-2032)
9.1.2. North America Pear Revenue (USD Million) by Application (2021-2032)
9.1.3. North America Pear Revenue (USD Million) by Product (2021-2032)
By Product
Asian pears
European pears
By Distribution Channel
Offline
Online
Chapter 10. Europe Pear Analysis and Outlook
10.1. Europe Pear Revenue (USD Million), by Segments (USD Million) (2021-2032)
10.1.1. Europe Pear Revenue (USD Million) by Type (2021-2032)
10.1.2. Europe Pear Revenue (USD Million) by Application (2021-2032)
10.1.3. Europe Pear Revenue (USD Million) by Product (2021-2032)
By Product
Asian pears
European pears
By Distribution Channel
Offline
Online
Chapter 11. Asia Pacific Pear Analysis and Outlook
11.1. Asia Pacific Pear Revenue (USD Million), and Revenue (USD Million) by Segments (2021-2032)
11.1.1. Asia Pacific Pear Revenue (USD Million) by Type (2021-2032)
11.1.2. Asia Pacific Pear Revenue (USD Million) by Application (2021-2032)
11.1.3. Asia Pacific Pear Revenue (USD Million) by Product (2021-2032)
By Product
Asian pears
European pears
By Distribution Channel
Offline
Online
Chapter 12. South America Pear Analysis and Outlook
12.1. South America Pear Revenue (USD Million), by Segments (2021-2032)
12.1.1. South America Pear Revenue (USD Million) by Type (2021-2032)
12.1.2. South America Pear Revenue (USD Million) by Application (2021-2032)
12.1.3. South America Pear Revenue (USD Million) by Product (2021-2032)
By Product
Asian pears
European pears
By Distribution Channel
Offline
Online
Chapter 13. Middle East and Africa Pear Analysis and Outlook
13.1. Middle East and Africa Pear Revenue (USD Million), by Segments (2021-2032)
13.1.1. Middle East and Africa Pear Revenue (USD Million) by Type (2021-2032)
13.1.2. Middle East and Africa Pear Revenue (USD Million) by Application (2021-2032)
13.1.3. Middle East and Africa Pear Revenue (USD Million) by Product (2021-2032)
By Product
Asian pears
European pears
By Distribution Channel
Offline
Online
Chapter 14. Pear Company Profiles
14.1 Business Overview
14.2 Product Profiles
14.3 SWOT Profiles
14.5 Recent Developments
14.6 Financial Profile
List of Companies
BEL EXPORT
Bridges Organic Produce
British Apples and Pears Ltd
Dole Food Co. Inc
Domex Superfresh Growers
Duckwall Fruit
Fruit Modena Group
Gilbert Orchards
Golden Bay Fruit
Johnson Orchards
Mcilrath Farms
Monson Fruit Co.
Orchard Fruit Co.
Rainier Fruit Co.
Sage Fruit Co.
Sloop Orchards
Stemilt Growers LLC
Underwood Fruit and Warehouse Co.
Washington Fruit Growers
West Valley U Pick
15. Methodology and Data Sources
15.1 Customization Offerings
15.2 Subscription Services
15.3 Related Reports
15.4 Publisher Expertise
LIST OF TABLES
Table 1 Market Segmentation Analysis
Table 2 Global Pear Market Share of Leading Companies, 2023
Table 3 Product Offerings of Leading Companies
Table 4 Low Growth Scenario Forecasts
Table 5 Reference Case Growth Scenario
Table 6 High Growth Case Scenario
Table 7 Global Pear Revenue (USD Million) And CAGR (%) By Type (2021-2032)
Table 8 Global Pear Revenue (USD Million) And CAGR (%) By Application (2021-2032)
Table 9 Global Pear Revenue (USD Million) And CAGR (%) By Product (2021-2032)
Table 10 Global Pear Market Revenue (USD Million) By Regions (2021-2032)
Table 11 Global Pear Market Share (%) By Regions (2021-2032)
Table 12 North America Pear Revenue (USD Million) By Country (2021-2032)
Table 13 Europe Pear Revenue (USD Million) By Country (2021-2032)
Table 14 Asia Pacific Pear Revenue (USD Million) By Country (2021-2032)
Table 15 South America Pear Revenue (USD Million) By Country (2021-2032)
Table 16 Middle East and Africa Pear Revenue (USD Million) By Region (2021-2032)
Table 17 North America Pear Revenue (USD Million) By Type (2021-2032)
Table 18 North America Pear Revenue (USD Million) By Application (2021-2032)
Table 19 North America Pear Revenue (USD Million) By Product (2021-2032)
Table 20 Europe Pear Revenue (USD Million) By Type (2021-2032)
Table 21 Europe Pear Revenue (USD Million) By Application (2021-2032)
Table 22 Europe Pear Revenue (USD Million) By Product (2021-2032)
Table 23 Asia Pacific Pear Revenue (USD Million) By Type (2021-2032)
Table 24 Asia Pacific Pear Revenue (USD Million) By Application (2021-2032)
Table 25 Asia Pacific Pear Revenue (USD Million) By Product (2021-2032)
Table 26 South America Pear Revenue (USD Million) By Type (2021-2032)
Table 27 South America Pear Revenue (USD Million) By Application (2021-2032)
Table 28 South America Pear Revenue (USD Million) By Product (2021-2032)
Table 29 Middle East and Africa Pear Revenue (USD Million) By Type (2021-2032)
Table 30 Middle East and Africa Pear Revenue (USD Million) By Application (2021-2032)
Table 31 Middle East and Africa Pear Revenue (USD Million) By Product (2021-2032)
LIST OF FIGURES
Figure 1. Market Scope
Figure 2. Pricing Forecasts Per Unit, 2023- 2032
Figure 3. Porter’s Five Forces
Figure 4. Global Pear Market Revenue (USD Million) By Regions (2021-2032)
Figure 5. Global Pear Market Share (%) By Regions (2023)
Figure 6. North America Pear Revenue (USD Million) By Country (2021-2032)
Figure 7. United States Pear Revenue (USD Million) By Country (2021-2032)
Figure 8. Canada Pear Revenue (USD Million) By Country (2021-2032)
Figure 9. Mexico Pear Revenue (USD Million) By Country (2021-2032)
Figure 10. Europe Pear Revenue (USD Million) By Country (2021-2032)
Figure 11. Germany Pear Revenue (USD Million) By Country (2021-2032)
Figure 12. France Pear Revenue (USD Million) By Country (2021-2032)
Figure 13. United Kingdom Pear Revenue (USD Million) By Country (2021-2032)
Figure 14. Spain Pear Revenue (USD Million) By Country (2021-2032)
Figure 15. Italy Pear Revenue (USD Million) By Country (2021-2032)
Figure 16. Russia Pear Revenue (USD Million) By Country (2021-2032)
Figure 17. Rest of Europe Pear Revenue (USD Million) By Country (2021-2032)
Figure 11. Asia Pacific Pear Revenue (USD Million) By Country (2021-2032)
Figure 12. China Pear Revenue (USD Million) By Country (2021-2032)
Figure 13. Japan Pear Revenue (USD Million) By Country (2021-2032)
Figure 14. India Pear Revenue (USD Million) By Country (2021-2032)
Figure 15. South Korea Pear Revenue (USD Million) By Country (2021-2032)
Figure 16. Australia Pear Revenue (USD Million) By Country (2021-2032)
Figure 17. South East Asia Pear Revenue (USD Million) By Country (2021-2032)
Figure 18. South America Pear Revenue (USD Million) By Country (2021-2032)
Figure 19. Brazil Pear Revenue (USD Million) By Country (2021-2032)
Figure 20. Argentina Pear Revenue (USD Million) By Country (2021-2032)
Figure 21. Rest of Asia Pacific Pear Revenue (USD Million) By Country (2021-2032)
Figure 22. Middle East and Africa Pear Revenue (USD Million) By Region (2021-2032)
Figure 23. Saudi Arabia Pear Revenue (USD Million) By Region (2021-2032)
Figure 24. The UAE Pear Revenue (USD Million) By Region (2021-2032)
Figure 25. Rest of Middle East Pear Revenue (USD Million) By Region (2021-2032)
Figure 26. South Africa Pear Revenue (USD Million) By Region (2021-2032)
Figure 27. Africa Pear Revenue (USD Million) By Region (2021-2032)
Figure 28. North America Pear Revenue (USD Million) By Type (2021-2032)
Figure 29. North America Pear Revenue (USD Million) By Application (2021-2032)
Figure 30. North America Pear Revenue (USD Million) By Product (2021-2032)
Figure 31. Europe Pear Revenue (USD Million) By Type (2021-2032)
Figure 32. Europe Pear Revenue (USD Million) By Application (2021-2032)
Figure 33. Europe Pear Revenue (USD Million) By Product (2021-2032)
Figure 34. Asia Pacific Pear Revenue (USD Million) By Type (2021-2032)
Figure 35. Asia Pacific Pear Revenue (USD Million) By Application (2021-2032)
Figure 36. Asia Pacific Pear Revenue (USD Million) By Product (2021-2032)
Figure 37. South America Pear Revenue (USD Million) By Type (2021-2032)
Figure 38. South America Pear Revenue (USD Million) By Application (2021-2032)
Figure 39. South America Pear Revenue (USD Million) By Product (2021-2032)
Figure 40. Middle East and Africa Pear Revenue (USD Million) By Type (2021-2032)
Figure 41. Middle East and Africa Pear Revenue (USD Million) By Application (2021-2032)
Figure 42. Middle East and Africa Pear Revenue (USD Million) By Product (2021-2032)
By Product
Asian pears
European pears
By Distribution Channel
Offline
Online
Countries Analyzed
North America (US, Canada, Mexico)
Europe (Germany, UK, France, Spain, Italy, Russia, Rest of Europe)
Asia Pacific (China, India, Japan, South Korea, Australia, South East Asia, Rest of Asia)
South America (Brazil, Argentina, Rest of South America)
Middle East and Africa (Saudi Arabia, UAE, Rest of Middle East, South Africa, Egypt, Rest of Africa)
