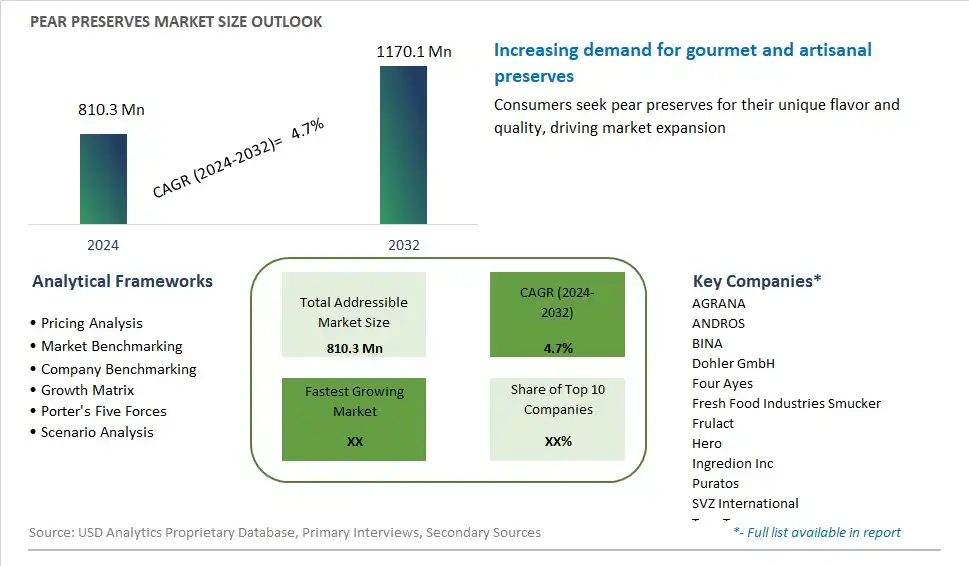
Global Pear Preserves Market Size is valued at $810.3 Million in 2024 and is forecast to register a growth rate (CAGR) of 4.7% to reach $1170.1 Million by 2032.
The global Pear Preserves Market Comprehensive Study analyzes and forecasts the market size across 6 regions and 24 countries for diverse segments -By Product (Jam, Filling, Others), By Application (Dairy, Baked Product, Ice-Cream, Others)
An Introduction to Pear Preserves Market
In 2024, pear preserves continue to enchant palates with their sweet, tangy flavor and delightful versatility in culinary applications. Made from fresh, ripe pears simmered with sugar and often infused with spices or citrus, pear preserves offer a taste of nostalgia and comfort reminiscent of homemade jams and jellies. Beyond their culinary appeal, pear preserves boast nutritional benefits, including vitamins, minerals, and dietary fiber, making them a wholesome addition to breakfast spreads, pastries, and desserts. In the artisanal food market, pear preserves stand out for their artisan craftsmanship and artisanal flavors, showcasing the natural bounty of orchards and the artistry of preserving techniques. As consumers seek natural, minimally processed foods with authentic flavors and wholesome ingredients, the market for pear preserves is poised for sustained growth, offering a taste of tradition and artisanal quality in every jar.
Pear Preserves Competitive Landscape
The market report analyses the leading companies in the industry including AGRANA, ANDROS, BINA, Dohler GmbH, Four Ayes, Fresh Food Industries Smucker, Frulact, Hero, Ingredion Inc, Puratos, SVZ International, Tree Top, Valio, ZENTIS, ZUEGG, and Others.
Pear Preserves Market Dynamics
Pear Preserves Market Trend: Growing Demand for Artisanal and Locally-Sourced Products
The market for Pear Preserves is experiencing a prominent trend driven by the growing consumer preference for artisanal and locally-sourced food products. As consumers seek out unique and authentic culinary experiences, there is an increasing interest in preserves made with high-quality, locally-grown ingredients, including pears. Artisanal pear preserves offer a homemade taste and premium quality that appeals to discerning consumers looking for natural, flavorful spreads to enjoy with bread, cheese, or as a topping for desserts. This trend is fueled by a desire to support small-scale producers, promote sustainability, and reconnect with traditional food preservation methods, driving the demand for pear preserves in specialty food stores, farmers' markets, and gourmet food shops.
Market Driver: Growing Interest in Sustainable Agriculture and Food Preservation
The market for Pear Preserves is primarily driven by the growing interest in sustainable agriculture and food preservation practices. Pears are a seasonal fruit with a short shelf life, making preserves an ideal way to extend their availability and enjoy their flavor year-round. Consumers are increasingly concerned about food waste and the environmental impact of industrial food production, leading to a preference for homemade or small-batch preserves made with locally-sourced ingredients. Additionally, the resurgence of interest in canning, pickling, and preserving techniques reflects a broader cultural shift towards self-sufficiency, DIY food projects, and a desire to reduce reliance on processed foods. This driver is reinforced by the demand for natural, additive-free preserves made with simple, wholesome ingredients, driving the growth of the pear preserves market among environmentally conscious consumers.
Market Opportunity: Expansion into Specialty and Gift Markets
The market for Pear Preserves presents a significant opportunity for companies to expand into specialty and gift markets to capitalize on the growing demand for premium preserves and gourmet food products. Companies can innovate by developing unique flavor combinations, such as pear and vanilla bean, pear and ginger, or pear and wine, to create distinctive preserves that appeal to discerning palates and culinary enthusiasts. Additionally, there are opportunities to package pear preserves in elegant jars or gift sets and position them as upscale, artisanal gifts for holidays, special occasions, or corporate events. By tapping into the gift market and offering premium packaging and presentation, companies can elevate the perceived value of pear preserves and attract customers seeking high-quality, indulgent treats for themselves or as thoughtful gifts for friends and family.
Pear Preserves Market Share Analysis: Jam held the dominant market share in 2024
The "Jam" segment is the largest within the Pear Preserves Market, driven by its widespread popularity, versatility, and enduring appeal among consumers. Jam, with its smooth texture and rich flavor, represents a classic choice for preserving pears and enjoying their natural sweetness year-round. Its versatility extends beyond traditional breakfast spreads, as it can also be used as a topping for desserts, filling for pastries, and accompaniment to savory dishes. Further, jam's long shelf life and convenient packaging make it a convenient pantry staple for households worldwide. Additionally, the enduring tradition of homemade jams, along with the availability of a wide range of commercial options in supermarkets and specialty stores, further solidifies the dominance of the jam segment in the Pear Preserves Market. As consumer preferences for nostalgic flavors and artisanal products persist, the jam segment is expected to maintain its leading position, driving growth in the Pear Preserves Market.
Pear Preserves Market Share Analysis: Baked Product market is poised to register the fastest growth rae over the forecast period to 2032
The fastest growing segment in the pear preserves market is the baked product application. This growth can be attributed to the increasing demand for natural and healthy ingredients in bakery items, as consumers become more health-conscious and seek alternatives to artificial additives. Pear preserves add a unique flavor profile and moisture to baked goods, making them a preferred choice among bakers and consumers alike. Additionally, the rise of artisanal and gourmet bakery products has further fueled the demand for high-quality fruit preserves, including pear preserves. This segment's rapid expansion is also supported by the versatility of pear preserves in various baked goods such as pastries, cakes, and bread, which enhances their appeal across different consumer segments. The trend towards premiumization in the food industry and the growing popularity of homemade and small-batch baking have significantly contributed to the robust growth of pear preserves in the baked product application.
Pear Preserves Market Segmentation
By Product
Jam
Filling
Others
By Application
Dairy
Baked Product
Ice-Cream
Others
Countries Analyzed
North America (US, Canada, Mexico)
Europe (Germany, UK, France, Spain, Italy, Russia, Rest of Europe)
Asia Pacific (China, India, Japan, South Korea, Australia, South East Asia, Rest of Asia)
South America (Brazil, Argentina, Rest of South America)
Middle East and Africa (Saudi Arabia, UAE, Rest of Middle East, South Africa, Egypt, Rest of Africa)
Pear Preserves Companies Profiled in the Study
AGRANA
ANDROS
BINA
Dohler GmbH
Four Ayes
Fresh Food Industries Smucker
Frulact
Hero
Ingredion Inc
Puratos
SVZ International
Tree Top
Valio
ZENTIS
ZUEGG
*- List Not Exhaustive
Chapter 1. TABLE OF CONTENTS
Chapter 2. Introduction to Pear Preserves Market
2.1. Market Overview
2.2. Key Statistics and Report Highlights
2.3. Scope of the Comprehensive Study
2.3.1. Market Definition
2.3.2 Countries and Regions Covered
2.3.3 Research Objective
2.3.4 Units, Currency, and Conversions
2.3.5 Industry Value Chain
2.4. Key Market Segments
2.5. Key Companies
2.6. Study Period
Chapter 3. Strategic Analysis Review
3.1. Pear Preserves Pricing Analysis and Forecast
3.2. Porter’s Five Forces
3.3. Market Ecosystem
3.4. SWOT Analysis
3.5. Regulatory Scenario
3.3. Effects of Inflation, Russia-Ukraine War, moderating economic growth, and other macroeconomic factors
Chapter 4. Competitive Landscape
4.1. Market Share Analysis
4.1.1. Global Pear Preserves Market Share by Company, 2023
4.1.2. Product Offerings of Leading Pear Preserves Companies
4.2. Market Entropy
4.2.1. New Product Launches in the Industry
4.2.2. Mergers, Acquisitions, Joint ventures, and Partnerships
4.3. Key Strategies and Best Practices
Chapter 5. Global Market Projections: Best, Reference, and Low Case Scenarios
5.1. Growth Analysis- Case Scenario Definitions
5.2. Low Growth Case Scenario Forecasts
5.3. Reference Growth Case Scenario Forecasts
5.4. High Growth Case Scenario Forecasts
Chapter 6. Market Dynamics
6.1. Pear Preserves Market Drivers
6.2. Pear Preserves Market Challenges
6.6. Pear Preserves Market Opportunities
6.4. Pear Preserves Market Trends
Chapter 7. Global Pear Preserves Market Outlook Trends
7.1. Global Pear Preserves Revenue (USD Million) and CAGR (%) by Type (2021-2032)
7.2. Global Pear Preserves Revenue (USD Million) and CAGR (%) by Application (2021-2032)
7.3. Global Pear Preserves Revenue (USD Million) and CAGR (%) by Product (2021-2032)
By Product
Jam
Filling
Others
By Application
Dairy
Baked Product
Ice-Cream
Others
Chapter 8. Global Pear Preserves Regional Analysis and Outlook
8.1. Global Pear Preserves Revenue (USD Million) By Regions (2021- 2032)
8.2. North America Pear Preserves Revenue (USD Million) by Country (2021-2032)
8.2.1. United States Pear Preserves Regional Analysis and Outlook
8.2.2. Canada Pear Preserves Regional Analysis and Outlook
8.2.3. Mexico Pear Preserves Regional Analysis and Outlook
8.3. Europe Pear Preserves Revenue (USD Million), by Country (2021-2032)
8.3.1. Germany Pear Preserves Regional Analysis and Outlook
8.3.2. France Pear Preserves Regional Analysis and Outlook
8.3.3. United Kingdom Pear Preserves Regional Analysis and Outlook
8.3.4. Spain Pear Preserves Regional Analysis and Outlook
8.3.5. Italy Pear Preserves Regional Analysis and Outlook
8.3.6. Russia Pear Preserves Regional Analysis and Outlook
8.3.7. Rest of Europe Pear Preserves Regional Analysis and Outlook
8.4. Asia Pacific Pear Preserves Revenue (USD Million) by Country (2021-2032)
8.4.1. China Pear Preserves Regional Analysis and Outlook
8.4.2. Japan Pear Preserves Regional Analysis and Outlook
8.4.3. India Pear Preserves Regional Analysis and Outlook
8.4.4. South Korea Pear Preserves Regional Analysis and Outlook
8.4.5. Australia Pear Preserves Regional Analysis and Outlook
8.4.6. South East Asia Pear Preserves Regional Analysis and Outlook
8.4.7. Rest of Asia Pacific Pear Preserves Regional Analysis and Outlook
8.5. South America Pear Preserves Revenue (USD Million), by Country (2021-2032)
8.5.1. Brazil Pear Preserves Regional Analysis and Outlook
8.5.2. Argentina Pear Preserves Regional Analysis and Outlook
8.5.3. Rest of South America Pear Preserves Regional Analysis and Outlook
8.6. Middle East and Africa Pear Preserves Revenue (USD Million) by Country (2021-2032)
8.6.1. Middle East Pear Preserves Regional Analysis and Outlook
8.6.2. Africa Pear Preserves Regional Analysis and Outlook
Chapter 9. North America Pear Preserves Analysis and Outlook
9.1. North America Pear Preserves Revenue (USD Million) by Segments (2021-2032)
9.1.1. North America Pear Preserves Revenue (USD Million) by Type (2021-2032)
9.1.2. North America Pear Preserves Revenue (USD Million) by Application (2021-2032)
9.1.3. North America Pear Preserves Revenue (USD Million) by Product (2021-2032)
By Product
Jam
Filling
Others
By Application
Dairy
Baked Product
Ice-Cream
Others
Chapter 10. Europe Pear Preserves Analysis and Outlook
10.1. Europe Pear Preserves Revenue (USD Million), by Segments (USD Million) (2021-2032)
10.1.1. Europe Pear Preserves Revenue (USD Million) by Type (2021-2032)
10.1.2. Europe Pear Preserves Revenue (USD Million) by Application (2021-2032)
10.1.3. Europe Pear Preserves Revenue (USD Million) by Product (2021-2032)
By Product
Jam
Filling
Others
By Application
Dairy
Baked Product
Ice-Cream
Others
Chapter 11. Asia Pacific Pear Preserves Analysis and Outlook
11.1. Asia Pacific Pear Preserves Revenue (USD Million), and Revenue (USD Million) by Segments (2021-2032)
11.1.1. Asia Pacific Pear Preserves Revenue (USD Million) by Type (2021-2032)
11.1.2. Asia Pacific Pear Preserves Revenue (USD Million) by Application (2021-2032)
11.1.3. Asia Pacific Pear Preserves Revenue (USD Million) by Product (2021-2032)
By Product
Jam
Filling
Others
By Application
Dairy
Baked Product
Ice-Cream
Others
Chapter 12. South America Pear Preserves Analysis and Outlook
12.1. South America Pear Preserves Revenue (USD Million), by Segments (2021-2032)
12.1.1. South America Pear Preserves Revenue (USD Million) by Type (2021-2032)
12.1.2. South America Pear Preserves Revenue (USD Million) by Application (2021-2032)
12.1.3. South America Pear Preserves Revenue (USD Million) by Product (2021-2032)
By Product
Jam
Filling
Others
By Application
Dairy
Baked Product
Ice-Cream
Others
Chapter 13. Middle East and Africa Pear Preserves Analysis and Outlook
13.1. Middle East and Africa Pear Preserves Revenue (USD Million), by Segments (2021-2032)
13.1.1. Middle East and Africa Pear Preserves Revenue (USD Million) by Type (2021-2032)
13.1.2. Middle East and Africa Pear Preserves Revenue (USD Million) by Application (2021-2032)
13.1.3. Middle East and Africa Pear Preserves Revenue (USD Million) by Product (2021-2032)
By Product
Jam
Filling
Others
By Application
Dairy
Baked Product
Ice-Cream
Others
Chapter 14. Pear Preserves Company Profiles
14.1 Business Overview
14.2 Product Profiles
14.3 SWOT Profiles
14.5 Recent Developments
14.6 Financial Profile
List of Companies
AGRANA
ANDROS
BINA
Dohler GmbH
Four Ayes
Fresh Food Industries Smucker
Frulact
Hero
Ingredion Inc
Puratos
SVZ International
Tree Top
Valio
ZENTIS
ZUEGG
15. Methodology and Data Sources
15.1 Customization Offerings
15.2 Subscription Services
15.3 Related Reports
15.4 Publisher Expertise
LIST OF TABLES
Table 1 Market Segmentation Analysis
Table 2 Global Pear Preserves Market Share of Leading Companies, 2023
Table 3 Product Offerings of Leading Companies
Table 4 Low Growth Scenario Forecasts
Table 5 Reference Case Growth Scenario
Table 6 High Growth Case Scenario
Table 7 Global Pear Preserves Revenue (USD Million) And CAGR (%) By Type (2021-2032)
Table 8 Global Pear Preserves Revenue (USD Million) And CAGR (%) By Application (2021-2032)
Table 9 Global Pear Preserves Revenue (USD Million) And CAGR (%) By Product (2021-2032)
Table 10 Global Pear Preserves Market Revenue (USD Million) By Regions (2021-2032)
Table 11 Global Pear Preserves Market Share (%) By Regions (2021-2032)
Table 12 North America Pear Preserves Revenue (USD Million) By Country (2021-2032)
Table 13 Europe Pear Preserves Revenue (USD Million) By Country (2021-2032)
Table 14 Asia Pacific Pear Preserves Revenue (USD Million) By Country (2021-2032)
Table 15 South America Pear Preserves Revenue (USD Million) By Country (2021-2032)
Table 16 Middle East and Africa Pear Preserves Revenue (USD Million) By Region (2021-2032)
Table 17 North America Pear Preserves Revenue (USD Million) By Type (2021-2032)
Table 18 North America Pear Preserves Revenue (USD Million) By Application (2021-2032)
Table 19 North America Pear Preserves Revenue (USD Million) By Product (2021-2032)
Table 20 Europe Pear Preserves Revenue (USD Million) By Type (2021-2032)
Table 21 Europe Pear Preserves Revenue (USD Million) By Application (2021-2032)
Table 22 Europe Pear Preserves Revenue (USD Million) By Product (2021-2032)
Table 23 Asia Pacific Pear Preserves Revenue (USD Million) By Type (2021-2032)
Table 24 Asia Pacific Pear Preserves Revenue (USD Million) By Application (2021-2032)
Table 25 Asia Pacific Pear Preserves Revenue (USD Million) By Product (2021-2032)
Table 26 South America Pear Preserves Revenue (USD Million) By Type (2021-2032)
Table 27 South America Pear Preserves Revenue (USD Million) By Application (2021-2032)
Table 28 South America Pear Preserves Revenue (USD Million) By Product (2021-2032)
Table 29 Middle East and Africa Pear Preserves Revenue (USD Million) By Type (2021-2032)
Table 30 Middle East and Africa Pear Preserves Revenue (USD Million) By Application (2021-2032)
Table 31 Middle East and Africa Pear Preserves Revenue (USD Million) By Product (2021-2032)
LIST OF FIGURES
Figure 1. Market Scope
Figure 2. Pricing Forecasts Per Unit, 2023- 2032
Figure 3. Porter’s Five Forces
Figure 4. Global Pear Preserves Market Revenue (USD Million) By Regions (2021-2032)
Figure 5. Global Pear Preserves Market Share (%) By Regions (2023)
Figure 6. North America Pear Preserves Revenue (USD Million) By Country (2021-2032)
Figure 7. United States Pear Preserves Revenue (USD Million) By Country (2021-2032)
Figure 8. Canada Pear Preserves Revenue (USD Million) By Country (2021-2032)
Figure 9. Mexico Pear Preserves Revenue (USD Million) By Country (2021-2032)
Figure 10. Europe Pear Preserves Revenue (USD Million) By Country (2021-2032)
Figure 11. Germany Pear Preserves Revenue (USD Million) By Country (2021-2032)
Figure 12. France Pear Preserves Revenue (USD Million) By Country (2021-2032)
Figure 13. United Kingdom Pear Preserves Revenue (USD Million) By Country (2021-2032)
Figure 14. Spain Pear Preserves Revenue (USD Million) By Country (2021-2032)
Figure 15. Italy Pear Preserves Revenue (USD Million) By Country (2021-2032)
Figure 16. Russia Pear Preserves Revenue (USD Million) By Country (2021-2032)
Figure 17. Rest of Europe Pear Preserves Revenue (USD Million) By Country (2021-2032)
Figure 11. Asia Pacific Pear Preserves Revenue (USD Million) By Country (2021-2032)
Figure 12. China Pear Preserves Revenue (USD Million) By Country (2021-2032)
Figure 13. Japan Pear Preserves Revenue (USD Million) By Country (2021-2032)
Figure 14. India Pear Preserves Revenue (USD Million) By Country (2021-2032)
Figure 15. South Korea Pear Preserves Revenue (USD Million) By Country (2021-2032)
Figure 16. Australia Pear Preserves Revenue (USD Million) By Country (2021-2032)
Figure 17. South East Asia Pear Preserves Revenue (USD Million) By Country (2021-2032)
Figure 18. South America Pear Preserves Revenue (USD Million) By Country (2021-2032)
Figure 19. Brazil Pear Preserves Revenue (USD Million) By Country (2021-2032)
Figure 20. Argentina Pear Preserves Revenue (USD Million) By Country (2021-2032)
Figure 21. Rest of Asia Pacific Pear Preserves Revenue (USD Million) By Country (2021-2032)
Figure 22. Middle East and Africa Pear Preserves Revenue (USD Million) By Region (2021-2032)
Figure 23. Saudi Arabia Pear Preserves Revenue (USD Million) By Region (2021-2032)
Figure 24. The UAE Pear Preserves Revenue (USD Million) By Region (2021-2032)
Figure 25. Rest of Middle East Pear Preserves Revenue (USD Million) By Region (2021-2032)
Figure 26. South Africa Pear Preserves Revenue (USD Million) By Region (2021-2032)
Figure 27. Africa Pear Preserves Revenue (USD Million) By Region (2021-2032)
Figure 28. North America Pear Preserves Revenue (USD Million) By Type (2021-2032)
Figure 29. North America Pear Preserves Revenue (USD Million) By Application (2021-2032)
Figure 30. North America Pear Preserves Revenue (USD Million) By Product (2021-2032)
Figure 31. Europe Pear Preserves Revenue (USD Million) By Type (2021-2032)
Figure 32. Europe Pear Preserves Revenue (USD Million) By Application (2021-2032)
Figure 33. Europe Pear Preserves Revenue (USD Million) By Product (2021-2032)
Figure 34. Asia Pacific Pear Preserves Revenue (USD Million) By Type (2021-2032)
Figure 35. Asia Pacific Pear Preserves Revenue (USD Million) By Application (2021-2032)
Figure 36. Asia Pacific Pear Preserves Revenue (USD Million) By Product (2021-2032)
Figure 37. South America Pear Preserves Revenue (USD Million) By Type (2021-2032)
Figure 38. South America Pear Preserves Revenue (USD Million) By Application (2021-2032)
Figure 39. South America Pear Preserves Revenue (USD Million) By Product (2021-2032)
Figure 40. Middle East and Africa Pear Preserves Revenue (USD Million) By Type (2021-2032)
Figure 41. Middle East and Africa Pear Preserves Revenue (USD Million) By Application (2021-2032)
Figure 42. Middle East and Africa Pear Preserves Revenue (USD Million) By Product (2021-2032)
By Product
Jam
Filling
Others
By Application
Dairy
Baked Product
Ice-Cream
Others
Countries Analyzed
North America (US, Canada, Mexico)
Europe (Germany, UK, France, Spain, Italy, Russia, Rest of Europe)
Asia Pacific (China, India, Japan, South Korea, Australia, South East Asia, Rest of Asia)
South America (Brazil, Argentina, Rest of South America)
Middle East and Africa (Saudi Arabia, UAE, Rest of Middle East, South Africa, Egypt, Rest of Africa)
