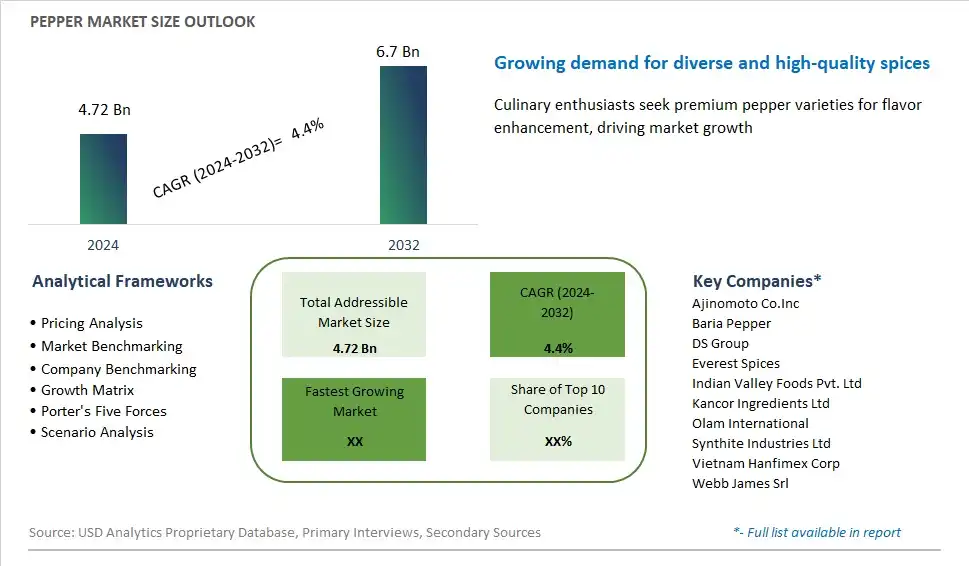
Global Pepper Market Size is valued at $4.72 Billion in 2024 and is forecast to register a growth rate (CAGR) of 4.4% to reach $6.7 Billion by 2032.
The global Pepper Market Comprehensive Study analyzes and forecasts the market size across 6 regions and 24 countries for diverse segments -By Product (Black Pepper, White Pepper, Green Pepper), By Application (Food and Beverages, Personal Care, Pharmaceuticals, Others), By Form (Whole Pepper, Powdered Pepper)
An Introduction to Pepper Market
In 2024, pepper remains a cornerstone of global cuisine, revered for its bold flavor, aromatic complexity, and culinary versatility. As one of the oldest and most widely traded spices in the world, pepper adds depth and character to dishes across cultures and continents, from savory stews and sauces to spicy marinades and seasoning blends. Whether black, white, green, or pink, each variety of pepper offers its own unique flavor profile and heat intensity, captivating taste buds and elevating culinary experiences. Beyond its culinary uses, pepper is valued for its potential health benefits, including antioxidant properties and digestive aid. In the culinary world, pepper's enduring popularity reflects its ability to enhance the taste and aroma of a wide range of dishes, from everyday meals to gourmet creations. As global tastes continue to evolve and culinary exploration thrives, pepper remains an essential spice that enriches cuisines and connects cultures around the world.
Pepper Competitive Landscape
The market report analyses the leading companies in the industry including Ajinomoto Co.Inc, Baria Pepper, DS Group, Everest Spices, Indian Valley Foods Pvt. Ltd, Kancor Ingredients Ltd, Olam International, Synthite Industries Ltd, Vietnam Hanfimex Corp, Webb James Srl, and Others.
Pepper Market Dynamics
Pepper Market Trend: Increasing Demand for Ethnic and Exotic Flavors
The market for Pepper is experiencing a prominent trend driven by the increasing demand for ethnic and exotic flavors in the food industry. Consumers are seeking out diverse culinary experiences and adventurous taste profiles, leading to a growing interest in spices like pepper from different regions around the world. Pepper varieties such as black, white, green, and pink pepper offer distinct flavor profiles and aroma characteristics that add depth and complexity to a wide range of dishes, from traditional cuisines to fusion and global-inspired recipes. This trend is fueled by multicultural influences, globalization, and the rise of food tourism, driving the popularity of pepper as a versatile and essential ingredient in diverse culinary traditions.
Market Driver: Health Benefits and Culinary Versatility
The market for Pepper is primarily driven by the health benefits and culinary versatility of this spice. Pepper is not only prized for its bold flavor and aroma but also for its potential health-promoting properties. It contains bioactive compounds such as piperine, which is known for its antioxidant, anti-inflammatory, and digestive health benefits. Additionally, pepper is a staple ingredient in a wide range of savory and sweet dishes, including soups, stews, marinades, sauces, and desserts, making it indispensable in kitchens worldwide. The demand for pepper is further driven by its role in enhancing the taste, aroma, and visual appeal of dishes, as well as its ability to complement and balance other ingredients in various culinary applications.
Market Opportunity: Expansion into Premium and Specialty Pepper Products
The market for Pepper presents a significant opportunity for companies to expand into premium and specialty pepper products to cater to discerning consumers seeking higher quality and unique flavor experiences. Companies can innovate by offering single-origin pepper varieties sourced from specific regions known for their distinct terroir and flavor profiles, such as Malabar black pepper from India or Sarawak white pepper from Malaysia. Additionally, there are opportunities to develop organic, fair trade, and sustainable pepper products to meet the growing demand for ethically sourced and environmentally responsible spices. By differentiating their pepper offerings through quality, authenticity, and sustainability, companies can capture market share in the premium spice segment and appeal to consumers willing to pay a premium for superior flavor and quality.
Pepper Market Share Analysis: Black Pepper held the dominant market share in 2024
The largest segment in the pepper market is black pepper. Black pepper's dominance is largely due to its widespread culinary use and its significant role in global cuisines as a fundamental spice. It is the most versatile and commonly used pepper variety, favored for its robust flavor and aroma, which enhance a wide array of dishes from different culinary traditions. The high demand for black pepper is also driven by its various applications beyond cooking, including its use in traditional medicine and as a preservative. Further, black pepper's prominent role in both household kitchens and the food service industry underscores its substantial market share. The production and trade volume of black pepper further highlight its position as the leading product in the pepper market, supported by extensive cultivation and export activities in major producing countries like India, Vietnam, and Brazil. This consistent demand across multiple sectors solidifies black pepper's status as the largest segment within the pepper market.
Pepper Market Share Analysis: Pharmaceuticals market is poised to register the fastest growth rae over the forecast period to 2032
The fastest growing segment in the pepper market is pharmaceuticals. This surge is driven by the increasing recognition of pepper, particularly black pepper, for its medicinal properties. Piperine, the active compound in black pepper, has been extensively studied for its health benefits, including its potential to enhance nutrient absorption, possess anti-inflammatory properties, and act as an antioxidant. The growing trend towards natural and holistic health solutions has further propelled the demand for pepper in pharmaceutical formulations. Additionally, the rise in lifestyle-related health issues has led to a greater emphasis on preventive healthcare, where natural ingredients like pepper are increasingly incorporated into supplements and therapeutic products. The ongoing research and development in the pharmaceutical industry to explore new applications and benefits of pepper compounds continue to support the robust growth of this segment, making it the fastest growing application area in the pepper market.
Pepper Market Share Analysis: Powdered Pepper held the dominant market share in 2024
The largest segment in the pepper market by form is powdered pepper. This dominance is primarily due to its convenience and versatility in culinary uses. Powdered pepper is a staple in both household kitchens and the food service industry, offering ease of use and uniformity in seasoning. It is extensively used in a variety of processed foods, spice blends, and ready-to-eat meals, making it highly popular among consumers and food manufacturers alike. The longer shelf life and ease of storage of powdered pepper compared to whole pepper further enhance its appeal. Additionally, powdered pepper's consistent flavor profile and ability to blend seamlessly into recipes contribute to its widespread preference. These factors collectively make powdered pepper the largest segment in the pepper market, driven by its extensive use and practicality.
Pepper Market Segmentation
By Product
Black Pepper
White Pepper
Green Pepper
By Application
Food and Beverages
Personal Care
Pharmaceuticals
Others
By Form
Whole Pepper
Powdered Pepper
Countries Analyzed
North America (US, Canada, Mexico)
Europe (Germany, UK, France, Spain, Italy, Russia, Rest of Europe)
Asia Pacific (China, India, Japan, South Korea, Australia, South East Asia, Rest of Asia)
South America (Brazil, Argentina, Rest of South America)
Middle East and Africa (Saudi Arabia, UAE, Rest of Middle East, South Africa, Egypt, Rest of Africa)
Pepper Companies Profiled in the Study
Ajinomoto Co.Inc
Baria Pepper
DS Group
Everest Spices
Indian Valley Foods Pvt. Ltd
Kancor Ingredients Ltd
Olam International
Synthite Industries Ltd
Vietnam Hanfimex Corp
Webb James Srl
*- List Not Exhaustive
Chapter 1. TABLE OF CONTENTS
Chapter 2. Introduction to Pepper Market
2.1. Market Overview
2.2. Key Statistics and Report Highlights
2.3. Scope of the Comprehensive Study
2.3.1. Market Definition
2.3.2 Countries and Regions Covered
2.3.3 Research Objective
2.3.4 Units, Currency, and Conversions
2.3.5 Industry Value Chain
2.4. Key Market Segments
2.5. Key Companies
2.6. Study Period
Chapter 3. Strategic Analysis Review
3.1. Pepper Pricing Analysis and Forecast
3.2. Porter’s Five Forces
3.3. Market Ecosystem
3.4. SWOT Analysis
3.5. Regulatory Scenario
3.3. Effects of Inflation, Russia-Ukraine War, moderating economic growth, and other macroeconomic factors
Chapter 4. Competitive Landscape
4.1. Market Share Analysis
4.1.1. Global Pepper Market Share by Company, 2023
4.1.2. Product Offerings of Leading Pepper Companies
4.2. Market Entropy
4.2.1. New Product Launches in the Industry
4.2.2. Mergers, Acquisitions, Joint ventures, and Partnerships
4.3. Key Strategies and Best Practices
Chapter 5. Global Market Projections: Best, Reference, and Low Case Scenarios
5.1. Growth Analysis- Case Scenario Definitions
5.2. Low Growth Case Scenario Forecasts
5.3. Reference Growth Case Scenario Forecasts
5.4. High Growth Case Scenario Forecasts
Chapter 6. Market Dynamics
6.1. Pepper Market Drivers
6.2. Pepper Market Challenges
6.6. Pepper Market Opportunities
6.4. Pepper Market Trends
Chapter 7. Global Pepper Market Outlook Trends
7.1. Global Pepper Revenue (USD Million) and CAGR (%) by Type (2021-2032)
7.2. Global Pepper Revenue (USD Million) and CAGR (%) by Application (2021-2032)
7.3. Global Pepper Revenue (USD Million) and CAGR (%) by Product (2021-2032)
By Product
Black Pepper
White Pepper
Green Pepper
By Application
Food and Beverages
Personal Care
Pharmaceuticals
Others
By Form
Whole Pepper
Powdered Pepper
Chapter 8. Global Pepper Regional Analysis and Outlook
8.1. Global Pepper Revenue (USD Million) By Regions (2021- 2032)
8.2. North America Pepper Revenue (USD Million) by Country (2021-2032)
8.2.1. United States Pepper Regional Analysis and Outlook
8.2.2. Canada Pepper Regional Analysis and Outlook
8.2.3. Mexico Pepper Regional Analysis and Outlook
8.3. Europe Pepper Revenue (USD Million), by Country (2021-2032)
8.3.1. Germany Pepper Regional Analysis and Outlook
8.3.2. France Pepper Regional Analysis and Outlook
8.3.3. United Kingdom Pepper Regional Analysis and Outlook
8.3.4. Spain Pepper Regional Analysis and Outlook
8.3.5. Italy Pepper Regional Analysis and Outlook
8.3.6. Russia Pepper Regional Analysis and Outlook
8.3.7. Rest of Europe Pepper Regional Analysis and Outlook
8.4. Asia Pacific Pepper Revenue (USD Million) by Country (2021-2032)
8.4.1. China Pepper Regional Analysis and Outlook
8.4.2. Japan Pepper Regional Analysis and Outlook
8.4.3. India Pepper Regional Analysis and Outlook
8.4.4. South Korea Pepper Regional Analysis and Outlook
8.4.5. Australia Pepper Regional Analysis and Outlook
8.4.6. South East Asia Pepper Regional Analysis and Outlook
8.4.7. Rest of Asia Pacific Pepper Regional Analysis and Outlook
8.5. South America Pepper Revenue (USD Million), by Country (2021-2032)
8.5.1. Brazil Pepper Regional Analysis and Outlook
8.5.2. Argentina Pepper Regional Analysis and Outlook
8.5.3. Rest of South America Pepper Regional Analysis and Outlook
8.6. Middle East and Africa Pepper Revenue (USD Million) by Country (2021-2032)
8.6.1. Middle East Pepper Regional Analysis and Outlook
8.6.2. Africa Pepper Regional Analysis and Outlook
Chapter 9. North America Pepper Analysis and Outlook
9.1. North America Pepper Revenue (USD Million) by Segments (2021-2032)
9.1.1. North America Pepper Revenue (USD Million) by Type (2021-2032)
9.1.2. North America Pepper Revenue (USD Million) by Application (2021-2032)
9.1.3. North America Pepper Revenue (USD Million) by Product (2021-2032)
By Product
Black Pepper
White Pepper
Green Pepper
By Application
Food and Beverages
Personal Care
Pharmaceuticals
Others
By Form
Whole Pepper
Powdered Pepper
Chapter 10. Europe Pepper Analysis and Outlook
10.1. Europe Pepper Revenue (USD Million), by Segments (USD Million) (2021-2032)
10.1.1. Europe Pepper Revenue (USD Million) by Type (2021-2032)
10.1.2. Europe Pepper Revenue (USD Million) by Application (2021-2032)
10.1.3. Europe Pepper Revenue (USD Million) by Product (2021-2032)
By Product
Black Pepper
White Pepper
Green Pepper
By Application
Food and Beverages
Personal Care
Pharmaceuticals
Others
By Form
Whole Pepper
Powdered Pepper
Chapter 11. Asia Pacific Pepper Analysis and Outlook
11.1. Asia Pacific Pepper Revenue (USD Million), and Revenue (USD Million) by Segments (2021-2032)
11.1.1. Asia Pacific Pepper Revenue (USD Million) by Type (2021-2032)
11.1.2. Asia Pacific Pepper Revenue (USD Million) by Application (2021-2032)
11.1.3. Asia Pacific Pepper Revenue (USD Million) by Product (2021-2032)
By Product
Black Pepper
White Pepper
Green Pepper
By Application
Food and Beverages
Personal Care
Pharmaceuticals
Others
By Form
Whole Pepper
Powdered Pepper
Chapter 12. South America Pepper Analysis and Outlook
12.1. South America Pepper Revenue (USD Million), by Segments (2021-2032)
12.1.1. South America Pepper Revenue (USD Million) by Type (2021-2032)
12.1.2. South America Pepper Revenue (USD Million) by Application (2021-2032)
12.1.3. South America Pepper Revenue (USD Million) by Product (2021-2032)
By Product
Black Pepper
White Pepper
Green Pepper
By Application
Food and Beverages
Personal Care
Pharmaceuticals
Others
By Form
Whole Pepper
Powdered Pepper
Chapter 13. Middle East and Africa Pepper Analysis and Outlook
13.1. Middle East and Africa Pepper Revenue (USD Million), by Segments (2021-2032)
13.1.1. Middle East and Africa Pepper Revenue (USD Million) by Type (2021-2032)
13.1.2. Middle East and Africa Pepper Revenue (USD Million) by Application (2021-2032)
13.1.3. Middle East and Africa Pepper Revenue (USD Million) by Product (2021-2032)
By Product
Black Pepper
White Pepper
Green Pepper
By Application
Food and Beverages
Personal Care
Pharmaceuticals
Others
By Form
Whole Pepper
Powdered Pepper
Chapter 14. Pepper Company Profiles
14.1 Business Overview
14.2 Product Profiles
14.3 SWOT Profiles
14.5 Recent Developments
14.6 Financial Profile
List of Companies
Ajinomoto Co.Inc
Baria Pepper
DS Group
Everest Spices
Indian Valley Foods Pvt. Ltd
Kancor Ingredients Ltd
Olam International
Synthite Industries Ltd
Vietnam Hanfimex Corp
Webb James Srl
15. Methodology and Data Sources
15.1 Customization Offerings
15.2 Subscription Services
15.3 Related Reports
15.4 Publisher Expertise
LIST OF TABLES
Table 1 Market Segmentation Analysis
Table 2 Global Pepper Market Share of Leading Companies, 2023
Table 3 Product Offerings of Leading Companies
Table 4 Low Growth Scenario Forecasts
Table 5 Reference Case Growth Scenario
Table 6 High Growth Case Scenario
Table 7 Global Pepper Revenue (USD Million) And CAGR (%) By Type (2021-2032)
Table 8 Global Pepper Revenue (USD Million) And CAGR (%) By Application (2021-2032)
Table 9 Global Pepper Revenue (USD Million) And CAGR (%) By Product (2021-2032)
Table 10 Global Pepper Market Revenue (USD Million) By Regions (2021-2032)
Table 11 Global Pepper Market Share (%) By Regions (2021-2032)
Table 12 North America Pepper Revenue (USD Million) By Country (2021-2032)
Table 13 Europe Pepper Revenue (USD Million) By Country (2021-2032)
Table 14 Asia Pacific Pepper Revenue (USD Million) By Country (2021-2032)
Table 15 South America Pepper Revenue (USD Million) By Country (2021-2032)
Table 16 Middle East and Africa Pepper Revenue (USD Million) By Region (2021-2032)
Table 17 North America Pepper Revenue (USD Million) By Type (2021-2032)
Table 18 North America Pepper Revenue (USD Million) By Application (2021-2032)
Table 19 North America Pepper Revenue (USD Million) By Product (2021-2032)
Table 20 Europe Pepper Revenue (USD Million) By Type (2021-2032)
Table 21 Europe Pepper Revenue (USD Million) By Application (2021-2032)
Table 22 Europe Pepper Revenue (USD Million) By Product (2021-2032)
Table 23 Asia Pacific Pepper Revenue (USD Million) By Type (2021-2032)
Table 24 Asia Pacific Pepper Revenue (USD Million) By Application (2021-2032)
Table 25 Asia Pacific Pepper Revenue (USD Million) By Product (2021-2032)
Table 26 South America Pepper Revenue (USD Million) By Type (2021-2032)
Table 27 South America Pepper Revenue (USD Million) By Application (2021-2032)
Table 28 South America Pepper Revenue (USD Million) By Product (2021-2032)
Table 29 Middle East and Africa Pepper Revenue (USD Million) By Type (2021-2032)
Table 30 Middle East and Africa Pepper Revenue (USD Million) By Application (2021-2032)
Table 31 Middle East and Africa Pepper Revenue (USD Million) By Product (2021-2032)
LIST OF FIGURES
Figure 1. Market Scope
Figure 2. Pricing Forecasts Per Unit, 2023- 2032
Figure 3. Porter’s Five Forces
Figure 4. Global Pepper Market Revenue (USD Million) By Regions (2021-2032)
Figure 5. Global Pepper Market Share (%) By Regions (2023)
Figure 6. North America Pepper Revenue (USD Million) By Country (2021-2032)
Figure 7. United States Pepper Revenue (USD Million) By Country (2021-2032)
Figure 8. Canada Pepper Revenue (USD Million) By Country (2021-2032)
Figure 9. Mexico Pepper Revenue (USD Million) By Country (2021-2032)
Figure 10. Europe Pepper Revenue (USD Million) By Country (2021-2032)
Figure 11. Germany Pepper Revenue (USD Million) By Country (2021-2032)
Figure 12. France Pepper Revenue (USD Million) By Country (2021-2032)
Figure 13. United Kingdom Pepper Revenue (USD Million) By Country (2021-2032)
Figure 14. Spain Pepper Revenue (USD Million) By Country (2021-2032)
Figure 15. Italy Pepper Revenue (USD Million) By Country (2021-2032)
Figure 16. Russia Pepper Revenue (USD Million) By Country (2021-2032)
Figure 17. Rest of Europe Pepper Revenue (USD Million) By Country (2021-2032)
Figure 11. Asia Pacific Pepper Revenue (USD Million) By Country (2021-2032)
Figure 12. China Pepper Revenue (USD Million) By Country (2021-2032)
Figure 13. Japan Pepper Revenue (USD Million) By Country (2021-2032)
Figure 14. India Pepper Revenue (USD Million) By Country (2021-2032)
Figure 15. South Korea Pepper Revenue (USD Million) By Country (2021-2032)
Figure 16. Australia Pepper Revenue (USD Million) By Country (2021-2032)
Figure 17. South East Asia Pepper Revenue (USD Million) By Country (2021-2032)
Figure 18. South America Pepper Revenue (USD Million) By Country (2021-2032)
Figure 19. Brazil Pepper Revenue (USD Million) By Country (2021-2032)
Figure 20. Argentina Pepper Revenue (USD Million) By Country (2021-2032)
Figure 21. Rest of Asia Pacific Pepper Revenue (USD Million) By Country (2021-2032)
Figure 22. Middle East and Africa Pepper Revenue (USD Million) By Region (2021-2032)
Figure 23. Saudi Arabia Pepper Revenue (USD Million) By Region (2021-2032)
Figure 24. The UAE Pepper Revenue (USD Million) By Region (2021-2032)
Figure 25. Rest of Middle East Pepper Revenue (USD Million) By Region (2021-2032)
Figure 26. South Africa Pepper Revenue (USD Million) By Region (2021-2032)
Figure 27. Africa Pepper Revenue (USD Million) By Region (2021-2032)
Figure 28. North America Pepper Revenue (USD Million) By Type (2021-2032)
Figure 29. North America Pepper Revenue (USD Million) By Application (2021-2032)
Figure 30. North America Pepper Revenue (USD Million) By Product (2021-2032)
Figure 31. Europe Pepper Revenue (USD Million) By Type (2021-2032)
Figure 32. Europe Pepper Revenue (USD Million) By Application (2021-2032)
Figure 33. Europe Pepper Revenue (USD Million) By Product (2021-2032)
Figure 34. Asia Pacific Pepper Revenue (USD Million) By Type (2021-2032)
Figure 35. Asia Pacific Pepper Revenue (USD Million) By Application (2021-2032)
Figure 36. Asia Pacific Pepper Revenue (USD Million) By Product (2021-2032)
Figure 37. South America Pepper Revenue (USD Million) By Type (2021-2032)
Figure 38. South America Pepper Revenue (USD Million) By Application (2021-2032)
Figure 39. South America Pepper Revenue (USD Million) By Product (2021-2032)
Figure 40. Middle East and Africa Pepper Revenue (USD Million) By Type (2021-2032)
Figure 41. Middle East and Africa Pepper Revenue (USD Million) By Application (2021-2032)
Figure 42. Middle East and Africa Pepper Revenue (USD Million) By Product (2021-2032)
By Product
Black Pepper
White Pepper
Green Pepper
By Application
Food and Beverages
Personal Care
Pharmaceuticals
Others
By Form
Whole Pepper
Powdered Pepper
Countries Analyzed
North America (US, Canada, Mexico)
Europe (Germany, UK, France, Spain, Italy, Russia, Rest of Europe)
Asia Pacific (China, India, Japan, South Korea, Australia, South East Asia, Rest of Asia)
South America (Brazil, Argentina, Rest of South America)
Middle East and Africa (Saudi Arabia, UAE, Rest of Middle East, South Africa, Egypt, Rest of Africa)
