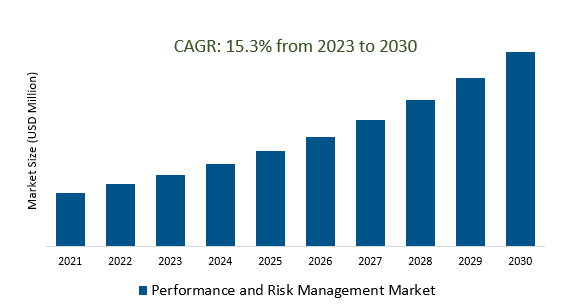
The Global Performance and Risk Management Market Size is estimated to register 15.3% growth over the forecast period from 2023 to 2030.
The market growth is driven by Increasingly stringent regulatory requirements across various industries are driving the adoption of advanced PRM solutions. Organizations are seeking comprehensive tools that not only assess and mitigate risks but also facilitate compliance with evolving regulations. The integration of automated reporting features within PRM systems helps organizations streamline regulatory reporting processes, reducing the likelihood of non-compliance and associated penalties. Leading Companies focusing on the Adoption of Advanced Analytics and Predictive Modeling, Enhanced User Experience and Accessibility, Integration of Blockchain Technology for Security and Transparency, and others to boost market shares in the industry.
Market Overview
The Performance and Risk Management (PRM) market involves software solutions for assessing and managing organizational performance and risks. Key components include performance management, focusing on tracking and analyzing KPIs, and risk management, addressing various risks such as financial, operational, and regulatory. PRM tools leverage data analytics, scenario modeling, and reporting features to facilitate data-driven decision-making. Market drivers include the increasing complexity of business environments, the emphasis on data-driven decision-making, and the need to mitigate risks in the digital era. Challenges include integration with existing systems, data security and privacy concerns, and the necessity to adapt to rapid changes. Future trends may involve the use of artificial intelligence for predictive analytics, a heightened focus on environmental, social, and governance factors, and improvements in user experience through intuitive interfaces.
Market Dynamics
Market Trends- The integration of artificial intelligence (AI) and machine learning (ML) is transforming the realm of performance and risk management.
The integration of artificial intelligence (AI) and machine learning (ML) is revolutionizing performance and risk management (PRM). AI and ML empower PRM systems to analyze extensive datasets, identify patterns, and predict future risks, enhancing the precision of risk assessment and mitigation. This data-driven approach enables organizations to make more informed decisions and optimize overall performance. The symbiotic relationship between AI, ML, and PRM is driving innovation, efficiency, and adaptability in navigating the complexities of modern business landscapes.
Market Driver- The growing prominence of cybersecurity threats is fueling the demand for robust performance and risk management solutions.
The escalating prominence of cybersecurity threats is driving heightened demand for robust performance and risk management (PRM) solutions. Organizations, grappling with the increasing frequency and sophistication of cyberattacks, seek comprehensive PRM systems to assess and address the specific challenges posed by cybersecurity threats. By integrating cybersecurity metrics into the broader PRM framework, companies can proactively identify and mitigate potential vulnerabilities, fostering a more secure and resilient business environment. This intersection reflects a strategic response to the evolving threat landscape, emphasizing the pivotal role of integrated risk management in safeguarding organizational assets and ensuring sustained business continuity.
Market Opportunity- Cloud-based performance and risk management solutions are gaining traction due to their scalability, accessibility, and cost-effectiveness.
Cloud-based performance and risk management (PRM) solutions are gaining traction due to their scalability, accessibility, and cost-effectiveness. Organizations are adopting these solutions to leverage cloud computing's flexibility, enabling real-time data access, collaboration, and efficient updates. The scalability of cloud-based PRM supports adaptability to changing business needs and seamless handling of large data volumes. Improved accessibility allows users to collaborate from anywhere, and the cost-effectiveness eliminates substantial upfront investments in hardware. This trend signifies a shift towards agile, cost-efficient PRM solutions, harnessing cloud technology's advantages for optimizing organizational performance and risk
Market Share Analysis- Risk Management The performance and Risk Management Market will register the fastest growth
The Global Performance and Risk Management Market is analyzed across Performance Management, Risk Management, and others. Risk Management is poised to register the fastest growth. Risk management in the Performance and Risk Management (PRM) market is vital for identifying, assessing, and mitigating financial, operational, regulatory, and emerging risks. Integrated into PRM solutions, risk management enables organizations to proactively address uncertainties, enhance decision-making, and ensure resilience in the face of a dynamic business environment. This synergy between performance optimization and risk mitigation is integral as the PRM market evolves, providing organizations with comprehensive solutions to navigate complexities effectively.
Market Share Analysis- Solution held a significant market share in 2023
The Global Performance and Risk Management Market is analyzed across various Components including Solutions, Services, and others. Of these, Solution held a significant market share in 2023. In the Performance and Risk Management (PRM) market, solutions encompass software tools leveraging data analytics, AI, and ML to optimize performance and mitigate risks. These solutions offer features like scenario modeling, reporting, and dashboards, addressing the dynamic needs of businesses with adaptability and scalability. The integration of innovative technologies in PRM reflects a strategic response to the evolving nature of modern business environments, emphasizing the crucial balance between performance optimization and risk management for organizational success.
Performance and Risk Management Market Segmentation
By Type
- Performance Management
- Risk Management
- Others
By Component
By Deployment Mode
By Organization Size
By Region
- North America (United States, Canada, Mexico)
- Europe (Germany, France, United Kingdom, Spain, Italy, Others)
- Asia Pacific (China, India, Japan, South Korea, Australia, Others)
- Latin America (Brazil, Argentina, Others)
- Middle East and Africa (Saudi Arabia, UAE, Kuwait, Other Middle East, South Africa, Nigeria, Other Africa)
Performance and Risk Management Market Companies
- IBM Corporation (United States)
- CCMSI (United States)
- OpenText (Canada)
- BizVibe (United Kingdom)
- Protecht (Australia)
- SimCorp (Denmark)
- Broadleaf (United States)
- OneTrust (United States)
- RMS (United States)
- Navex Global (United States)
- Origami Risk (United States)
- LogicManager (United States)
- MetricStream (United States)
*List not exhaustive
Performance and Risk Management Market Outlook 2023
1 Market Overview
1.1 Introduction to the Performance and Risk Management Market
1.2 Scope of the Study
1.3 Research Objective
1.3.1 Key Market Scope and Segments
1.3.2 Players Covered
1.3.3 Years Considered
2 Executive Summary
2.1 2023 Performance and Risk Management Industry- Market Statistics
3 Market Dynamics
3.1 Market Drivers
3.2 Market Challenges
3.3 Market Opportunities
3.4 Market Trends
4 Market Factor Analysis
4.1 Porter’s Five Forces
4.2 Market Entropy
4.2.1 Global Performance and Risk Management Market Companies with Area Served
4.2.2 Products Offerings Global Performance and Risk Management Market
5 COVID-19 Impact Analysis and Outlook Scenarios
5.1.1 Covid-19 Impact Analysis
5.1.2 post-COVID-19 Scenario- Low Growth Case
5.1.3 post-COVID-19 Scenario- Reference Growth Case
5.1.4 post-COVID-19 Scenario- Low Growth Case
6 Global Performance and Risk Management Market Trends
6.1 Global Performance and Risk Management Revenue (USD Million) and CAGR (%) by Type (2018-2030)
6.2 Global Performance and Risk Management Revenue (USD Million) and CAGR (%) by Applications (2018-2030)
6.3 Global Performance and Risk Management Revenue (USD Million) and CAGR (%) by regions (2018-2030)
7 Global Performance and Risk Management Market Revenue (USD Million) by Type, and Applications (2018-2022)
7.1 Global Performance and Risk Management Revenue (USD Million) by Type (2018-2022)
7.1.1 Global Performance and Risk Management Revenue (USD Million), Market Share (%) by Type (2018-2022)
7.2 Global Performance and Risk Management Revenue (USD Million) by Applications (2018-2022)
7.2.1 Global Performance and Risk Management Revenue (USD Million), Market Share (%) by Applications (2018-2022)
8 Global Performance and Risk Management Development Regional Status and Outlook
8.1 Global Performance and Risk Management Revenue (USD Million) By Regions (2018-2022)
8.2 North America Performance and Risk Management Revenue (USD Million) by Type, and Application (2018-2022)
8.2.1 North America Performance and Risk Management Revenue (USD Million) by Country (2018-2022)
8.2.2 North America Performance and Risk Management Revenue (USD Million) by Type (2018-2022)
8.2.3 North America Performance and Risk Management Revenue (USD Million) by Applications (2018-2022)
8.3 Europe Performance and Risk Management Revenue (USD Million), by Type, and Applications (USD Million) (2018-2022)
8.3.1 Europe Performance and Risk Management Revenue (USD Million), by Country (2018-2022)
8.3.2 Europe Performance and Risk Management Revenue (USD Million) by Type (2018-2022)
8.3.3 Europe Performance and Risk Management Revenue (USD Million) by Applications (2018-2022)
8.4 Asia Pacific Performance and Risk Management Revenue (USD Million), and Revenue (USD Million) by Type, and Applications (2018-2022)
8.4.1 Asia Pacific Performance and Risk Management Revenue (USD Million) by Country (2018-2022)
8.4.2 Asia Pacific Performance and Risk Management Revenue (USD Million) by Type (2018-2022)
8.4.3 Asia Pacific Performance and Risk Management Revenue (USD Million) by Applications (2018-2022)
8.5 South America Performance and Risk Management Revenue (USD Million), by Type, and Applications (2018-2022)
8.5.1 South America Performance and Risk Management Revenue (USD Million), by Country (2018-2022)
8.5.2 South America Performance and Risk Management Revenue (USD Million) by Type (2018-2022)
8.5.3 South America Performance and Risk Management Revenue (USD Million) by Applications (2018-2022)
8.6 Middle East and Africa Performance and Risk Management Revenue (USD Million), by Type, Technology, Application, Thickness (2018-2022)
8.6.1 Middle East and Africa Performance and Risk Management Revenue (USD Million) by Country (2018-2022)
8.6.2 Middle East and Africa Performance and Risk Management Revenue (USD Million) by Type (2018-2022)
8.6.3 Middle East and Africa Performance and Risk Management Revenue (USD Million) by Applications (2018-2022)
9 Company Profiles
10 Global Performance and Risk Management Market Revenue (USD Million), by Type, and Applications (2023-2030)
10.1 Global Performance and Risk Management Revenue (USD Million) and Market Share (%) by Type (2023-2030)
10.1.1 Global Performance and Risk Management Revenue (USD Million), and Market Share (%) by Type (2023-2030)
10.2 Global Performance and Risk Management Revenue (USD Million) and Market Share (%) by Applications (2023-2030)
10.2.1 Global Performance and Risk Management Revenue (USD Million), and Market Share (%) by Applications (2023-2030)
11 Global Performance and Risk Management Development Regional Status and Outlook Forecast
11.1 Global Performance and Risk Management Revenue (USD Million) By Regions (2023-2030)
11.2 North America Performance and Risk Management Revenue (USD Million) by Type, and Applications (2023-2030)
11.2.1 North America Performance and Risk Management Revenue (USD) Million by Country (2023-2030)
11.2.2 North America Performance and Risk Management Revenue (USD Million), by Type (2023-2030)
11.2.3 North America Performance and Risk Management Revenue (USD Million), Market Share (%) by Applications (2023-2030)
11.3 Europe Performance and Risk Management Revenue (USD Million), by Type, and Applications (2023-2030)
11.3.1 Europe Performance and Risk Management Revenue (USD Million), by Country (2023-2030)
11.3.2 Europe Performance and Risk Management Revenue (USD Million), by Type (2023-2030)
11.3.3 Europe Performance and Risk Management Revenue (USD Million), by Applications (2023-2030)
11.4 Asia Pacific Performance and Risk Management Revenue (USD Million) by Type, and Applications (2023-2030)
11.4.1 Asia Pacific Performance and Risk Management Revenue (USD Million), by Country (2023-2030)
11.4.2 Asia Pacific Performance and Risk Management Revenue (USD Million), by Type (2023-2030)
11.4.3 Asia Pacific Performance and Risk Management Revenue (USD Million), by Applications (2023-2030)
11.5 South America Performance and Risk Management Revenue (USD Million), by Type, and Applications (2023-2030)
11.5.1 South America Performance and Risk Management Revenue (USD Million), by Country (2023-2030)
11.5.2 South America Performance and Risk Management Revenue (USD Million), by Type (2023-2030)
11.5.3 South America Performance and Risk Management Revenue (USD Million), by Applications (2023-2030)
11.6 Middle East and Africa Performance and Risk Management Revenue (USD Million), by Type, and Applications (2023-2030)
11.6.1 Middle East and Africa Performance and Risk Management Revenue (USD Million), by region (2023-2030)
11.6.2 Middle East and Africa Performance and Risk Management Revenue (USD Million), by Type (2023-2030)
11.6.3 Middle East and Africa Performance and Risk Management Revenue (USD Million), by Applications (2023-2030)
12 Methodology and Data Sources
12.1 Methodology/Research Approach
12.1.1 Research Programs/Design
12.1.2 Market Size Estimation
12.1.3 Market Breakdown and Data Triangulation
12.2 Data Sources
12.2.1 Secondary Sources
12.2.2 Primary Sources
12.3 Disclaimer
List of Tables
Table 1 Market Segmentation Analysis
Table 2 Global Performance and Risk Management Market Companies with Areas Served
Table 3 Products Offerings Global Performance and Risk Management Market
Table 4 Low Growth Scenario Forecasts
Table 5 Reference Case Growth Scenario
Table 6 High Growth Case Scenario
Table 7 Global Performance and Risk Management Revenue (USD Million) And CAGR (%) By Type (2018-2030)
Table 8 Global Performance and Risk Management Revenue (USD Million) And CAGR (%) By Applications (2018-2030)
Table 9 Global Performance and Risk Management Revenue (USD Million) And CAGR (%) By Regions (2018-2030)
Table 10 Global Performance and Risk Management Revenue (USD Million) By Type (2018-2022)
Table 11 Global Performance and Risk Management Revenue Market Share (%) By Type (2018-2022)
Table 12 Global Performance and Risk Management Revenue (USD Million) By Applications (2018-2022)
Table 13 Global Performance and Risk Management Revenue Market Share (%) By Applications (2018-2022)
Table 14 Global Performance and Risk Management Market Revenue (USD Million) By Regions (2018-2022)
Table 15 Global Performance and Risk Management Market Share (%) By Regions (2018-2022)
Table 16 North America Performance and Risk Management Revenue (USD Million) By Country (2018-2022)
Table 17 North America Performance and Risk Management Revenue (USD Million) By Type (2018-2022)
Table 18 North America Performance and Risk Management Revenue (USD Million) By Applications (2018-2022)
Table 19 Europe Performance and Risk Management Revenue (USD Million) By Country (2018-2022)
Table 20 Europe Performance and Risk Management Revenue (USD Million) By Type (2018-2022)
Table 21 Europe Performance and Risk Management Revenue (USD Million) By Applications (2018-2022)
Table 22 Asia Pacific Performance and Risk Management Revenue (USD Million) By Country (2018-2022)
Table 23 Asia Pacific Performance and Risk Management Revenue (USD Million) By Type (2018-2022)
Table 24 Asia Pacific Performance and Risk Management Revenue (USD Million) By Applications (2018-2022)
Table 25 South America Performance and Risk Management Revenue (USD Million) By Country (2018-2022)
Table 26 South America Performance and Risk Management Revenue (USD Million) By Type (2018-2022)
Table 27 South America Performance and Risk Management Revenue (USD Million) By Applications (2018-2022)
Table 28 Middle East and Africa Performance and Risk Management Revenue (USD Million) By Region (2018-2022)
Table 29 Middle East and Africa Performance and Risk Management Revenue (USD Million) By Type (2018-2022)
Table 30 Middle East and Africa Performance and Risk Management Revenue (USD Million) By Applications (2018-2022)
Table 31 Financial Analysis
Table 32 Global Performance and Risk Management Revenue (USD Million) By Type (2023-2030)
Table 33 Global Performance and Risk Management Revenue Market Share (%) By Type (2023-2030)
Table 34 Global Performance and Risk Management Revenue (USD Million) By Applications (2023-2030)
Table 35 Global Performance and Risk Management Revenue Market Share (%) By Applications (2023-2030)
Table 36 Global Performance and Risk Management Market Revenue (USD Million), And Revenue (USD Million) By Regions (2023-2030)
Table 37 North America Performance and Risk Management Revenue (USD)By Country (2023-2030)
Table 38 North America Performance and Risk Management Revenue (USD Million) By Type (2023-2030)
Table 39 North America Performance and Risk Management Revenue (USD Million) By Applications (2023-2030)
Table 40 Europe Performance and Risk Management Revenue (USD Million) By Country (2023-2030)
Table 41 Europe Performance and Risk Management Revenue (USD Million) By Type (2023-2030)
Table 42 Europe Performance and Risk Management Revenue (USD Million) By Applications (2023-2030)
Table 43 Asia Pacific Performance and Risk Management Revenue (USD Million) By Country (2023-2030)
Table 44 Asia Pacific Performance and Risk Management Revenue (USD Million) By Type (2023-2030)
Table 45 Asia Pacific Performance and Risk Management Revenue (USD Million) By Applications (2023-2030)
Table 46 South America Performance and Risk Management Revenue (USD Million) By Country (2023-2030)
Table 47 South America Performance and Risk Management Revenue (USD Million) By Type (2023-2030)
Table 48 South America Performance and Risk Management Revenue (USD Million) By Applications (2023-2030)
Table 49 Middle East and Africa Performance and Risk Management Revenue (USD Million) By Region (2023-2030)
Table 50 Middle East and Africa Performance and Risk Management Revenue (USD Million) By Region (2023-2030)
Table 51 Middle East and Africa Performance and Risk Management Revenue (USD Million) By Type (2023-2030)
Table 52 Middle East and Africa Performance and Risk Management Revenue (USD Million) By Applications (2023-2030)
Table 53 Research Programs/Design for This Report
Table 54 Key Data Information from Secondary Sources
Table 55 Key Data Information from Primary Sources
List of Figures
Figure 1 Market Scope
Figure 2 Porter’s Five Forces
Figure 3 Global Performance and Risk Management Revenue (USD Million) By Type (2018-2022)
Figure 4 Global Performance and Risk Management Revenue Market Share (%) By Type (2022)
Figure 5 Global Performance and Risk Management Revenue (USD Million) By Applications (2018-2022)
Figure 6 Global Performance and Risk Management Revenue Market Share (%) By Applications (2022)
Figure 7 Global Performance and Risk Management Market Revenue (USD Million) By Regions (2018-2022)
Figure 8 Global Performance and Risk Management Market Share (%) By Regions (2022)
Figure 9 North America Performance and Risk Management Revenue (USD Million) By Country (2018-2022)
Figure 10 North America Performance and Risk Management Revenue (USD Million) By Type (2018-2022)
Figure 11 North America Performance and Risk Management Revenue (USD Million) By Applications (2018-2022)
Figure 12 Europe Performance and Risk Management Revenue (USD Million) By Country (2018-2022)
Figure 13 Europe Performance and Risk Management Revenue (USD Million) By Type (2018-2022)
Figure 14 Europe Performance and Risk Management Revenue (USD Million) By Applications (2018-2022)
Figure 15 Asia Pacific Performance and Risk Management Revenue (USD Million) By Country (2018-2022)
Figure 16 Asia Pacific Performance and Risk Management Revenue (USD Million) By Type (2018-2022)
Figure 17 Asia Pacific Performance and Risk Management Revenue (USD Million) By Applications (2018-2022)
Figure 18 South America Performance and Risk Management Revenue (USD Million) By Country (2018-2022)
Figure 19 South America Performance and Risk Management Revenue (USD Million) By Type (2018-2022)
Figure 20 South America Performance and Risk Management Revenue (USD Million) By Applications (2018-2022)
Figure 21 Middle East and Africa Performance and Risk Management Revenue (USD Million) By Region (2018-2022)
Figure 22 Middle East and Africa Performance and Risk Management Revenue (USD Million) By Type (2018-2022)
Figure 23 Middle East and Africa Performance and Risk Management Revenue (USD Million) By Applications (2018-2022)
Figure 24 Global Performance and Risk Management Revenue (USD Million) By Type (2023-2030)
Figure 25 Global Performance and Risk Management Revenue Market Share (%) By Type (2030)
Figure 26 Global Performance and Risk Management Revenue (USD Million) By Applications (2023-2030)
Figure 27 Global Performance and Risk Management Revenue Market Share (%) By Applications (2030)
Figure 28 Global Performance and Risk Management Market Revenue (USD Million) By Regions (2023-2030)
Figure 29 North America Performance and Risk Management Revenue (USD Million) By Country (2023-2030)
Figure 30 North America Performance and Risk Management Revenue (USD Million) By Type (2023-2030)
Figure 31 North America Performance and Risk Management Revenue (USD Million) By Applications (2023-2030)
Figure 32 Europe Performance and Risk Management Revenue (USD Million) By Country (2023-2030)
Figure 33 Europe Performance and Risk Management Revenue (USD Million) By Type (2023-2030)
Figure 34 Europe Performance and Risk Management Revenue (USD Million) By Applications (2023-2030)
Figure 35 Asia Pacific Performance and Risk Management Revenue (USD Million) By Country (2023-2030)
Figure 36 Asia Pacific Performance and Risk Management Revenue (USD Million) By Type (2023-2030)
Figure 37 Asia Pacific Performance and Risk Management Revenue (USD Million) By Applications (2023-2030)
Figure 38 South America Performance and Risk Management Revenue (USD Million) By Country (2023-2030)
Figure 39 South America Performance and Risk Management Revenue (USD Million) By Type (2023-2030)
Figure 40 South America Performance and Risk Management Revenue (USD Million) By Applications (2023-2030)
Figure 41 Middle East and Africa Performance and Risk Management Revenue (USD Million) By Region (2023-2030)
Figure 42 Middle East and Africa Performance and Risk Management Revenue (USD Million) By Region (2023-2030)
Figure 43 Middle East and Africa Performance and Risk Management Revenue (USD Million) By Type (2023-2030)
Figure 44 Middle East and Africa Performance and Risk Management Revenue (USD Million) By Applications (2023-2030)
Figure 45 Bottom-Up and Top-Down Approaches for This Report
Figure 46 Data Triangulation
