
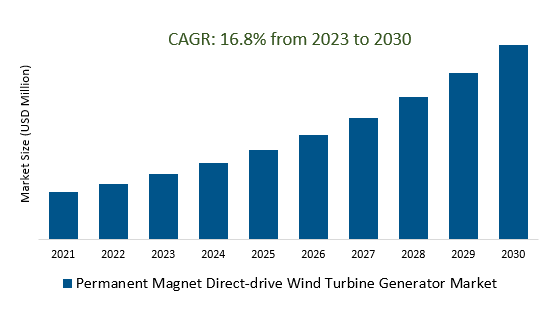
The global Permanent Magnet Direct-drive Wind Turbine Generator Market Size is estimated to register 16.8% growth over the forecast period from 2023 to 2030.
The market growth is driven predominantly by the increasing Continuous innovations in turbine design, materials, and manufacturing processes are leading to more efficient and reliable direct-drive generators. Leading companies are focusing on Increasing Global Wind Power Capacity, Advancements in Technology, Integration of Energy Storage, Digitalization and Predictive Maintenance, and others to boost market shares in the industry.
The Permanent Magnet Direct-drive Wind Turbine Generator Market focuses on generators used in wind turbines, primarily Permanent Magnet Direct-drive Generators (PMDDs), known for their high efficiency and reduced maintenance needs. Major players like Siemens Gamesa, GE Renewable Energy, and Vestas dominate the market. Growth is driven by global renewable energy investments, offshore wind projects, and technological advancements. Despite challenges like production costs and rare earth material dependencies, the market's future looks promising due to the increasing demand for renewable energy sources and ongoing R&D efforts to improve PMDD technology.
Integration of digital technologies in the Permanent Magnet Direct-drive Wind Turbine Generator Market includes real-time condition monitoring, remote control, predictive maintenance, data analytics, cybersecurity measures, and performance optimization. These technologies enhance generator efficiency, reduce downtime and maintenance costs, improve grid connectivity, and facilitate energy storage integration. The trend towards digitalization is expected to continue, further enhancing the performance and sustainability of wind energy generation.
Increased energy demand is a key driver for the Permanent Magnet Direct-drive Wind Turbine Generator Market. As global energy needs rise, there's a growing reliance on renewable sources like wind power. Direct-drive generators play a pivotal role in meeting this demand by efficiently converting wind energy into electricity. Their ability to produce clean energy aligns with the escalating environmental concerns and sustainability goals worldwide. This heightened energy demand, coupled with government support for renewable projects, incentivizes investments in wind turbine generators, ensuring the market's growth as it addresses the need for more sustainable power sources.
The Permanent Magnet Direct-drive Wind Turbine Generator Market is profoundly impacted by the global energy transition, representing the shift from fossil fuels to cleaner energy sources. Direct-drive generators are essential in efficiently converting wind energy into electricity, and they play a crucial role in meeting the rising demand for sustainable power. This transition, driven by environmental concerns and climate change mitigation, is propelling market growth as governments, industries, and consumers increasingly prioritize renewable energy, particularly wind power, to achieve carbon reduction and sustainability objectives.
The global Permanent Magnet Direct-drive Wind Turbine Generator Market is analyzed across 1.5MW, 1.2MW, 2.54MW and others. Of these, 1.5MW are poised to register the fastest growth. A 1.5MW (megawatt) capacity is a common size for Permanent Magnet Direct-drive Wind Turbine Generators in the market. These generators are used in wind turbines with a rated capacity of 1.5MW, which is a popular size for both onshore and offshore wind energy projects. Such turbines are often chosen for their balance of cost-effectiveness and energy production, making them a prominent choice in the wind energy industry.
The global Permanent Magnet Direct-drive Wind Turbine Generator Market is analyzed across a wide range of applications including offshore, onshore and others. Of these, offshore held a significant market share in 2023. The Permanent Magnet Direct-drive Wind Turbine Generator Market has a significant focus on offshore applications, where Permanent Magnet Direct-drive Generators (PMDD) are employed in wind turbines positioned at sea. PMDD generators are favored for their reliability and minimal maintenance requirements, making them ideal for the demanding offshore environment. The offshore wind energy sector is experiencing substantial growth worldwide, leveraging strong and consistent wind resources, with PMDD generators serving as vital components for efficient energy conversion and power generation in offshore wind farms.
By Capacity
By Application
By Region
* List not exhaustive
Permanent Magnet Direct-drive Wind Turbine Generator Market Outlook 2023
1 Market Overview
1.1 Introduction to the Permanent Magnet Direct-drive Wind Turbine Generator Market
1.2 Scope of the Study
1.3 Research Objective
1.3.1 Key Market Scope and Segments
1.3.2 Players Covered
1.3.3 Years Considered
2 Executive Summary
2.1 2023 Permanent Magnet Direct-drive Wind Turbine Generator Industry- Market Statistics
3 Market Dynamics
3.1 Market Drivers
3.2 Market Challenges
3.3 Market Opportunities
3.4 Market Trends
4 Market Factor Analysis
4.1 Porter’s Five Forces
4.2 Market Entropy
4.2.1 Global Permanent Magnet Direct-drive Wind Turbine Generator Market Companies with Area Served
4.2.2 Products Offerings Global Permanent Magnet Direct-drive Wind Turbine Generator Market
5 COVID-19 Impact Analysis and Outlook Scenarios
5.1.1 Covid-19 Impact Analysis
5.1.2 Post-COVID-19 Scenario- Low Growth Case
5.1.3 Post-COVID-19 Scenario- Reference Growth Case
5.1.4 Post-COVID-19 Scenario- Low Growth Case
6 Global Permanent Magnet Direct-drive Wind Turbine Generator Market Trends
6.1 Global Permanent Magnet Direct-drive Wind Turbine Generator Revenue (USD Million) and CAGR (%) by Type (2018-2030)
6.2 Global Permanent Magnet Direct-drive Wind Turbine Generator Revenue (USD Million) and CAGR (%) by Applications (2018-2030)
6.3 Global Permanent Magnet Direct-drive Wind Turbine Generator Revenue (USD Million) and CAGR (%) by Regions (2018-2030)
7 Global Permanent Magnet Direct-drive Wind Turbine Generator Market Revenue (USD Million) by Type, and Applications (2018-2022)
7.1 Global Permanent Magnet Direct-drive Wind Turbine Generator Revenue (USD Million) by Type (2018-2022)
7.1.1 Global Permanent Magnet Direct-drive Wind Turbine Generator Revenue (USD Million), Market Share (%) by Type (2018-2022)
7.2 Global Permanent Magnet Direct-drive Wind Turbine Generator Revenue (USD Million) by Applications (2018-2022)
7.2.1 Global Permanent Magnet Direct-drive Wind Turbine Generator Revenue (USD Million), Market Share (%) by Applications (2018-2022)
8 Global Permanent Magnet Direct-drive Wind Turbine Generator Development Regional Status and Outlook
8.1 Global Permanent Magnet Direct-drive Wind Turbine Generator Revenue (USD Million) By Regions (2018-2022)
8.2 North America Permanent Magnet Direct-drive Wind Turbine Generator Revenue (USD Million) by Type, and Application (2018-2022)
8.2.1 North America Permanent Magnet Direct-drive Wind Turbine Generator Revenue (USD Million) by Country (2018-2022)
8.2.2 North America Permanent Magnet Direct-drive Wind Turbine Generator Revenue (USD Million) by Type (2018-2022)
8.2.3 North America Permanent Magnet Direct-drive Wind Turbine Generator Revenue (USD Million) by Applications (2018-2022)
8.3 Europe Permanent Magnet Direct-drive Wind Turbine Generator Revenue (USD Million), by Type, and Applications (USD Million) (2018-2022)
8.3.1 Europe Permanent Magnet Direct-drive Wind Turbine Generator Revenue (USD Million), by Country (2018-2022)
8.3.2 Europe Permanent Magnet Direct-drive Wind Turbine Generator Revenue (USD Million) by Type (2018-2022)
8.3.3 Europe Permanent Magnet Direct-drive Wind Turbine Generator Revenue (USD Million) by Applications (2018-2022)
8.4 Asia Pacific Permanent Magnet Direct-drive Wind Turbine Generator Revenue (USD Million), and Revenue (USD Million) by Type, and Applications (2018-2022)
8.4.1 Asia Pacific Permanent Magnet Direct-drive Wind Turbine Generator Revenue (USD Million) by Country (2018-2022)
8.4.2 Asia Pacific Permanent Magnet Direct-drive Wind Turbine Generator Revenue (USD Million) by Type (2018-2022)
8.4.3 Asia Pacific Permanent Magnet Direct-drive Wind Turbine Generator Revenue (USD Million) by Applications (2018-2022)
8.5 South America Permanent Magnet Direct-drive Wind Turbine Generator Revenue (USD Million), by Type, and Applications (2018-2022)
8.5.1 South America Permanent Magnet Direct-drive Wind Turbine Generator Revenue (USD Million), by Country (2018-2022)
8.5.2 South America Permanent Magnet Direct-drive Wind Turbine Generator Revenue (USD Million) by Type (2018-2022)
8.5.3 South America Permanent Magnet Direct-drive Wind Turbine Generator Revenue (USD Million) by Applications (2018-2022)
8.6 Middle East and Africa Permanent Magnet Direct-drive Wind Turbine Generator Revenue (USD Million), by Type, Technology, Application, Thickness (2018-2022)
8.6.1 Middle East and Africa Permanent Magnet Direct-drive Wind Turbine Generator Revenue (USD Million) by Country (2018-2022)
8.6.2 Middle East and Africa Permanent Magnet Direct-drive Wind Turbine Generator Revenue (USD Million) by Type (2018-2022)
8.6.3 Middle East and Africa Permanent Magnet Direct-drive Wind Turbine Generator Revenue (USD Million) by Applications (2018-2022)
9 Company Profiles
10 Global Permanent Magnet Direct-drive Wind Turbine Generator Market Revenue (USD Million), by Type, and Applications (2023-2030)
10.1 Global Permanent Magnet Direct-drive Wind Turbine Generator Revenue (USD Million) and Market Share (%) by Type (2023-2030)
10.1.1 Global Permanent Magnet Direct-drive Wind Turbine Generator Revenue (USD Million), and Market Share (%) by Type (2023-2030)
10.2 Global Permanent Magnet Direct-drive Wind Turbine Generator Revenue (USD Million) and Market Share (%) by Applications (2023-2030)
10.2.1 Global Permanent Magnet Direct-drive Wind Turbine Generator Revenue (USD Million), and Market Share (%) by Applications (2023-2030)
11 Global Permanent Magnet Direct-drive Wind Turbine Generator Development Regional Status and Outlook Forecast
11.1 Global Permanent Magnet Direct-drive Wind Turbine Generator Revenue (USD Million) By Regions (2023-2030)
11.2 North America Permanent Magnet Direct-drive Wind Turbine Generator Revenue (USD Million) by Type, and Applications (2023-2030)
11.2.1 North America Permanent Magnet Direct-drive Wind Turbine Generator Revenue (USD) Million by Country (2023-2030)
11.2.2 North America Permanent Magnet Direct-drive Wind Turbine Generator Revenue (USD Million), by Type (2023-2030)
11.2.3 North America Permanent Magnet Direct-drive Wind Turbine Generator Revenue (USD Million), Market Share (%) by Applications (2023-2030)
11.3 Europe Permanent Magnet Direct-drive Wind Turbine Generator Revenue (USD Million), by Type, and Applications (2023-2030)
11.3.1 Europe Permanent Magnet Direct-drive Wind Turbine Generator Revenue (USD Million), by Country (2023-2030)
11.3.2 Europe Permanent Magnet Direct-drive Wind Turbine Generator Revenue (USD Million), by Type (2023-2030)
11.3.3 Europe Permanent Magnet Direct-drive Wind Turbine Generator Revenue (USD Million), by Applications (2023-2030)
11.4 Asia Pacific Permanent Magnet Direct-drive Wind Turbine Generator Revenue (USD Million) by Type, and Applications (2023-2030)
11.4.1 Asia Pacific Permanent Magnet Direct-drive Wind Turbine Generator Revenue (USD Million), by Country (2023-2030)
11.4.2 Asia Pacific Permanent Magnet Direct-drive Wind Turbine Generator Revenue (USD Million), by Type (2023-2030)
11.4.3 Asia Pacific Permanent Magnet Direct-drive Wind Turbine Generator Revenue (USD Million), by Applications (2023-2030)
11.5 South America Permanent Magnet Direct-drive Wind Turbine Generator Revenue (USD Million), by Type, and Applications (2023-2030)
11.5.1 South America Permanent Magnet Direct-drive Wind Turbine Generator Revenue (USD Million), by Country (2023-2030)
11.5.2 South America Permanent Magnet Direct-drive Wind Turbine Generator Revenue (USD Million), by Type (2023-2030)
11.5.3 South America Permanent Magnet Direct-drive Wind Turbine Generator Revenue (USD Million), by Applications (2023-2030)
11.6 Middle East and Africa Permanent Magnet Direct-drive Wind Turbine Generator Revenue (USD Million), by Type, and Applications (2023-2030)
11.6.1 Middle East and Africa Permanent Magnet Direct-drive Wind Turbine Generator Revenue (USD Million), by Region (2023-2030)
11.6.2 Middle East and Africa Permanent Magnet Direct-drive Wind Turbine Generator Revenue (USD Million), by Type (2023-2030)
11.6.3 Middle East and Africa Permanent Magnet Direct-drive Wind Turbine Generator Revenue (USD Million), by Applications (2023-2030)
12 Methodology and Data Sources
12.1 Methodology/Research Approach
12.1.1 Research Programs/Design
12.1.2 Market Size Estimation
12.1.3 Market Breakdown and Data Triangulation
12.2 Data Sources
12.2.1 Secondary Sources
12.2.2 Primary Sources
12.3 Disclaimer
List of Tables
Table 1 Market Segmentation Analysis
Table 2 Global Permanent Magnet Direct-drive Wind Turbine Generator Market Companies with Areas Served
Table 3 Products Offerings Global Permanent Magnet Direct-drive Wind Turbine Generator Market
Table 4 Low Growth Scenario Forecasts
Table 5 Reference Case Growth Scenario
Table 6 High Growth Case Scenario
Table 7 Global Permanent Magnet Direct-drive Wind Turbine Generator Revenue (USD Million) And CAGR (%) By Type (2018-2030)
Table 8 Global Permanent Magnet Direct-drive Wind Turbine Generator Revenue (USD Million) And CAGR (%) By Applications (2018-2030)
Table 9 Global Permanent Magnet Direct-drive Wind Turbine Generator Revenue (USD Million) And CAGR (%) By Regions (2018-2030)
Table 10 Global Permanent Magnet Direct-drive Wind Turbine Generator Revenue (USD Million) By Type (2018-2022)
Table 11 Global Permanent Magnet Direct-drive Wind Turbine Generator Revenue Market Share (%) By Type (2018-2022)
Table 12 Global Permanent Magnet Direct-drive Wind Turbine Generator Revenue (USD Million) By Applications (2018-2022)
Table 13 Global Permanent Magnet Direct-drive Wind Turbine Generator Revenue Market Share (%) By Applications (2018-2022)
Table 14 Global Permanent Magnet Direct-drive Wind Turbine Generator Market Revenue (USD Million) By Regions (2018-2022)
Table 15 Global Permanent Magnet Direct-drive Wind Turbine Generator Market Share (%) By Regions (2018-2022)
Table 16 North America Permanent Magnet Direct-drive Wind Turbine Generator Revenue (USD Million) By Country (2018-2022)
Table 17 North America Permanent Magnet Direct-drive Wind Turbine Generator Revenue (USD Million) By Type (2018-2022)
Table 18 North America Permanent Magnet Direct-drive Wind Turbine Generator Revenue (USD Million) By Applications (2018-2022)
Table 19 Europe Permanent Magnet Direct-drive Wind Turbine Generator Revenue (USD Million) By Country (2018-2022)
Table 20 Europe Permanent Magnet Direct-drive Wind Turbine Generator Revenue (USD Million) By Type (2018-2022)
Table 21 Europe Permanent Magnet Direct-drive Wind Turbine Generator Revenue (USD Million) By Applications (2018-2022)
Table 22 Asia Pacific Permanent Magnet Direct-drive Wind Turbine Generator Revenue (USD Million) By Country (2018-2022)
Table 23 Asia Pacific Permanent Magnet Direct-drive Wind Turbine Generator Revenue (USD Million) By Type (2018-2022)
Table 24 Asia Pacific Permanent Magnet Direct-drive Wind Turbine Generator Revenue (USD Million) By Applications (2018-2022)
Table 25 South America Permanent Magnet Direct-drive Wind Turbine Generator Revenue (USD Million) By Country (2018-2022)
Table 26 South America Permanent Magnet Direct-drive Wind Turbine Generator Revenue (USD Million) By Type (2018-2022)
Table 27 South America Permanent Magnet Direct-drive Wind Turbine Generator Revenue (USD Million) By Applications (2018-2022)
Table 28 Middle East and Africa Permanent Magnet Direct-drive Wind Turbine Generator Revenue (USD Million) By Region (2018-2022)
Table 29 Middle East and Africa Permanent Magnet Direct-drive Wind Turbine Generator Revenue (USD Million) By Type (2018-2022)
Table 30 Middle East and Africa Permanent Magnet Direct-drive Wind Turbine Generator Revenue (USD Million) By Applications (2018-2022)
Table 31 Financial Analysis
Table 32 Global Permanent Magnet Direct-drive Wind Turbine Generator Revenue (USD Million) By Type (2023-2030)
Table 33 Global Permanent Magnet Direct-drive Wind Turbine Generator Revenue Market Share (%) By Type (2023-2030)
Table 34 Global Permanent Magnet Direct-drive Wind Turbine Generator Revenue (USD Million) By Applications (2023-2030)
Table 35 Global Permanent Magnet Direct-drive Wind Turbine Generator Revenue Market Share (%) By Applications (2023-2030)
Table 36 Global Permanent Magnet Direct-drive Wind Turbine Generator Market Revenue (USD Million), And Revenue (USD Million) By Regions (2023-2030)
Table 37 North America Permanent Magnet Direct-drive Wind Turbine Generator Revenue (USD)By Country (2023-2030)
Table 38 North America Permanent Magnet Direct-drive Wind Turbine Generator Revenue (USD Million) By Type (2023-2030)
Table 39 North America Permanent Magnet Direct-drive Wind Turbine Generator Revenue (USD Million) By Applications (2023-2030)
Table 40 Europe Permanent Magnet Direct-drive Wind Turbine Generator Revenue (USD Million) By Country (2023-2030)
Table 41 Europe Permanent Magnet Direct-drive Wind Turbine Generator Revenue (USD Million) By Type (2023-2030)
Table 42 Europe Permanent Magnet Direct-drive Wind Turbine Generator Revenue (USD Million) By Applications (2023-2030)
Table 43 Asia Pacific Permanent Magnet Direct-drive Wind Turbine Generator Revenue (USD Million) By Country (2023-2030)
Table 44 Asia Pacific Permanent Magnet Direct-drive Wind Turbine Generator Revenue (USD Million) By Type (2023-2030)
Table 45 Asia Pacific Permanent Magnet Direct-drive Wind Turbine Generator Revenue (USD Million) By Applications (2023-2030)
Table 46 South America Permanent Magnet Direct-drive Wind Turbine Generator Revenue (USD Million) By Country (2023-2030)
Table 47 South America Permanent Magnet Direct-drive Wind Turbine Generator Revenue (USD Million) By Type (2023-2030)
Table 48 South America Permanent Magnet Direct-drive Wind Turbine Generator Revenue (USD Million) By Applications (2023-2030)
Table 49 Middle East and Africa Permanent Magnet Direct-drive Wind Turbine Generator Revenue (USD Million) By Region (2023-2030)
Table 50 Middle East and Africa Permanent Magnet Direct-drive Wind Turbine Generator Revenue (USD Million) By Region (2023-2030)
Table 51 Middle East and Africa Permanent Magnet Direct-drive Wind Turbine Generator Revenue (USD Million) By Type (2023-2030)
Table 52 Middle East and Africa Permanent Magnet Direct-drive Wind Turbine Generator Revenue (USD Million) By Applications (2023-2030)
Table 53 Research Programs/Design for This Report
Table 54 Key Data Information from Secondary Sources
Table 55 Key Data Information from Primary Sources
List of Figures
Figure 1 Market Scope
Figure 2 Porter’s Five Forces
Figure 3 Global Permanent Magnet Direct-drive Wind Turbine Generator Revenue (USD Million) By Type (2018-2022)
Figure 4 Global Permanent Magnet Direct-drive Wind Turbine Generator Revenue Market Share (%) By Type (2022)
Figure 5 Global Permanent Magnet Direct-drive Wind Turbine Generator Revenue (USD Million) By Applications (2018-2022)
Figure 6 Global Permanent Magnet Direct-drive Wind Turbine Generator Revenue Market Share (%) By Applications (2022)
Figure 7 Global Permanent Magnet Direct-drive Wind Turbine Generator Market Revenue (USD Million) By Regions (2018-2022)
Figure 8 Global Permanent Magnet Direct-drive Wind Turbine Generator Market Share (%) By Regions (2022)
Figure 9 North America Permanent Magnet Direct-drive Wind Turbine Generator Revenue (USD Million) By Country (2018-2022)
Figure 10 North America Permanent Magnet Direct-drive Wind Turbine Generator Revenue (USD Million) By Type (2018-2022)
Figure 11 North America Permanent Magnet Direct-drive Wind Turbine Generator Revenue (USD Million) By Applications (2018-2022)
Figure 12 Europe Permanent Magnet Direct-drive Wind Turbine Generator Revenue (USD Million) By Country (2018-2022)
Figure 13 Europe Permanent Magnet Direct-drive Wind Turbine Generator Revenue (USD Million) By Type (2018-2022)
Figure 14 Europe Permanent Magnet Direct-drive Wind Turbine Generator Revenue (USD Million) By Applications (2018-2022)
Figure 15 Asia Pacific Permanent Magnet Direct-drive Wind Turbine Generator Revenue (USD Million) By Country (2018-2022)
Figure 16 Asia Pacific Permanent Magnet Direct-drive Wind Turbine Generator Revenue (USD Million) By Type (2018-2022)
Figure 17 Asia Pacific Permanent Magnet Direct-drive Wind Turbine Generator Revenue (USD Million) By Applications (2018-2022)
Figure 18 South America Permanent Magnet Direct-drive Wind Turbine Generator Revenue (USD Million) By Country (2018-2022)
Figure 19 South America Permanent Magnet Direct-drive Wind Turbine Generator Revenue (USD Million) By Type (2018-2022)
Figure 20 South America Permanent Magnet Direct-drive Wind Turbine Generator Revenue (USD Million) By Applications (2018-2022)
Figure 21 Middle East and Africa Permanent Magnet Direct-drive Wind Turbine Generator Revenue (USD Million) By Region (2018-2022)
Figure 22 Middle East and Africa Permanent Magnet Direct-drive Wind Turbine Generator Revenue (USD Million) By Type (2018-2022)
Figure 23 Middle East and Africa Permanent Magnet Direct-drive Wind Turbine Generator Revenue (USD Million) By Applications (2018-2022)
Figure 24 Global Permanent Magnet Direct-drive Wind Turbine Generator Revenue (USD Million) By Type (2023-2030)
Figure 25 Global Permanent Magnet Direct-drive Wind Turbine Generator Revenue Market Share (%) By Type (2030)
Figure 26 Global Permanent Magnet Direct-drive Wind Turbine Generator Revenue (USD Million) By Applications (2023-2030)
Figure 27 Global Permanent Magnet Direct-drive Wind Turbine Generator Revenue Market Share (%) By Applications (2030)
Figure 28 Global Permanent Magnet Direct-drive Wind Turbine Generator Market Revenue (USD Million) By Regions (2023-2030)
Figure 29 North America Permanent Magnet Direct-drive Wind Turbine Generator Revenue (USD Million) By Country (2023-2030)
Figure 30 North America Permanent Magnet Direct-drive Wind Turbine Generator Revenue (USD Million) By Type (2023-2030)
Figure 31 North America Permanent Magnet Direct-drive Wind Turbine Generator Revenue (USD Million) By Applications (2023-2030)
Figure 32 Europe Permanent Magnet Direct-drive Wind Turbine Generator Revenue (USD Million) By Country (2023-2030)
Figure 33 Europe Permanent Magnet Direct-drive Wind Turbine Generator Revenue (USD Million) By Type (2023-2030)
Figure 34 Europe Permanent Magnet Direct-drive Wind Turbine Generator Revenue (USD Million) By Applications (2023-2030)
Figure 35 Asia Pacific Permanent Magnet Direct-drive Wind Turbine Generator Revenue (USD Million) By Country (2023-2030)
Figure 36 Asia Pacific Permanent Magnet Direct-drive Wind Turbine Generator Revenue (USD Million) By Type (2023-2030)
Figure 37 Asia Pacific Permanent Magnet Direct-drive Wind Turbine Generator Revenue (USD Million) By Applications (2023-2030)
Figure 38 South America Permanent Magnet Direct-drive Wind Turbine Generator Revenue (USD Million) By Country (2023-2030)
Figure 39 South America Permanent Magnet Direct-drive Wind Turbine Generator Revenue (USD Million) By Type (2023-2030)
Figure 40 South America Permanent Magnet Direct-drive Wind Turbine Generator Revenue (USD Million) By Applications (2023-2030)
Figure 41 Middle East and Africa Permanent Magnet Direct-drive Wind Turbine Generator Revenue (USD Million) By Region (2023-2030)
Figure 42 Middle East and Africa Permanent Magnet Direct-drive Wind Turbine Generator Revenue (USD Million) By Region (2023-2030)
Figure 43 Middle East and Africa Permanent Magnet Direct-drive Wind Turbine Generator Revenue (USD Million) By Type (2023-2030)
Figure 44 Middle East and Africa Permanent Magnet Direct-drive Wind Turbine Generator Revenue (USD Million) By Applications (2023-2030)
Figure 45 Bottom-Up and Top-Down Approaches For This Report
Figure 46 Data Triangulation
By Capacity
By Application
By Region