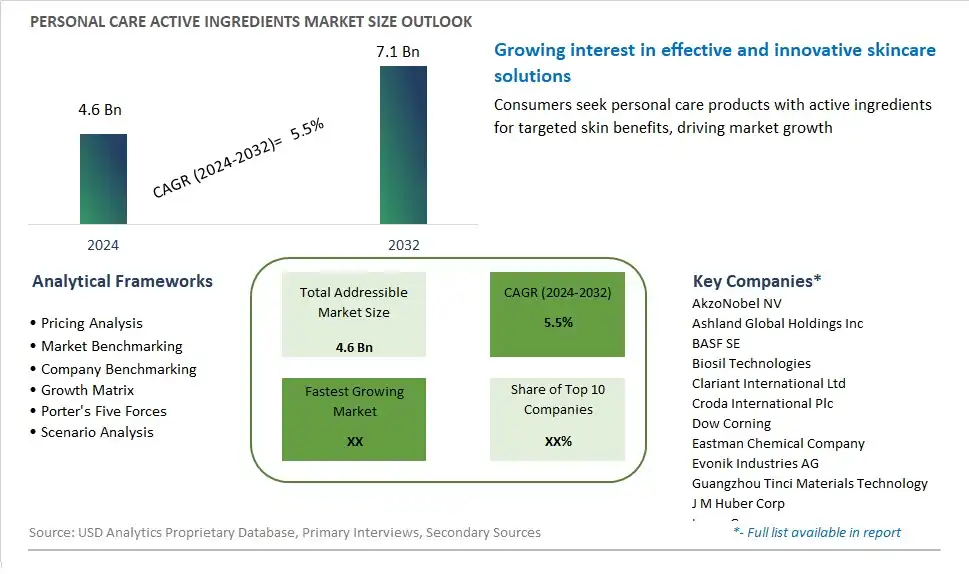
Global Personal Care Active Ingredients Market Size is valued at $4.6 Billion in 2024 and is forecast to register a growth rate (CAGR) of 5.5% to reach $7.1 Billion by 2032.
The global Personal Care Active Ingredients Market Comprehensive Study analyzes and forecasts the market size across 6 regions and 24 countries for diverse segments -By Product (Conditioning Agent, UV Absorber, Anti-Aging), By Application (Men, Women)
An Introduction to Personal Care Active Ingredients Market
The personal care active ingredients market in 2024 is driven by growing consumer demand for products that deliver targeted skincare benefits, from anti-aging and hydration to brightening and acne control. Active ingredients, such as retinol, hyaluronic acid, and vitamin C, are prized for their efficacy in addressing specific skin concerns and promoting overall skin health. With advancements in scientific research and formulation technologies, manufacturers are developing innovative active ingredients that offer superior performance, stability, and compatibility with various skincare formulations. Moreover, as consumers prioritize transparency and sustainability in their beauty routines, there is a rising interest in natural and eco-friendly active ingredients derived from plant extracts, marine sources, and biotechnological processes.
Personal Care Active Ingredients Competitive Landscape
The market report analyses the leading companies in the industry including AkzoNobel NV, Ashland Global Holdings Inc, BASF SE, Biosil Technologies, Clariant International Ltd, Croda International Plc, Dow Corning, Eastman Chemical Company, Evonik Industries AG, Guangzhou Tinci Materials Technology, J M Huber Corp, Lonza Group, Momentive Performance Materials, Royal DSM N.V., Solvay SA, and Others.
Personal Care Active Ingredients Market Dynamics
Personal Care Active Ingredients Market Trend: Growing Demand for Natural and Plant-Based Ingredients
One prominent trend in the personal care active ingredients market is the growing demand for natural and plant-based ingredients. Consumers are increasingly seeking personal care products formulated with ingredients derived from natural sources such as plants, herbs, fruits, and botanical extracts. This trend is driven by rising awareness of the potential health risks associated with synthetic chemicals found in traditional personal care products, as well as growing concerns about environmental sustainability and animal welfare. As a result, there is a shift towards natural alternatives that are perceived to be safer, gentler on the skin, and more environmentally friendly. Manufacturers of personal care active ingredients are responding by developing innovative formulations that harness the power of nature, offering a wide range of botanical extracts, essential oils, and plant-derived actives to meet the evolving needs and preferences of consumers.
Market Driver: Focus on Skincare and Anti-Aging Solutions
A key driver propelling the personal care active ingredients market is the focus on skincare and anti-aging solutions. With the global skincare market experiencing robust growth fueled by increasing beauty consciousness, aging populations, and rising disposable incomes, there is a growing demand for active ingredients that target specific skin concerns and offer anti-aging benefits. Consumers are seeking skincare products that not only cleanse and moisturize but also address issues such as wrinkles, fine lines, hyperpigmentation, and sun damage. This driver is fueled by the desire for youthful-looking skin, the influence of social media and beauty influencers promoting skincare routines, and the availability of advanced skincare technologies and ingredients. Manufacturers of personal care active ingredients have an opportunity to capitalize on this demand by developing innovative formulations that deliver effective and scientifically proven anti-aging benefits, catering to consumers' desire for healthy, radiant, and age-defying skin.
Market Opportunity: Expansion into Clean Beauty and Wellness Products
An opportunity for market expansion in the personal care active ingredients segment lies in the expansion into clean beauty and wellness products. As consumers become more discerning about the ingredients they use on their bodies and the impact of personal care products on their health and well-being, there is a growing demand for clean, non-toxic, and wellness-focused beauty products. Clean beauty products are formulated without potentially harmful ingredients such as parabens, sulfates, phthalates, and synthetic fragrances, while wellness products prioritize holistic approaches to beauty and self-care, emphasizing inner health and outer beauty. Manufacturers of personal care active ingredients can seize this opportunity by developing clean, natural, and sustainable formulations that align with the principles of clean beauty and wellness, offering ingredients that nourish, protect, and enhance the skin and hair without compromising on efficacy or safety. By expanding into clean beauty and wellness products, companies can tap into new consumer segments, differentiate their offerings, and contribute to the growing movement towards safer, healthier, and more sustainable personal care practices.
Personal Care Active Ingredients Market Share Analysis: Anti-Aging held the dominant market share in 2024
In the Personal Care Active Ingredients Market segmented by product, Anti-Aging is the largest segment. This dominance can be attributed to several factors. Firstly, there is a growing global demand for skincare products aimed at combating the signs of aging, driven by an aging population, increasing consumer awareness of skincare routines, and the desire for youthful-looking skin. Anti-aging active ingredients such as retinol, hyaluronic acid, peptides, and antioxidants are widely sought after for their ability to reduce wrinkles, improve skin elasticity, and promote a more youthful complexion. Additionally, advancements in cosmetic science and research have led to the development of innovative anti-aging formulations that target specific skincare concerns, further fueling the demand for anti-aging active ingredients. Further, the beauty industry's focus on wellness and self-care has elevated the importance of skincare as an essential component of personal care routines, driving consumers to seek out products containing effective anti-aging ingredients. As a result of their effectiveness and consumer demand, anti-aging active ingredients emerge as the largest segment in the Personal Care Active Ingredients Market.
Personal Care Active Ingredients Market Share Analysis: Men market is poised to register the fastest growth rae over the forecast period to 2032
Among the segmented applications in the Personal Care Active Ingredients Market, the Men segment is the fastest-growing segment. This growth is propelled by several factors. Firstly, there is a rising trend of men taking an active interest in personal grooming and skincare, driven by changing societal norms, increased media exposure, and the influence of celebrities and social media influencers. Men are becoming more aware of the importance of skincare and grooming routines for maintaining healthy and youthful-looking skin. Additionally, the beauty industry has responded to this trend by developing a wide range of skincare products specifically tailored to men's needs, including cleansers, moisturizers, serums, and grooming products containing active ingredients targeted at addressing common skincare concerns such as acne, aging, and sensitivity. Further, the increasing availability and accessibility of men's skincare products through various retail channels, including online platforms and specialty stores, further contribute to the segment's growth. As men continue to prioritize personal grooming and skincare, the demand for active ingredients in men's personal care products is expected to continue growing rapidly, solidifying the Men segment as the fastest-growing segment in the Personal Care Active Ingredients Market.
Personal Care Active Ingredients Market Segmentation
By Product
Conditioning Agent
UV Absorber
Anti-Aging
By Application
Men
Women
Countries Analyzed
North America (US, Canada, Mexico)
Europe (Germany, UK, France, Spain, Italy, Russia, Rest of Europe)
Asia Pacific (China, India, Japan, South Korea, Australia, South East Asia, Rest of Asia)
South America (Brazil, Argentina, Rest of South America)
Middle East and Africa (Saudi Arabia, UAE, Rest of Middle East, South Africa, Egypt, Rest of Africa)
Personal Care Active Ingredients Companies Profiled in the Study
AkzoNobel NV
Ashland Global Holdings Inc
BASF SE
Biosil Technologies
Clariant International Ltd
Croda International Plc
Dow Corning
Eastman Chemical Company
Evonik Industries AG
Guangzhou Tinci Materials Technology
J M Huber Corp
Lonza Group
Momentive Performance Materials
Royal DSM N.V.
Solvay SA
*- List Not Exhaustive
Chapter 1. TABLE OF CONTENTS
Chapter 2. Introduction to Personal Care Active Ingredients Market
2.1. Market Overview
2.2. Key Statistics and Report Highlights
2.3. Scope of the Comprehensive Study
2.3.1. Market Definition
2.3.2 Countries and Regions Covered
2.3.3 Research Objective
2.3.4 Units, Currency, and Conversions
2.3.5 Industry Value Chain
2.4. Key Market Segments
2.5. Key Companies
2.6. Study Period
Chapter 3. Strategic Analysis Review
3.1. Personal Care Active Ingredients Pricing Analysis and Forecast
3.2. Porter’s Five Forces
3.3. Market Ecosystem
3.4. SWOT Analysis
3.5. Regulatory Scenario
3.3. Effects of Inflation, Russia-Ukraine War, moderating economic growth, and other macroeconomic factors
Chapter 4. Competitive Landscape
4.1. Market Share Analysis
4.1.1. Global Personal Care Active Ingredients Market Share by Company, 2023
4.1.2. Product Offerings of Leading Personal Care Active Ingredients Companies
4.2. Market Entropy
4.2.1. New Product Launches in the Industry
4.2.2. Mergers, Acquisitions, Joint ventures, and Partnerships
4.3. Key Strategies and Best Practices
Chapter 5. Global Market Projections: Best, Reference, and Low Case Scenarios
5.1. Growth Analysis- Case Scenario Definitions
5.2. Low Growth Case Scenario Forecasts
5.3. Reference Growth Case Scenario Forecasts
5.4. High Growth Case Scenario Forecasts
Chapter 6. Market Dynamics
6.1. Personal Care Active Ingredients Market Drivers
6.2. Personal Care Active Ingredients Market Challenges
6.6. Personal Care Active Ingredients Market Opportunities
6.4. Personal Care Active Ingredients Market Trends
Chapter 7. Global Personal Care Active Ingredients Market Outlook Trends
7.1. Global Personal Care Active Ingredients Revenue (USD Million) and CAGR (%) by Type (2021-2032)
7.2. Global Personal Care Active Ingredients Revenue (USD Million) and CAGR (%) by Application (2021-2032)
7.3. Global Personal Care Active Ingredients Revenue (USD Million) and CAGR (%) by Product (2021-2032)
By Product
Conditioning Agent
UV Absorber
Anti-Aging
By Application
Men
Women
Chapter 8. Global Personal Care Active Ingredients Regional Analysis and Outlook
8.1. Global Personal Care Active Ingredients Revenue (USD Million) By Regions (2021- 2032)
8.2. North America Personal Care Active Ingredients Revenue (USD Million) by Country (2021-2032)
8.2.1. United States Personal Care Active Ingredients Regional Analysis and Outlook
8.2.2. Canada Personal Care Active Ingredients Regional Analysis and Outlook
8.2.3. Mexico Personal Care Active Ingredients Regional Analysis and Outlook
8.3. Europe Personal Care Active Ingredients Revenue (USD Million), by Country (2021-2032)
8.3.1. Germany Personal Care Active Ingredients Regional Analysis and Outlook
8.3.2. France Personal Care Active Ingredients Regional Analysis and Outlook
8.3.3. United Kingdom Personal Care Active Ingredients Regional Analysis and Outlook
8.3.4. Spain Personal Care Active Ingredients Regional Analysis and Outlook
8.3.5. Italy Personal Care Active Ingredients Regional Analysis and Outlook
8.3.6. Russia Personal Care Active Ingredients Regional Analysis and Outlook
8.3.7. Rest of Europe Personal Care Active Ingredients Regional Analysis and Outlook
8.4. Asia Pacific Personal Care Active Ingredients Revenue (USD Million) by Country (2021-2032)
8.4.1. China Personal Care Active Ingredients Regional Analysis and Outlook
8.4.2. Japan Personal Care Active Ingredients Regional Analysis and Outlook
8.4.3. India Personal Care Active Ingredients Regional Analysis and Outlook
8.4.4. South Korea Personal Care Active Ingredients Regional Analysis and Outlook
8.4.5. Australia Personal Care Active Ingredients Regional Analysis and Outlook
8.4.6. South East Asia Personal Care Active Ingredients Regional Analysis and Outlook
8.4.7. Rest of Asia Pacific Personal Care Active Ingredients Regional Analysis and Outlook
8.5. South America Personal Care Active Ingredients Revenue (USD Million), by Country (2021-2032)
8.5.1. Brazil Personal Care Active Ingredients Regional Analysis and Outlook
8.5.2. Argentina Personal Care Active Ingredients Regional Analysis and Outlook
8.5.3. Rest of South America Personal Care Active Ingredients Regional Analysis and Outlook
8.6. Middle East and Africa Personal Care Active Ingredients Revenue (USD Million) by Country (2021-2032)
8.6.1. Middle East Personal Care Active Ingredients Regional Analysis and Outlook
8.6.2. Africa Personal Care Active Ingredients Regional Analysis and Outlook
Chapter 9. North America Personal Care Active Ingredients Analysis and Outlook
9.1. North America Personal Care Active Ingredients Revenue (USD Million) by Segments (2021-2032)
9.1.1. North America Personal Care Active Ingredients Revenue (USD Million) by Type (2021-2032)
9.1.2. North America Personal Care Active Ingredients Revenue (USD Million) by Application (2021-2032)
9.1.3. North America Personal Care Active Ingredients Revenue (USD Million) by Product (2021-2032)
By Product
Conditioning Agent
UV Absorber
Anti-Aging
By Application
Men
Women
Chapter 10. Europe Personal Care Active Ingredients Analysis and Outlook
10.1. Europe Personal Care Active Ingredients Revenue (USD Million), by Segments (USD Million) (2021-2032)
10.1.1. Europe Personal Care Active Ingredients Revenue (USD Million) by Type (2021-2032)
10.1.2. Europe Personal Care Active Ingredients Revenue (USD Million) by Application (2021-2032)
10.1.3. Europe Personal Care Active Ingredients Revenue (USD Million) by Product (2021-2032)
By Product
Conditioning Agent
UV Absorber
Anti-Aging
By Application
Men
Women
Chapter 11. Asia Pacific Personal Care Active Ingredients Analysis and Outlook
11.1. Asia Pacific Personal Care Active Ingredients Revenue (USD Million), and Revenue (USD Million) by Segments (2021-2032)
11.1.1. Asia Pacific Personal Care Active Ingredients Revenue (USD Million) by Type (2021-2032)
11.1.2. Asia Pacific Personal Care Active Ingredients Revenue (USD Million) by Application (2021-2032)
11.1.3. Asia Pacific Personal Care Active Ingredients Revenue (USD Million) by Product (2021-2032)
By Product
Conditioning Agent
UV Absorber
Anti-Aging
By Application
Men
Women
Chapter 12. South America Personal Care Active Ingredients Analysis and Outlook
12.1. South America Personal Care Active Ingredients Revenue (USD Million), by Segments (2021-2032)
12.1.1. South America Personal Care Active Ingredients Revenue (USD Million) by Type (2021-2032)
12.1.2. South America Personal Care Active Ingredients Revenue (USD Million) by Application (2021-2032)
12.1.3. South America Personal Care Active Ingredients Revenue (USD Million) by Product (2021-2032)
By Product
Conditioning Agent
UV Absorber
Anti-Aging
By Application
Men
Women
Chapter 13. Middle East and Africa Personal Care Active Ingredients Analysis and Outlook
13.1. Middle East and Africa Personal Care Active Ingredients Revenue (USD Million), by Segments (2021-2032)
13.1.1. Middle East and Africa Personal Care Active Ingredients Revenue (USD Million) by Type (2021-2032)
13.1.2. Middle East and Africa Personal Care Active Ingredients Revenue (USD Million) by Application (2021-2032)
13.1.3. Middle East and Africa Personal Care Active Ingredients Revenue (USD Million) by Product (2021-2032)
By Product
Conditioning Agent
UV Absorber
Anti-Aging
By Application
Men
Women
Chapter 14. Personal Care Active Ingredients Company Profiles
14.1 Business Overview
14.2 Product Profiles
14.3 SWOT Profiles
14.5 Recent Developments
14.6 Financial Profile
List of Companies
AkzoNobel NV
Ashland Global Holdings Inc
BASF SE
Biosil Technologies
Clariant International Ltd
Croda International Plc
Dow Corning
Eastman Chemical Company
Evonik Industries AG
Guangzhou Tinci Materials Technology
J M Huber Corp
Lonza Group
Momentive Performance Materials
Royal DSM N.V.
Solvay SA
15. Methodology and Data Sources
15.1 Customization Offerings
15.2 Subscription Services
15.3 Related Reports
15.4 Publisher Expertise
LIST OF TABLES
Table 1 Market Segmentation Analysis
Table 2 Global Personal Care Active Ingredients Market Share of Leading Companies, 2023
Table 3 Product Offerings of Leading Companies
Table 4 Low Growth Scenario Forecasts
Table 5 Reference Case Growth Scenario
Table 6 High Growth Case Scenario
Table 7 Global Personal Care Active Ingredients Revenue (USD Million) And CAGR (%) By Type (2021-2032)
Table 8 Global Personal Care Active Ingredients Revenue (USD Million) And CAGR (%) By Application (2021-2032)
Table 9 Global Personal Care Active Ingredients Revenue (USD Million) And CAGR (%) By Product (2021-2032)
Table 10 Global Personal Care Active Ingredients Market Revenue (USD Million) By Regions (2021-2032)
Table 11 Global Personal Care Active Ingredients Market Share (%) By Regions (2021-2032)
Table 12 North America Personal Care Active Ingredients Revenue (USD Million) By Country (2021-2032)
Table 13 Europe Personal Care Active Ingredients Revenue (USD Million) By Country (2021-2032)
Table 14 Asia Pacific Personal Care Active Ingredients Revenue (USD Million) By Country (2021-2032)
Table 15 South America Personal Care Active Ingredients Revenue (USD Million) By Country (2021-2032)
Table 16 Middle East and Africa Personal Care Active Ingredients Revenue (USD Million) By Region (2021-2032)
Table 17 North America Personal Care Active Ingredients Revenue (USD Million) By Type (2021-2032)
Table 18 North America Personal Care Active Ingredients Revenue (USD Million) By Application (2021-2032)
Table 19 North America Personal Care Active Ingredients Revenue (USD Million) By Product (2021-2032)
Table 20 Europe Personal Care Active Ingredients Revenue (USD Million) By Type (2021-2032)
Table 21 Europe Personal Care Active Ingredients Revenue (USD Million) By Application (2021-2032)
Table 22 Europe Personal Care Active Ingredients Revenue (USD Million) By Product (2021-2032)
Table 23 Asia Pacific Personal Care Active Ingredients Revenue (USD Million) By Type (2021-2032)
Table 24 Asia Pacific Personal Care Active Ingredients Revenue (USD Million) By Application (2021-2032)
Table 25 Asia Pacific Personal Care Active Ingredients Revenue (USD Million) By Product (2021-2032)
Table 26 South America Personal Care Active Ingredients Revenue (USD Million) By Type (2021-2032)
Table 27 South America Personal Care Active Ingredients Revenue (USD Million) By Application (2021-2032)
Table 28 South America Personal Care Active Ingredients Revenue (USD Million) By Product (2021-2032)
Table 29 Middle East and Africa Personal Care Active Ingredients Revenue (USD Million) By Type (2021-2032)
Table 30 Middle East and Africa Personal Care Active Ingredients Revenue (USD Million) By Application (2021-2032)
Table 31 Middle East and Africa Personal Care Active Ingredients Revenue (USD Million) By Product (2021-2032)
LIST OF FIGURES
Figure 1. Market Scope
Figure 2. Pricing Forecasts Per Unit, 2023- 2032
Figure 3. Porter’s Five Forces
Figure 4. Global Personal Care Active Ingredients Market Revenue (USD Million) By Regions (2021-2032)
Figure 5. Global Personal Care Active Ingredients Market Share (%) By Regions (2023)
Figure 6. North America Personal Care Active Ingredients Revenue (USD Million) By Country (2021-2032)
Figure 7. United States Personal Care Active Ingredients Revenue (USD Million) By Country (2021-2032)
Figure 8. Canada Personal Care Active Ingredients Revenue (USD Million) By Country (2021-2032)
Figure 9. Mexico Personal Care Active Ingredients Revenue (USD Million) By Country (2021-2032)
Figure 10. Europe Personal Care Active Ingredients Revenue (USD Million) By Country (2021-2032)
Figure 11. Germany Personal Care Active Ingredients Revenue (USD Million) By Country (2021-2032)
Figure 12. France Personal Care Active Ingredients Revenue (USD Million) By Country (2021-2032)
Figure 13. United Kingdom Personal Care Active Ingredients Revenue (USD Million) By Country (2021-2032)
Figure 14. Spain Personal Care Active Ingredients Revenue (USD Million) By Country (2021-2032)
Figure 15. Italy Personal Care Active Ingredients Revenue (USD Million) By Country (2021-2032)
Figure 16. Russia Personal Care Active Ingredients Revenue (USD Million) By Country (2021-2032)
Figure 17. Rest of Europe Personal Care Active Ingredients Revenue (USD Million) By Country (2021-2032)
Figure 11. Asia Pacific Personal Care Active Ingredients Revenue (USD Million) By Country (2021-2032)
Figure 12. China Personal Care Active Ingredients Revenue (USD Million) By Country (2021-2032)
Figure 13. Japan Personal Care Active Ingredients Revenue (USD Million) By Country (2021-2032)
Figure 14. India Personal Care Active Ingredients Revenue (USD Million) By Country (2021-2032)
Figure 15. South Korea Personal Care Active Ingredients Revenue (USD Million) By Country (2021-2032)
Figure 16. Australia Personal Care Active Ingredients Revenue (USD Million) By Country (2021-2032)
Figure 17. South East Asia Personal Care Active Ingredients Revenue (USD Million) By Country (2021-2032)
Figure 18. South America Personal Care Active Ingredients Revenue (USD Million) By Country (2021-2032)
Figure 19. Brazil Personal Care Active Ingredients Revenue (USD Million) By Country (2021-2032)
Figure 20. Argentina Personal Care Active Ingredients Revenue (USD Million) By Country (2021-2032)
Figure 21. Rest of Asia Pacific Personal Care Active Ingredients Revenue (USD Million) By Country (2021-2032)
Figure 22. Middle East and Africa Personal Care Active Ingredients Revenue (USD Million) By Region (2021-2032)
Figure 23. Saudi Arabia Personal Care Active Ingredients Revenue (USD Million) By Region (2021-2032)
Figure 24. The UAE Personal Care Active Ingredients Revenue (USD Million) By Region (2021-2032)
Figure 25. Rest of Middle East Personal Care Active Ingredients Revenue (USD Million) By Region (2021-2032)
Figure 26. South Africa Personal Care Active Ingredients Revenue (USD Million) By Region (2021-2032)
Figure 27. Africa Personal Care Active Ingredients Revenue (USD Million) By Region (2021-2032)
Figure 28. North America Personal Care Active Ingredients Revenue (USD Million) By Type (2021-2032)
Figure 29. North America Personal Care Active Ingredients Revenue (USD Million) By Application (2021-2032)
Figure 30. North America Personal Care Active Ingredients Revenue (USD Million) By Product (2021-2032)
Figure 31. Europe Personal Care Active Ingredients Revenue (USD Million) By Type (2021-2032)
Figure 32. Europe Personal Care Active Ingredients Revenue (USD Million) By Application (2021-2032)
Figure 33. Europe Personal Care Active Ingredients Revenue (USD Million) By Product (2021-2032)
Figure 34. Asia Pacific Personal Care Active Ingredients Revenue (USD Million) By Type (2021-2032)
Figure 35. Asia Pacific Personal Care Active Ingredients Revenue (USD Million) By Application (2021-2032)
Figure 36. Asia Pacific Personal Care Active Ingredients Revenue (USD Million) By Product (2021-2032)
Figure 37. South America Personal Care Active Ingredients Revenue (USD Million) By Type (2021-2032)
Figure 38. South America Personal Care Active Ingredients Revenue (USD Million) By Application (2021-2032)
Figure 39. South America Personal Care Active Ingredients Revenue (USD Million) By Product (2021-2032)
Figure 40. Middle East and Africa Personal Care Active Ingredients Revenue (USD Million) By Type (2021-2032)
Figure 41. Middle East and Africa Personal Care Active Ingredients Revenue (USD Million) By Application (2021-2032)
Figure 42. Middle East and Africa Personal Care Active Ingredients Revenue (USD Million) By Product (2021-2032)
By Product
Conditioning Agent
UV Absorber
Anti-Aging
By Application
Men
Women
Countries Analyzed
North America (US, Canada, Mexico)
Europe (Germany, UK, France, Spain, Italy, Russia, Rest of Europe)
Asia Pacific (China, India, Japan, South Korea, Australia, South East Asia, Rest of Asia)
South America (Brazil, Argentina, Rest of South America)
Middle East and Africa (Saudi Arabia, UAE, Rest of Middle East, South Africa, Egypt, Rest of Africa)
