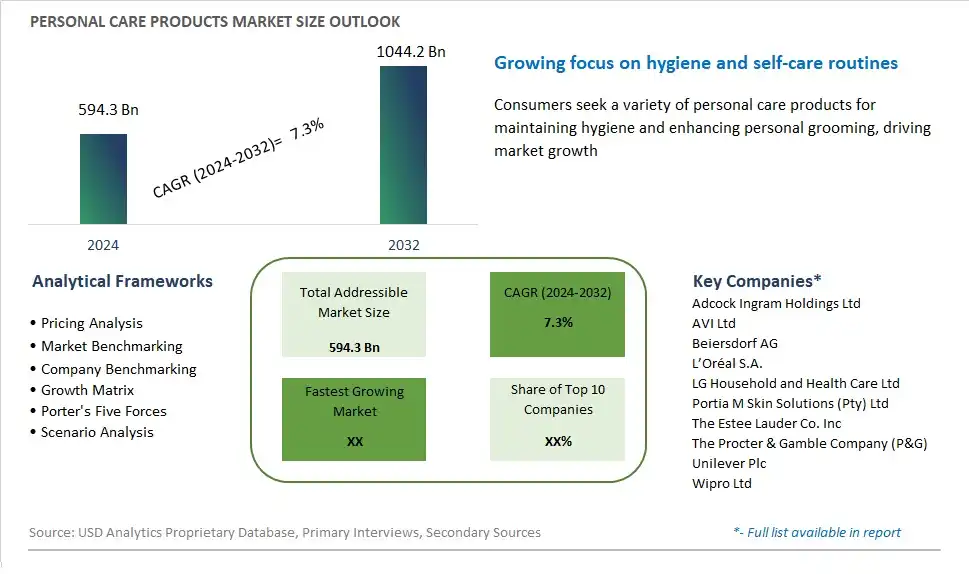
Global Personal Care Products Market Size is valued at $594.3 Billion in 2024 and is forecast to register a growth rate (CAGR) of 7.3% to reach $1044.2 Billion by 2032.
The global Personal Care Products Market Comprehensive Study analyzes and forecasts the market size across 6 regions and 24 countries for diverse segments -By Product (Skincare Products, Haircare Products, Color Cosmetics, Oral Care Products, Others), By Distribution Channel (Offline, Online)
An Introduction to Personal Care Products Market
The personal care products market in 2024 is shaped by evolving consumer preferences, technological advancements, and changing lifestyle trends. Personal care products, including skincare, haircare, oral care, and hygiene essentials, play a fundamental role in daily grooming routines and self-care rituals. With a growing emphasis on holistic wellness, clean ingredients, and personalized solutions, consumers are seeking products that cater to their specific needs, concerns, and values. Brands are responding with innovative formulations, customizable options, and multifunctional products that offer convenience, efficacy, and sensory pleasure. Furthermore, the rise of e-commerce platforms, subscription services, and social media marketing enables brands to engage directly with consumers, gather feedback, and adapt quickly to emerging trends, driving continuous innovation and competitiveness in the market.
Personal Care Products Competitive Landscape
The market report analyses the leading companies in the industry including Adcock Ingram Holdings Ltd, AVI Ltd, Beiersdorf AG, L’Oréal S.A., LG Household and Health Care Ltd, Portia M Skin Solutions (Pty) Ltd, The Estee Lauder Co. Inc, The Procter & Gamble Company (P&G), Unilever Plc, Wipro Ltd, and Others.
Personal Care Products Market Dynamics
Personal Care Products Market Trend: Rise of Clean Beauty and Natural Products
One prominent trend in the personal care products market is the rise of clean beauty and natural products. Consumers are increasingly prioritizing products that are free from harmful chemicals, synthetic fragrances, and artificial additives, and instead, opting for formulations that contain natural and organic ingredients. This trend is driven by growing concerns about the potential health risks associated with certain synthetic chemicals used in personal care products, as well as a desire for safer, more environmentally friendly alternatives. As a result, there is a growing demand for clean beauty brands and natural skincare, haircare, and body care products that promote overall health and well-being while minimizing environmental impact.
Market Driver: Increasing Focus on Self-Care and Wellness
A key driver propelling the personal care products market is the increasing focus on self-care and wellness. With rising stress levels, hectic lifestyles, and heightened awareness of mental health issues, consumers are seeking products and experiences that help them relax, unwind, and prioritize self-care. Personal care products such as bath and shower products, skincare treatments, aromatherapy products, and relaxation aids play a vital role in promoting self-care rituals and enhancing overall well-being. This driver is fueled by the growing trend of self-care as a form of stress management and self-expression, as well as the influence of social media, wellness influencers, and lifestyle bloggers promoting holistic approaches to health and wellness. As consumers prioritize self-care and invest in products that support their physical, mental, and emotional well-being, there is a significant opportunity for personal care brands to innovate and offer products that cater to these needs.
Market Opportunity: Expansion into Gender-Neutral and Inclusive Products
An opportunity for market expansion in the personal care products segment lies in the expansion into gender-neutral and inclusive products. With changing societal norms and evolving attitudes towards gender identity and expression, there is a growing demand for personal care products that are inclusive and cater to diverse needs and preferences. Personal care brands have an opportunity to capitalize on this trend by developing gender-neutral formulations and packaging designs that appeal to a broad spectrum of consumers, regardless of gender or identity. Additionally, there is room for innovation in product development to address the specific needs of underrepresented groups such as transgender individuals, non-binary individuals, and people with disabilities. By embracing inclusivity and diversity in their product offerings, personal care brands can tap into new consumer segments, foster a sense of belonging and acceptance, and contribute to positive social change within the industry.
Personal Care Products Market Share Analysis: Skincare Products held the dominant market share in 2024
Skincare products represent the largest segment in the personal care products market. This dominance is driven by increasing consumer awareness about the importance of maintaining healthy skin, which is often considered a reflection of overall wellness and attractiveness. The segment encompasses a wide range of products, including moisturizers, anti-aging creams, sunscreens, cleansers, and serums, catering to various skin concerns and types. The rising popularity of skincare routines, fueled by beauty influencers and social media platforms, has significantly boosted product demand. Additionally, advancements in skincare formulations, including the incorporation of natural and organic ingredients, have attracted a broad customer base seeking safe and effective solutions. The growing emphasis on sun protection and anti-aging benefits further propels the market, with consumers investing more in premium and specialized skincare products. As a result, the skincare segment continues to expand, outpacing other product categories within the personal care market.
Personal Care Products Market Share Analysis: Online market is poised to register the fastest growth rae over the forecast period to 2032
The online distribution channel is the fastest-growing segment in the personal care products market. This surge is primarily due to the increasing penetration of the internet and the growing popularity of e-commerce platforms. Consumers are drawn to the convenience of shopping from home, the ability to compare prices easily, and the wide range of products available online. Additionally, online platforms often offer detailed product descriptions, reviews, and personalized recommendations, enhancing the shopping experience. The COVID-19 pandemic further accelerated the shift towards online shopping as consumers avoided physical stores. With the rise of mobile commerce and social media marketing, brands are investing heavily in their online presence, leveraging targeted advertising and influencer partnerships to reach a broader audience. As digital payment methods and delivery logistics improve, the online segment is expected to continue its rapid expansion, reshaping the landscape of personal care product distribution.
Personal Care Products Market Segmentation
By Product
Skincare Products
Haircare Products
Color Cosmetics
Oral Care Products
Others
By Distribution Channel
Offline
Online
Countries Analyzed
North America (US, Canada, Mexico)
Europe (Germany, UK, France, Spain, Italy, Russia, Rest of Europe)
Asia Pacific (China, India, Japan, South Korea, Australia, South East Asia, Rest of Asia)
South America (Brazil, Argentina, Rest of South America)
Middle East and Africa (Saudi Arabia, UAE, Rest of Middle East, South Africa, Egypt, Rest of Africa)
Personal Care Products Companies Profiled in the Study
Adcock Ingram Holdings Ltd
AVI Ltd
Beiersdorf AG
L’Oréal S.A.
LG Household and Health Care Ltd
Portia M Skin Solutions (Pty) Ltd
The Estee Lauder Co. Inc
The Procter & Gamble Company (P&G)
Unilever Plc
Wipro Ltd
*- List Not Exhaustive
Chapter 1. TABLE OF CONTENTS
Chapter 2. Introduction to Personal Care Products Market
2.1. Market Overview
2.2. Key Statistics and Report Highlights
2.3. Scope of the Comprehensive Study
2.3.1. Market Definition
2.3.2 Countries and Regions Covered
2.3.3 Research Objective
2.3.4 Units, Currency, and Conversions
2.3.5 Industry Value Chain
2.4. Key Market Segments
2.5. Key Companies
2.6. Study Period
Chapter 3. Strategic Analysis Review
3.1. Personal Care Products Pricing Analysis and Forecast
3.2. Porter’s Five Forces
3.3. Market Ecosystem
3.4. SWOT Analysis
3.5. Regulatory Scenario
3.3. Effects of Inflation, Russia-Ukraine War, moderating economic growth, and other macroeconomic factors
Chapter 4. Competitive Landscape
4.1. Market Share Analysis
4.1.1. Global Personal Care Products Market Share by Company, 2023
4.1.2. Product Offerings of Leading Personal Care Products Companies
4.2. Market Entropy
4.2.1. New Product Launches in the Industry
4.2.2. Mergers, Acquisitions, Joint ventures, and Partnerships
4.3. Key Strategies and Best Practices
Chapter 5. Global Market Projections: Best, Reference, and Low Case Scenarios
5.1. Growth Analysis- Case Scenario Definitions
5.2. Low Growth Case Scenario Forecasts
5.3. Reference Growth Case Scenario Forecasts
5.4. High Growth Case Scenario Forecasts
Chapter 6. Market Dynamics
6.1. Personal Care Products Market Drivers
6.2. Personal Care Products Market Challenges
6.6. Personal Care Products Market Opportunities
6.4. Personal Care Products Market Trends
Chapter 7. Global Personal Care Products Market Outlook Trends
7.1. Global Personal Care Products Revenue (USD Million) and CAGR (%) by Type (2021-2032)
7.2. Global Personal Care Products Revenue (USD Million) and CAGR (%) by Application (2021-2032)
7.3. Global Personal Care Products Revenue (USD Million) and CAGR (%) by Product (2021-2032)
By Product
Skincare Products
Haircare Products
Color Cosmetics
Oral Care Products
Others
By Distribution Channel
Offline
Online
Chapter 8. Global Personal Care Products Regional Analysis and Outlook
8.1. Global Personal Care Products Revenue (USD Million) By Regions (2021- 2032)
8.2. North America Personal Care Products Revenue (USD Million) by Country (2021-2032)
8.2.1. United States Personal Care Products Regional Analysis and Outlook
8.2.2. Canada Personal Care Products Regional Analysis and Outlook
8.2.3. Mexico Personal Care Products Regional Analysis and Outlook
8.3. Europe Personal Care Products Revenue (USD Million), by Country (2021-2032)
8.3.1. Germany Personal Care Products Regional Analysis and Outlook
8.3.2. France Personal Care Products Regional Analysis and Outlook
8.3.3. United Kingdom Personal Care Products Regional Analysis and Outlook
8.3.4. Spain Personal Care Products Regional Analysis and Outlook
8.3.5. Italy Personal Care Products Regional Analysis and Outlook
8.3.6. Russia Personal Care Products Regional Analysis and Outlook
8.3.7. Rest of Europe Personal Care Products Regional Analysis and Outlook
8.4. Asia Pacific Personal Care Products Revenue (USD Million) by Country (2021-2032)
8.4.1. China Personal Care Products Regional Analysis and Outlook
8.4.2. Japan Personal Care Products Regional Analysis and Outlook
8.4.3. India Personal Care Products Regional Analysis and Outlook
8.4.4. South Korea Personal Care Products Regional Analysis and Outlook
8.4.5. Australia Personal Care Products Regional Analysis and Outlook
8.4.6. South East Asia Personal Care Products Regional Analysis and Outlook
8.4.7. Rest of Asia Pacific Personal Care Products Regional Analysis and Outlook
8.5. South America Personal Care Products Revenue (USD Million), by Country (2021-2032)
8.5.1. Brazil Personal Care Products Regional Analysis and Outlook
8.5.2. Argentina Personal Care Products Regional Analysis and Outlook
8.5.3. Rest of South America Personal Care Products Regional Analysis and Outlook
8.6. Middle East and Africa Personal Care Products Revenue (USD Million) by Country (2021-2032)
8.6.1. Middle East Personal Care Products Regional Analysis and Outlook
8.6.2. Africa Personal Care Products Regional Analysis and Outlook
Chapter 9. North America Personal Care Products Analysis and Outlook
9.1. North America Personal Care Products Revenue (USD Million) by Segments (2021-2032)
9.1.1. North America Personal Care Products Revenue (USD Million) by Type (2021-2032)
9.1.2. North America Personal Care Products Revenue (USD Million) by Application (2021-2032)
9.1.3. North America Personal Care Products Revenue (USD Million) by Product (2021-2032)
By Product
Skincare Products
Haircare Products
Color Cosmetics
Oral Care Products
Others
By Distribution Channel
Offline
Online
Chapter 10. Europe Personal Care Products Analysis and Outlook
10.1. Europe Personal Care Products Revenue (USD Million), by Segments (USD Million) (2021-2032)
10.1.1. Europe Personal Care Products Revenue (USD Million) by Type (2021-2032)
10.1.2. Europe Personal Care Products Revenue (USD Million) by Application (2021-2032)
10.1.3. Europe Personal Care Products Revenue (USD Million) by Product (2021-2032)
By Product
Skincare Products
Haircare Products
Color Cosmetics
Oral Care Products
Others
By Distribution Channel
Offline
Online
Chapter 11. Asia Pacific Personal Care Products Analysis and Outlook
11.1. Asia Pacific Personal Care Products Revenue (USD Million), and Revenue (USD Million) by Segments (2021-2032)
11.1.1. Asia Pacific Personal Care Products Revenue (USD Million) by Type (2021-2032)
11.1.2. Asia Pacific Personal Care Products Revenue (USD Million) by Application (2021-2032)
11.1.3. Asia Pacific Personal Care Products Revenue (USD Million) by Product (2021-2032)
By Product
Skincare Products
Haircare Products
Color Cosmetics
Oral Care Products
Others
By Distribution Channel
Offline
Online
Chapter 12. South America Personal Care Products Analysis and Outlook
12.1. South America Personal Care Products Revenue (USD Million), by Segments (2021-2032)
12.1.1. South America Personal Care Products Revenue (USD Million) by Type (2021-2032)
12.1.2. South America Personal Care Products Revenue (USD Million) by Application (2021-2032)
12.1.3. South America Personal Care Products Revenue (USD Million) by Product (2021-2032)
By Product
Skincare Products
Haircare Products
Color Cosmetics
Oral Care Products
Others
By Distribution Channel
Offline
Online
Chapter 13. Middle East and Africa Personal Care Products Analysis and Outlook
13.1. Middle East and Africa Personal Care Products Revenue (USD Million), by Segments (2021-2032)
13.1.1. Middle East and Africa Personal Care Products Revenue (USD Million) by Type (2021-2032)
13.1.2. Middle East and Africa Personal Care Products Revenue (USD Million) by Application (2021-2032)
13.1.3. Middle East and Africa Personal Care Products Revenue (USD Million) by Product (2021-2032)
By Product
Skincare Products
Haircare Products
Color Cosmetics
Oral Care Products
Others
By Distribution Channel
Offline
Online
Chapter 14. Personal Care Products Company Profiles
14.1 Business Overview
14.2 Product Profiles
14.3 SWOT Profiles
14.5 Recent Developments
14.6 Financial Profile
List of Companies
Adcock Ingram Holdings Ltd
AVI Ltd
Beiersdorf AG
L’Oréal S.A.
LG Household and Health Care Ltd
Portia M Skin Solutions (Pty) Ltd
The Estee Lauder Co. Inc
The Procter & Gamble Company (P&G)
Unilever Plc
Wipro Ltd
15. Methodology and Data Sources
15.1 Customization Offerings
15.2 Subscription Services
15.3 Related Reports
15.4 Publisher Expertise
LIST OF TABLES
Table 1 Market Segmentation Analysis
Table 2 Global Personal Care Products Market Share of Leading Companies, 2023
Table 3 Product Offerings of Leading Companies
Table 4 Low Growth Scenario Forecasts
Table 5 Reference Case Growth Scenario
Table 6 High Growth Case Scenario
Table 7 Global Personal Care Products Revenue (USD Million) And CAGR (%) By Type (2021-2032)
Table 8 Global Personal Care Products Revenue (USD Million) And CAGR (%) By Application (2021-2032)
Table 9 Global Personal Care Products Revenue (USD Million) And CAGR (%) By Product (2021-2032)
Table 10 Global Personal Care Products Market Revenue (USD Million) By Regions (2021-2032)
Table 11 Global Personal Care Products Market Share (%) By Regions (2021-2032)
Table 12 North America Personal Care Products Revenue (USD Million) By Country (2021-2032)
Table 13 Europe Personal Care Products Revenue (USD Million) By Country (2021-2032)
Table 14 Asia Pacific Personal Care Products Revenue (USD Million) By Country (2021-2032)
Table 15 South America Personal Care Products Revenue (USD Million) By Country (2021-2032)
Table 16 Middle East and Africa Personal Care Products Revenue (USD Million) By Region (2021-2032)
Table 17 North America Personal Care Products Revenue (USD Million) By Type (2021-2032)
Table 18 North America Personal Care Products Revenue (USD Million) By Application (2021-2032)
Table 19 North America Personal Care Products Revenue (USD Million) By Product (2021-2032)
Table 20 Europe Personal Care Products Revenue (USD Million) By Type (2021-2032)
Table 21 Europe Personal Care Products Revenue (USD Million) By Application (2021-2032)
Table 22 Europe Personal Care Products Revenue (USD Million) By Product (2021-2032)
Table 23 Asia Pacific Personal Care Products Revenue (USD Million) By Type (2021-2032)
Table 24 Asia Pacific Personal Care Products Revenue (USD Million) By Application (2021-2032)
Table 25 Asia Pacific Personal Care Products Revenue (USD Million) By Product (2021-2032)
Table 26 South America Personal Care Products Revenue (USD Million) By Type (2021-2032)
Table 27 South America Personal Care Products Revenue (USD Million) By Application (2021-2032)
Table 28 South America Personal Care Products Revenue (USD Million) By Product (2021-2032)
Table 29 Middle East and Africa Personal Care Products Revenue (USD Million) By Type (2021-2032)
Table 30 Middle East and Africa Personal Care Products Revenue (USD Million) By Application (2021-2032)
Table 31 Middle East and Africa Personal Care Products Revenue (USD Million) By Product (2021-2032)
LIST OF FIGURES
Figure 1. Market Scope
Figure 2. Pricing Forecasts Per Unit, 2023- 2032
Figure 3. Porter’s Five Forces
Figure 4. Global Personal Care Products Market Revenue (USD Million) By Regions (2021-2032)
Figure 5. Global Personal Care Products Market Share (%) By Regions (2023)
Figure 6. North America Personal Care Products Revenue (USD Million) By Country (2021-2032)
Figure 7. United States Personal Care Products Revenue (USD Million) By Country (2021-2032)
Figure 8. Canada Personal Care Products Revenue (USD Million) By Country (2021-2032)
Figure 9. Mexico Personal Care Products Revenue (USD Million) By Country (2021-2032)
Figure 10. Europe Personal Care Products Revenue (USD Million) By Country (2021-2032)
Figure 11. Germany Personal Care Products Revenue (USD Million) By Country (2021-2032)
Figure 12. France Personal Care Products Revenue (USD Million) By Country (2021-2032)
Figure 13. United Kingdom Personal Care Products Revenue (USD Million) By Country (2021-2032)
Figure 14. Spain Personal Care Products Revenue (USD Million) By Country (2021-2032)
Figure 15. Italy Personal Care Products Revenue (USD Million) By Country (2021-2032)
Figure 16. Russia Personal Care Products Revenue (USD Million) By Country (2021-2032)
Figure 17. Rest of Europe Personal Care Products Revenue (USD Million) By Country (2021-2032)
Figure 11. Asia Pacific Personal Care Products Revenue (USD Million) By Country (2021-2032)
Figure 12. China Personal Care Products Revenue (USD Million) By Country (2021-2032)
Figure 13. Japan Personal Care Products Revenue (USD Million) By Country (2021-2032)
Figure 14. India Personal Care Products Revenue (USD Million) By Country (2021-2032)
Figure 15. South Korea Personal Care Products Revenue (USD Million) By Country (2021-2032)
Figure 16. Australia Personal Care Products Revenue (USD Million) By Country (2021-2032)
Figure 17. South East Asia Personal Care Products Revenue (USD Million) By Country (2021-2032)
Figure 18. South America Personal Care Products Revenue (USD Million) By Country (2021-2032)
Figure 19. Brazil Personal Care Products Revenue (USD Million) By Country (2021-2032)
Figure 20. Argentina Personal Care Products Revenue (USD Million) By Country (2021-2032)
Figure 21. Rest of Asia Pacific Personal Care Products Revenue (USD Million) By Country (2021-2032)
Figure 22. Middle East and Africa Personal Care Products Revenue (USD Million) By Region (2021-2032)
Figure 23. Saudi Arabia Personal Care Products Revenue (USD Million) By Region (2021-2032)
Figure 24. The UAE Personal Care Products Revenue (USD Million) By Region (2021-2032)
Figure 25. Rest of Middle East Personal Care Products Revenue (USD Million) By Region (2021-2032)
Figure 26. South Africa Personal Care Products Revenue (USD Million) By Region (2021-2032)
Figure 27. Africa Personal Care Products Revenue (USD Million) By Region (2021-2032)
Figure 28. North America Personal Care Products Revenue (USD Million) By Type (2021-2032)
Figure 29. North America Personal Care Products Revenue (USD Million) By Application (2021-2032)
Figure 30. North America Personal Care Products Revenue (USD Million) By Product (2021-2032)
Figure 31. Europe Personal Care Products Revenue (USD Million) By Type (2021-2032)
Figure 32. Europe Personal Care Products Revenue (USD Million) By Application (2021-2032)
Figure 33. Europe Personal Care Products Revenue (USD Million) By Product (2021-2032)
Figure 34. Asia Pacific Personal Care Products Revenue (USD Million) By Type (2021-2032)
Figure 35. Asia Pacific Personal Care Products Revenue (USD Million) By Application (2021-2032)
Figure 36. Asia Pacific Personal Care Products Revenue (USD Million) By Product (2021-2032)
Figure 37. South America Personal Care Products Revenue (USD Million) By Type (2021-2032)
Figure 38. South America Personal Care Products Revenue (USD Million) By Application (2021-2032)
Figure 39. South America Personal Care Products Revenue (USD Million) By Product (2021-2032)
Figure 40. Middle East and Africa Personal Care Products Revenue (USD Million) By Type (2021-2032)
Figure 41. Middle East and Africa Personal Care Products Revenue (USD Million) By Application (2021-2032)
Figure 42. Middle East and Africa Personal Care Products Revenue (USD Million) By Product (2021-2032)
By Product
Skincare Products
Haircare Products
Color Cosmetics
Oral Care Products
Others
By Distribution Channel
Offline
Online
Countries Analyzed
North America (US, Canada, Mexico)
Europe (Germany, UK, France, Spain, Italy, Russia, Rest of Europe)
Asia Pacific (China, India, Japan, South Korea, Australia, South East Asia, Rest of Asia)
South America (Brazil, Argentina, Rest of South America)
Middle East and Africa (Saudi Arabia, UAE, Rest of Middle East, South Africa, Egypt, Rest of Africa)
