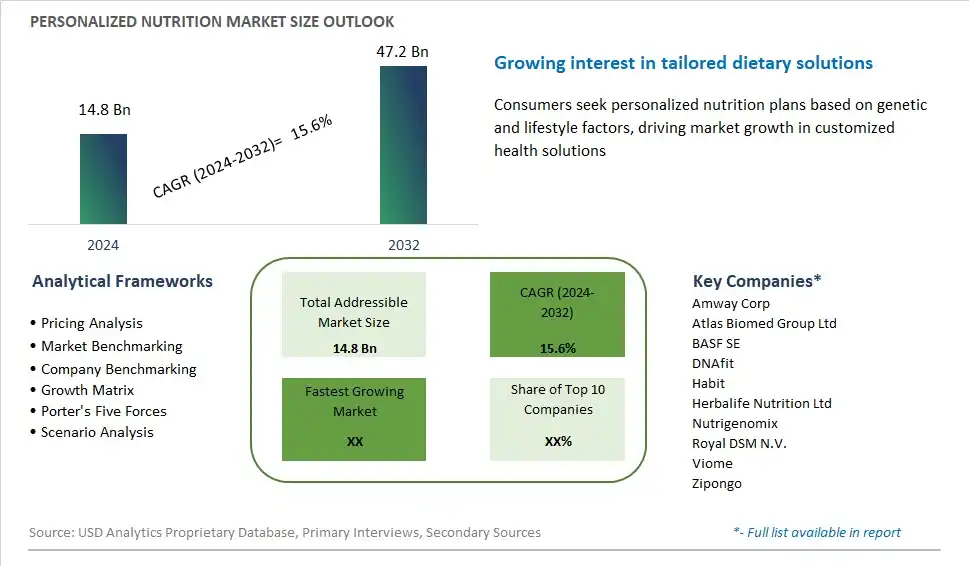
Global Personalized Nutrition Market Size is valued at $14.8 Billion in 2024 and is forecast to register a growth rate (CAGR) of 15.6% to reach $47.2 Billion by 2032.
The global Personalized Nutrition Market Comprehensive Study analyzes and forecasts the market size across 6 regions and 24 countries for diverse segments -By Product (Active Measurement, Standard Measurement), By Application (Standard Supplements, Disease-based), By End-User (Direct-To Consumer, Wellness & Fitness Centers, Hospitals & Clinics), By Form (Tablets, Capsules, Powder, Liquid, Others)
An Introduction to Personalized Nutrition Market
Personalized nutrition involves tailoring dietary recommendations and interventions to individual characteristics such as genetics, metabolism, lifestyle, and health goals in 2024. This approach considers factors such as age, gender, body composition, medical history, dietary preferences, and cultural background to develop personalized nutrition plans that optimize health outcomes and prevent diet-related diseases. Personalized nutrition utilizes various tools and technologies such as genetic testing, microbiome analysis, wearable devices, and mobile apps to collect and analyze individual data, providing personalized dietary advice, meal plans, and supplementation recommendations. With increasing awareness of the role of nutrition in health and disease prevention, the market for personalized nutrition is expanding, driven by investments in digital health platforms, data analytics, and behavior change interventions that empower individuals to make informed decisions about their diet and lifestyle to achieve optimal health and wellness.
Personalized Nutrition Competitive Landscape
The market report analyses the leading companies in the industry including Amway Corp, Atlas Biomed Group Ltd, BASF SE, DNAfit, Habit, Herbalife Nutrition Ltd, Nutrigenomix, Royal DSM N.V., Viome, Zipongo, and Others.
Personalized Nutrition Market Dynamics
Personalized Nutrition Market Trend: Rise of Health and Wellness Consciousness
One prominent market trend in personalized nutrition is the rise of health and wellness consciousness, driven by increasing consumer awareness of the importance of diet and lifestyle choices in achieving optimal health outcomes. As individuals become more proactive in managing their health and well-being, there's a growing interest in personalized nutrition solutions tailored to their unique dietary preferences, genetic makeup, and health goals. This trend is further fueled by advancements in technology such as wearable devices, genetic testing, and digital health platforms, enabling individuals to track their health metrics, receive personalized recommendations, and make informed decisions about their nutrition and lifestyle habits. As personalized nutrition becomes increasingly accessible and mainstream, the demand for personalized nutrition products and services continues to grow, driving innovation and market expansion in the personalized nutrition industry.
Market Driver: Increasing Demand for Customized Health Solutions
A key driver propelling the market for personalized nutrition is the increasing demand for customized health solutions to address individual health concerns, dietary preferences, and lifestyle factors. Traditional one-size-fits-all dietary recommendations are being replaced by personalized nutrition approaches that take into account an individual's genetic predispositions, metabolic profile, nutritional deficiencies, and cultural preferences. Consumers are seeking personalized nutrition solutions that offer targeted interventions for weight management, chronic disease prevention, sports performance optimization, and overall wellness enhancement. This driver is supported by scientific research demonstrating the impact of personalized nutrition on health outcomes and the effectiveness of tailored dietary interventions in improving nutritional status and reducing disease risk. Additionally, the rise of direct-to-consumer genetic testing and health tracking technologies empowers individuals to take control of their health and seek personalized nutrition advice from healthcare professionals, dietitians, and nutritionists. As the demand for personalized nutrition solutions continues to rise, there's significant market potential for companies offering personalized nutrition products, services, and digital platforms.
Market Opportunity: Integration of Technology for Personalized Nutrition Solutions
An opportunity within the personalized nutrition market lies in the integration of technology for personalized nutrition solutions to enhance accessibility, affordability, and effectiveness. With advancements in artificial intelligence (AI), machine learning, and data analytics, there's potential to develop sophisticated algorithms and predictive models that analyze individual health data, dietary patterns, and genetic information to generate personalized nutrition recommendations. Digital health platforms, mobile apps, and wearable devices can deliver personalized meal plans, dietary guidelines, and lifestyle recommendations based on real-time health metrics and user preferences. Moreover, there's an opportunity to leverage emerging technologies such as microbiome analysis, nutrigenomics, and metabolomics to further refine personalized nutrition interventions and tailor them to individual biological responses and nutritional needs. By integrating technology into personalized nutrition solutions, companies can scale their offerings, reach a broader audience, and provide more accurate and actionable recommendations for improved health outcomes.
Personalized Nutrition Market Share Analysis: Standard Measurement held the dominant market share in 2024
In the personalized nutrition market, the Standard Measurement segment is the largest, driven by several pivotal factors. Standard measurement approaches involve the use of established guidelines, general recommendations, and population-based data to assess nutritional needs and provide dietary recommendations. These methods are widely adopted due to their simplicity, cost-effectiveness, and ease of implementation compared to active measurement techniques, which often require specialized tools and professional expertise. Further, standard measurement approaches leverage existing dietary guidelines, nutrient databases, and algorithms to generate personalized nutrition recommendations based on factors such as age, gender, weight, and activity level. Additionally, the familiarity and accessibility of standard measurement methods appeal to consumers seeking convenient and practical solutions for managing their nutritional intake. Furthermore, the scalability of standard measurement approaches allows for widespread adoption across various healthcare settings, wellness programs, and consumer-facing platforms, driving the segment's dominance in the personalized nutrition market. As the demand for personalized nutrition continues to grow, standard measurement methods remain at the forefront, providing accessible and effective strategies for promoting optimal health and well-being.
Personalized Nutrition Market Share Analysis: Disease-based market is poised to register the fastest growth rae over the forecast period to 2032
In the personalized nutrition market, the Disease-based segment is the fastest-growing, propelled by several pivotal factors. With the increasing prevalence of chronic diseases and rising consumer awareness of the link between diet and health outcomes, there is a growing demand for personalized nutrition solutions tailored to specific health conditions. Disease-based personalized nutrition focuses on addressing individual nutritional needs based on factors such as genetics, biomarkers, and disease risk factors. This approach allows for the customization of dietary recommendations and supplementation strategies to support disease management, prevention, and overall well-being. Further, advancements in nutritional genomics, data analytics, and digital health technologies enable the identification of personalized dietary interventions that target underlying metabolic imbalances and genetic predispositions associated with chronic diseases. Additionally, the integration of disease-based personalized nutrition into healthcare systems, wellness programs, and digital health platforms enhances accessibility and adoption among consumers seeking proactive approaches to managing their health. Furthermore, the growing body of scientific evidence supporting the efficacy of personalized nutrition in improving health outcomes drives momentum for the Disease-based segment, positioning it as a key driver of growth and innovation in the personalized nutrition market.
Personalized Nutrition Market Share Analysis: Direct-to-Consumer held the dominant market share in 2024
In the personalized nutrition market, the Direct-to-Consumer segment is the largest, driven by several pivotal factors. Direct-to-consumer personalized nutrition platforms and services offer consumers convenient access to personalized dietary recommendations, supplementation plans, and lifestyle interventions tailored to their individual needs and preferences. By leveraging digital health technologies, data analytics, and genetic testing, these platforms empower consumers to take control of their health and well-being from the comfort of their homes. Further, the increasing popularity of self-care and preventive health measures encourages consumers to seek personalized nutrition solutions that address their unique health goals and concerns. Additionally, the growing availability of direct-to-consumer personalized nutrition services through online platforms, mobile apps, and subscription models expands market reach and accessibility, driving adoption among a diverse range of consumers. Furthermore, the ability to bypass traditional healthcare channels and access personalized nutrition directly appeals to individuals seeking proactive approaches to optimizing their health and nutrition, solidifying the Direct-to-Consumer segment's dominance in the personalized nutrition market.
Personalized Nutrition Market Segmentation
By Product
Active Measurement
Standard Measurement
By Application
Standard Supplements
Disease-based
By End-User
Direct-To Consumer
Wellness & Fitness Centers
Hospitals & Clinics
By Form
Tablets
Capsules
Powder
Liquid
Others
Countries Analyzed
North America (US, Canada, Mexico)
Europe (Germany, UK, France, Spain, Italy, Russia, Rest of Europe)
Asia Pacific (China, India, Japan, South Korea, Australia, South East Asia, Rest of Asia)
South America (Brazil, Argentina, Rest of South America)
Middle East and Africa (Saudi Arabia, UAE, Rest of Middle East, South Africa, Egypt, Rest of Africa)
Personalized Nutrition Companies Profiled in the Study
Amway Corp
Atlas Biomed Group Ltd
BASF SE
DNAfit
Habit
Herbalife Nutrition Ltd
Nutrigenomix
Royal DSM N.V.
Viome
Zipongo
*- List Not Exhaustive
Chapter 1. TABLE OF CONTENTS
Chapter 2. Introduction to Personalized Nutrition Market
2.1. Market Overview
2.2. Key Statistics and Report Highlights
2.3. Scope of the Comprehensive Study
2.3.1. Market Definition
2.3.2 Countries and Regions Covered
2.3.3 Research Objective
2.3.4 Units, Currency, and Conversions
2.3.5 Industry Value Chain
2.4. Key Market Segments
2.5. Key Companies
2.6. Study Period
Chapter 3. Strategic Analysis Review
3.1. Personalized Nutrition Pricing Analysis and Forecast
3.2. Porter’s Five Forces
3.3. Market Ecosystem
3.4. SWOT Analysis
3.5. Regulatory Scenario
3.3. Effects of Inflation, Russia-Ukraine War, moderating economic growth, and other macroeconomic factors
Chapter 4. Competitive Landscape
4.1. Market Share Analysis
4.1.1. Global Personalized Nutrition Market Share by Company, 2023
4.1.2. Product Offerings of Leading Personalized Nutrition Companies
4.2. Market Entropy
4.2.1. New Product Launches in the Industry
4.2.2. Mergers, Acquisitions, Joint ventures, and Partnerships
4.3. Key Strategies and Best Practices
Chapter 5. Global Market Projections: Best, Reference, and Low Case Scenarios
5.1. Growth Analysis- Case Scenario Definitions
5.2. Low Growth Case Scenario Forecasts
5.3. Reference Growth Case Scenario Forecasts
5.4. High Growth Case Scenario Forecasts
Chapter 6. Market Dynamics
6.1. Personalized Nutrition Market Drivers
6.2. Personalized Nutrition Market Challenges
6.6. Personalized Nutrition Market Opportunities
6.4. Personalized Nutrition Market Trends
Chapter 7. Global Personalized Nutrition Market Outlook Trends
7.1. Global Personalized Nutrition Revenue (USD Million) and CAGR (%) by Type (2021-2032)
7.2. Global Personalized Nutrition Revenue (USD Million) and CAGR (%) by Application (2021-2032)
7.3. Global Personalized Nutrition Revenue (USD Million) and CAGR (%) by Product (2021-2032)
By Product
Active Measurement
Standard Measurement
By Application
Standard Supplements
Disease-based
By End-User
Direct-To Consumer
Wellness & Fitness Centers
Hospitals & Clinics
By Form
Tablets
Capsules
Powder
Liquid
Others
Chapter 8. Global Personalized Nutrition Regional Analysis and Outlook
8.1. Global Personalized Nutrition Revenue (USD Million) By Regions (2021- 2032)
8.2. North America Personalized Nutrition Revenue (USD Million) by Country (2021-2032)
8.2.1. United States Personalized Nutrition Regional Analysis and Outlook
8.2.2. Canada Personalized Nutrition Regional Analysis and Outlook
8.2.3. Mexico Personalized Nutrition Regional Analysis and Outlook
8.3. Europe Personalized Nutrition Revenue (USD Million), by Country (2021-2032)
8.3.1. Germany Personalized Nutrition Regional Analysis and Outlook
8.3.2. France Personalized Nutrition Regional Analysis and Outlook
8.3.3. United Kingdom Personalized Nutrition Regional Analysis and Outlook
8.3.4. Spain Personalized Nutrition Regional Analysis and Outlook
8.3.5. Italy Personalized Nutrition Regional Analysis and Outlook
8.3.6. Russia Personalized Nutrition Regional Analysis and Outlook
8.3.7. Rest of Europe Personalized Nutrition Regional Analysis and Outlook
8.4. Asia Pacific Personalized Nutrition Revenue (USD Million) by Country (2021-2032)
8.4.1. China Personalized Nutrition Regional Analysis and Outlook
8.4.2. Japan Personalized Nutrition Regional Analysis and Outlook
8.4.3. India Personalized Nutrition Regional Analysis and Outlook
8.4.4. South Korea Personalized Nutrition Regional Analysis and Outlook
8.4.5. Australia Personalized Nutrition Regional Analysis and Outlook
8.4.6. South East Asia Personalized Nutrition Regional Analysis and Outlook
8.4.7. Rest of Asia Pacific Personalized Nutrition Regional Analysis and Outlook
8.5. South America Personalized Nutrition Revenue (USD Million), by Country (2021-2032)
8.5.1. Brazil Personalized Nutrition Regional Analysis and Outlook
8.5.2. Argentina Personalized Nutrition Regional Analysis and Outlook
8.5.3. Rest of South America Personalized Nutrition Regional Analysis and Outlook
8.6. Middle East and Africa Personalized Nutrition Revenue (USD Million) by Country (2021-2032)
8.6.1. Middle East Personalized Nutrition Regional Analysis and Outlook
8.6.2. Africa Personalized Nutrition Regional Analysis and Outlook
Chapter 9. North America Personalized Nutrition Analysis and Outlook
9.1. North America Personalized Nutrition Revenue (USD Million) by Segments (2021-2032)
9.1.1. North America Personalized Nutrition Revenue (USD Million) by Type (2021-2032)
9.1.2. North America Personalized Nutrition Revenue (USD Million) by Application (2021-2032)
9.1.3. North America Personalized Nutrition Revenue (USD Million) by Product (2021-2032)
By Product
Active Measurement
Standard Measurement
By Application
Standard Supplements
Disease-based
By End-User
Direct-To Consumer
Wellness & Fitness Centers
Hospitals & Clinics
By Form
Tablets
Capsules
Powder
Liquid
Others
Chapter 10. Europe Personalized Nutrition Analysis and Outlook
10.1. Europe Personalized Nutrition Revenue (USD Million), by Segments (USD Million) (2021-2032)
10.1.1. Europe Personalized Nutrition Revenue (USD Million) by Type (2021-2032)
10.1.2. Europe Personalized Nutrition Revenue (USD Million) by Application (2021-2032)
10.1.3. Europe Personalized Nutrition Revenue (USD Million) by Product (2021-2032)
By Product
Active Measurement
Standard Measurement
By Application
Standard Supplements
Disease-based
By End-User
Direct-To Consumer
Wellness & Fitness Centers
Hospitals & Clinics
By Form
Tablets
Capsules
Powder
Liquid
Others
Chapter 11. Asia Pacific Personalized Nutrition Analysis and Outlook
11.1. Asia Pacific Personalized Nutrition Revenue (USD Million), and Revenue (USD Million) by Segments (2021-2032)
11.1.1. Asia Pacific Personalized Nutrition Revenue (USD Million) by Type (2021-2032)
11.1.2. Asia Pacific Personalized Nutrition Revenue (USD Million) by Application (2021-2032)
11.1.3. Asia Pacific Personalized Nutrition Revenue (USD Million) by Product (2021-2032)
By Product
Active Measurement
Standard Measurement
By Application
Standard Supplements
Disease-based
By End-User
Direct-To Consumer
Wellness & Fitness Centers
Hospitals & Clinics
By Form
Tablets
Capsules
Powder
Liquid
Others
Chapter 12. South America Personalized Nutrition Analysis and Outlook
12.1. South America Personalized Nutrition Revenue (USD Million), by Segments (2021-2032)
12.1.1. South America Personalized Nutrition Revenue (USD Million) by Type (2021-2032)
12.1.2. South America Personalized Nutrition Revenue (USD Million) by Application (2021-2032)
12.1.3. South America Personalized Nutrition Revenue (USD Million) by Product (2021-2032)
By Product
Active Measurement
Standard Measurement
By Application
Standard Supplements
Disease-based
By End-User
Direct-To Consumer
Wellness & Fitness Centers
Hospitals & Clinics
By Form
Tablets
Capsules
Powder
Liquid
Others
Chapter 13. Middle East and Africa Personalized Nutrition Analysis and Outlook
13.1. Middle East and Africa Personalized Nutrition Revenue (USD Million), by Segments (2021-2032)
13.1.1. Middle East and Africa Personalized Nutrition Revenue (USD Million) by Type (2021-2032)
13.1.2. Middle East and Africa Personalized Nutrition Revenue (USD Million) by Application (2021-2032)
13.1.3. Middle East and Africa Personalized Nutrition Revenue (USD Million) by Product (2021-2032)
By Product
Active Measurement
Standard Measurement
By Application
Standard Supplements
Disease-based
By End-User
Direct-To Consumer
Wellness & Fitness Centers
Hospitals & Clinics
By Form
Tablets
Capsules
Powder
Liquid
Others
Chapter 14. Personalized Nutrition Company Profiles
14.1 Business Overview
14.2 Product Profiles
14.3 SWOT Profiles
14.5 Recent Developments
14.6 Financial Profile
List of Companies
Amway Corp
Atlas Biomed Group Ltd
BASF SE
DNAfit
Habit
Herbalife Nutrition Ltd
Nutrigenomix
Royal DSM N.V.
Viome
Zipongo
15. Methodology and Data Sources
15.1 Customization Offerings
15.2 Subscription Services
15.3 Related Reports
15.4 Publisher Expertise
LIST OF TABLES
Table 1 Market Segmentation Analysis
Table 2 Global Personalized Nutrition Market Share of Leading Companies, 2023
Table 3 Product Offerings of Leading Companies
Table 4 Low Growth Scenario Forecasts
Table 5 Reference Case Growth Scenario
Table 6 High Growth Case Scenario
Table 7 Global Personalized Nutrition Revenue (USD Million) And CAGR (%) By Type (2021-2032)
Table 8 Global Personalized Nutrition Revenue (USD Million) And CAGR (%) By Application (2021-2032)
Table 9 Global Personalized Nutrition Revenue (USD Million) And CAGR (%) By Product (2021-2032)
Table 10 Global Personalized Nutrition Market Revenue (USD Million) By Regions (2021-2032)
Table 11 Global Personalized Nutrition Market Share (%) By Regions (2021-2032)
Table 12 North America Personalized Nutrition Revenue (USD Million) By Country (2021-2032)
Table 13 Europe Personalized Nutrition Revenue (USD Million) By Country (2021-2032)
Table 14 Asia Pacific Personalized Nutrition Revenue (USD Million) By Country (2021-2032)
Table 15 South America Personalized Nutrition Revenue (USD Million) By Country (2021-2032)
Table 16 Middle East and Africa Personalized Nutrition Revenue (USD Million) By Region (2021-2032)
Table 17 North America Personalized Nutrition Revenue (USD Million) By Type (2021-2032)
Table 18 North America Personalized Nutrition Revenue (USD Million) By Application (2021-2032)
Table 19 North America Personalized Nutrition Revenue (USD Million) By Product (2021-2032)
Table 20 Europe Personalized Nutrition Revenue (USD Million) By Type (2021-2032)
Table 21 Europe Personalized Nutrition Revenue (USD Million) By Application (2021-2032)
Table 22 Europe Personalized Nutrition Revenue (USD Million) By Product (2021-2032)
Table 23 Asia Pacific Personalized Nutrition Revenue (USD Million) By Type (2021-2032)
Table 24 Asia Pacific Personalized Nutrition Revenue (USD Million) By Application (2021-2032)
Table 25 Asia Pacific Personalized Nutrition Revenue (USD Million) By Product (2021-2032)
Table 26 South America Personalized Nutrition Revenue (USD Million) By Type (2021-2032)
Table 27 South America Personalized Nutrition Revenue (USD Million) By Application (2021-2032)
Table 28 South America Personalized Nutrition Revenue (USD Million) By Product (2021-2032)
Table 29 Middle East and Africa Personalized Nutrition Revenue (USD Million) By Type (2021-2032)
Table 30 Middle East and Africa Personalized Nutrition Revenue (USD Million) By Application (2021-2032)
Table 31 Middle East and Africa Personalized Nutrition Revenue (USD Million) By Product (2021-2032)
LIST OF FIGURES
Figure 1. Market Scope
Figure 2. Pricing Forecasts Per Unit, 2023- 2032
Figure 3. Porter’s Five Forces
Figure 4. Global Personalized Nutrition Market Revenue (USD Million) By Regions (2021-2032)
Figure 5. Global Personalized Nutrition Market Share (%) By Regions (2023)
Figure 6. North America Personalized Nutrition Revenue (USD Million) By Country (2021-2032)
Figure 7. United States Personalized Nutrition Revenue (USD Million) By Country (2021-2032)
Figure 8. Canada Personalized Nutrition Revenue (USD Million) By Country (2021-2032)
Figure 9. Mexico Personalized Nutrition Revenue (USD Million) By Country (2021-2032)
Figure 10. Europe Personalized Nutrition Revenue (USD Million) By Country (2021-2032)
Figure 11. Germany Personalized Nutrition Revenue (USD Million) By Country (2021-2032)
Figure 12. France Personalized Nutrition Revenue (USD Million) By Country (2021-2032)
Figure 13. United Kingdom Personalized Nutrition Revenue (USD Million) By Country (2021-2032)
Figure 14. Spain Personalized Nutrition Revenue (USD Million) By Country (2021-2032)
Figure 15. Italy Personalized Nutrition Revenue (USD Million) By Country (2021-2032)
Figure 16. Russia Personalized Nutrition Revenue (USD Million) By Country (2021-2032)
Figure 17. Rest of Europe Personalized Nutrition Revenue (USD Million) By Country (2021-2032)
Figure 11. Asia Pacific Personalized Nutrition Revenue (USD Million) By Country (2021-2032)
Figure 12. China Personalized Nutrition Revenue (USD Million) By Country (2021-2032)
Figure 13. Japan Personalized Nutrition Revenue (USD Million) By Country (2021-2032)
Figure 14. India Personalized Nutrition Revenue (USD Million) By Country (2021-2032)
Figure 15. South Korea Personalized Nutrition Revenue (USD Million) By Country (2021-2032)
Figure 16. Australia Personalized Nutrition Revenue (USD Million) By Country (2021-2032)
Figure 17. South East Asia Personalized Nutrition Revenue (USD Million) By Country (2021-2032)
Figure 18. South America Personalized Nutrition Revenue (USD Million) By Country (2021-2032)
Figure 19. Brazil Personalized Nutrition Revenue (USD Million) By Country (2021-2032)
Figure 20. Argentina Personalized Nutrition Revenue (USD Million) By Country (2021-2032)
Figure 21. Rest of Asia Pacific Personalized Nutrition Revenue (USD Million) By Country (2021-2032)
Figure 22. Middle East and Africa Personalized Nutrition Revenue (USD Million) By Region (2021-2032)
Figure 23. Saudi Arabia Personalized Nutrition Revenue (USD Million) By Region (2021-2032)
Figure 24. The UAE Personalized Nutrition Revenue (USD Million) By Region (2021-2032)
Figure 25. Rest of Middle East Personalized Nutrition Revenue (USD Million) By Region (2021-2032)
Figure 26. South Africa Personalized Nutrition Revenue (USD Million) By Region (2021-2032)
Figure 27. Africa Personalized Nutrition Revenue (USD Million) By Region (2021-2032)
Figure 28. North America Personalized Nutrition Revenue (USD Million) By Type (2021-2032)
Figure 29. North America Personalized Nutrition Revenue (USD Million) By Application (2021-2032)
Figure 30. North America Personalized Nutrition Revenue (USD Million) By Product (2021-2032)
Figure 31. Europe Personalized Nutrition Revenue (USD Million) By Type (2021-2032)
Figure 32. Europe Personalized Nutrition Revenue (USD Million) By Application (2021-2032)
Figure 33. Europe Personalized Nutrition Revenue (USD Million) By Product (2021-2032)
Figure 34. Asia Pacific Personalized Nutrition Revenue (USD Million) By Type (2021-2032)
Figure 35. Asia Pacific Personalized Nutrition Revenue (USD Million) By Application (2021-2032)
Figure 36. Asia Pacific Personalized Nutrition Revenue (USD Million) By Product (2021-2032)
Figure 37. South America Personalized Nutrition Revenue (USD Million) By Type (2021-2032)
Figure 38. South America Personalized Nutrition Revenue (USD Million) By Application (2021-2032)
Figure 39. South America Personalized Nutrition Revenue (USD Million) By Product (2021-2032)
Figure 40. Middle East and Africa Personalized Nutrition Revenue (USD Million) By Type (2021-2032)
Figure 41. Middle East and Africa Personalized Nutrition Revenue (USD Million) By Application (2021-2032)
Figure 42. Middle East and Africa Personalized Nutrition Revenue (USD Million) By Product (2021-2032)
By Product
Active Measurement
Standard Measurement
By Application
Standard Supplements
Disease-based
By End-User
Direct-To Consumer
Wellness & Fitness Centers
Hospitals & Clinics
By Form
Tablets
Capsules
Powder
Liquid
Others
Countries Analyzed
North America (US, Canada, Mexico)
Europe (Germany, UK, France, Spain, Italy, Russia, Rest of Europe)
Asia Pacific (China, India, Japan, South Korea, Australia, South East Asia, Rest of Asia)
South America (Brazil, Argentina, Rest of South America)
Middle East and Africa (Saudi Arabia, UAE, Rest of Middle East, South Africa, Egypt, Rest of Africa)
