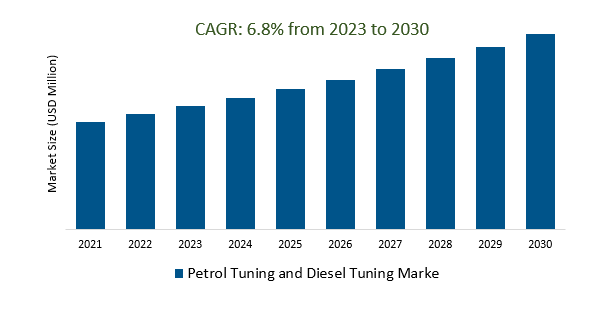
The Global Petrol Tuning and Diesel Tuning Market Size is estimated to register 6.8% growth over the forecast period from 2023 to 2030.
The market growth is driven by the increasingly stringent emissions regulations that are driving the need for more efficient and cleaner engine tuning solutions to reduce emissions from both petrol and diesel vehicles. Leading Companies that are focusing on Electrification Integration, Connected Vehicle Tuning, AI and Machine Learning Integration, Global Expansion, Commercial and Fleet Applications, Data Security and Privacy, Education and Awareness, and others to boost market shares in the industry.
Market Overview
The Petrol Tuning and Diesel Tuning market involves modifying vehicle engine control unit (ECU) software to enhance performance, fuel efficiency, and emissions compliance. It has grown significantly due to increasing demand for improved vehicle performance and customization, offering benefits like increased horsepower, better fuel economy, and customization options. Key players include tuning companies and equipment manufacturers, but challenges include warranty concerns and legal issues. The market's future scope will be shaped by technological advancements, environmental regulations, and consumer preferences, particularly in electric and hybrid vehicle tuning and data security aspects.
Market Dynamics
Market Trends - New Technologies for Improved Performance and Fuel Efficiency
Advancements in technology are playing a pivotal role in boosting both performance and fuel efficiency across various sectors. Electric and hybrid powertrains are revolutionizing the automotive industry, reducing fuel consumption and emissions. In aviation, streamlined aerodynamics and lightweight materials are enhancing aircraft fuel efficiency. Advanced engine technologies, energy recovery systems, and predictive analytics are optimizing machinery, enabling smoother operations, and reducing energy wastage. Moreover, the shift towards alternative fuels, such as hydrogen and biofuels, promises more sustainable energy sources, while smart grids and autonomous vehicles are poised to revolutionize energy management and driving patterns.
Market Driver- The demand for hybrid vehicle tuning is driving growth in the petrol tuning and diesel tuning market.
The surge in demand for hybrid vehicle tuning is reshaping the landscape of the petrol tuning and diesel tuning market. As hybrid vehicles become increasingly popular due to their eco-friendliness and fuel efficiency, there is a growing need for tuning services that can optimize the performance and efficiency of both their traditional combustion engines and electric components. This shift reflects a broader trend towards enhancing the capabilities of hybrid powertrains, ensuring they deliver not only reduced emissions but also improved power output and fuel economy.
Market Opportunity- The introduction of fuel efficiency standards has led to significant improvements in the fuel economy of vehicles
Fuel efficiency standards have led to substantial enhancements in vehicle fuel economy by compelling automakers to develop more efficient technologies, resulting in reduced fuel consumption, cost savings for consumers, lower carbon emissions, and global efforts to reduce reliance on fossil fuels. These standards encourage innovation and competition within the automotive industry, but their overall impact can vary based on factors like enforcement and consumer behavior.
Market Share Analysis- Petrol Tuning the Petrol Tuning and Diesel Tuning Market will register the fastest growth
The Global Petrol Tuning and Diesel Tuning Market is analyzed across Petrol Tuning, Diesel Tuning, and others. Petrol Tuning is poised to register the fastest growth. The petrol tuning and diesel tuning market involves modifying engine parameters to enhance vehicle performance, particularly in gasoline and diesel engines. This industry has grown to meet consumer demand for increased power and fuel efficiency, typically achieved through software or hardware modifications. However, it raises concerns regarding emissions and engine durability, necessitating regulatory oversight and responsible practices within the sector.
Market Share Analysis- Passenger Cars held a significant market share in 2023
The Global Petrol Tuning and Diesel Tuning Market is analyzed across various applications including Commercial Vehicles, Passenger Cars, and others. Of these, Passenger Cars held a significant market share in 2023. The petrol tuning and diesel tuning market specializes in optimizing the performance of passenger cars, whether they run on gasoline or diesel, by adjusting engine parameters. This involves enhancing power, torque, and fuel efficiency, but it also raises concerns about emissions and engine longevity, necessitating regulatory oversight and responsible practices in this segment.
Petrol Tuning and Diesel Tuning Market Segmentation
By Type
- Petrol Tuning
- Diesel Tuning
By Application
- Commercial Vehicles
- Passenger Cars
By Region
- North America (United States, Canada, Mexico)
- Europe (Germany, France, United Kingdom, Spain, Italy, Others)
- Asia Pacific (China, India, Japan, South Korea, Australia, Others)
- Latin America (Brazil, Argentina, Others)
- Middle East and Africa (Saudi Arabia, UAE, Kuwait, Other Middle East, South Africa, Nigeria, Other Africa)
Petrol Tuning and Diesel Tuning Market Companies
- DTE Systems
- AESCN
- Quantum Tuning
- ABT Sportsline GmbH
- RaceChip
- Superchips Limited
- Celtic Tuning
- EcuTek
- APR
*List not exhaustive
Petrol Tuning and Diesel Tuning Market Outlook 2023
1 Market Overview
1.1 Introduction to the Petrol Tuning and Diesel Tuning Market
1.2 Scope of the Study
1.3 Research Objective
1.3.1 Key Market Scope and Segments
1.3.2 Players Covered
1.3.3 Years Considered
2 Executive Summary
2.1 2023 Petrol Tuning and Diesel Tuning Industry- Market Statistics
3 Market Dynamics
3.1 Market Drivers
3.2 Market Challenges
3.3 Market Opportunities
3.4 Market Trends
4 Market Factor Analysis
4.1 Porter’s Five Forces
4.2 Market Entropy
4.2.1 Global Petrol Tuning and Diesel Tuning Market Companies with Area Served
4.2.2 Products Offerings Global Petrol Tuning and Diesel Tuning Market
5 COVID-19 Impact Analysis and Outlook Scenarios
5.1.1 Covid-19 Impact Analysis
5.1.2 Post-COVID-19 Scenario- Low Growth Case
5.1.3 Post-COVID-19 Scenario- Reference Growth Case
5.1.4 Post-COVID-19 Scenario- Low Growth Case
6 Global Petrol Tuning and Diesel Tuning Market Trends
6.1 Global Petrol Tuning and Diesel Tuning Revenue (USD Million) and CAGR (%) by Type (2018-2030)
6.2 Global Petrol Tuning and Diesel Tuning Revenue (USD Million) and CAGR (%) by Applications (2018-2030)
6.3 Global Petrol Tuning and Diesel Tuning Revenue (USD Million) and CAGR (%) by Regions (2018-2030)
7 Global Petrol Tuning and Diesel Tuning Market Revenue (USD Million) by Type, and Applications (2018-2022)
7.1 Global Petrol Tuning and Diesel Tuning Revenue (USD Million) by Type (2018-2022)
7.1.1 Global Petrol Tuning and Diesel Tuning Revenue (USD Million), Market Share (%) by Type (2018-2022)
7.2 Global Petrol Tuning and Diesel Tuning Revenue (USD Million) by Applications (2018-2022)
7.2.1 Global Petrol Tuning and Diesel Tuning Revenue (USD Million), Market Share (%) by Applications (2018-2022)
8 Global Petrol Tuning and Diesel Tuning Development Regional Status and Outlook
8.1 Global Petrol Tuning and Diesel Tuning Revenue (USD Million) By Regions (2018-2022)
8.2 North America Petrol Tuning and Diesel Tuning Revenue (USD Million) by Type, and Application (2018-2022)
8.2.1 North America Petrol Tuning and Diesel Tuning Revenue (USD Million) by Country (2018-2022)
8.2.2 North America Petrol Tuning and Diesel Tuning Revenue (USD Million) by Type (2018-2022)
8.2.3 North America Petrol Tuning and Diesel Tuning Revenue (USD Million) by Applications (2018-2022)
8.3 Europe Petrol Tuning and Diesel Tuning Revenue (USD Million), by Type, and Applications (USD Million) (2018-2022)
8.3.1 Europe Petrol Tuning and Diesel Tuning Revenue (USD Million), by Country (2018-2022)
8.3.2 Europe Petrol Tuning and Diesel Tuning Revenue (USD Million) by Type (2018-2022)
8.3.3 Europe Petrol Tuning and Diesel Tuning Revenue (USD Million) by Applications (2018-2022)
8.4 Asia Pacific Petrol Tuning and Diesel Tuning Revenue (USD Million), and Revenue (USD Million) by Type, and Applications (2018-2022)
8.4.1 Asia Pacific Petrol Tuning and Diesel Tuning Revenue (USD Million) by Country (2018-2022)
8.4.2 Asia Pacific Petrol Tuning and Diesel Tuning Revenue (USD Million) by Type (2018-2022)
8.4.3 Asia Pacific Petrol Tuning and Diesel Tuning Revenue (USD Million) by Applications (2018-2022)
8.5 South America Petrol Tuning and Diesel Tuning Revenue (USD Million), by Type, and Applications (2018-2022)
8.5.1 South America Petrol Tuning and Diesel Tuning Revenue (USD Million), by Country (2018-2022)
8.5.2 South America Petrol Tuning and Diesel Tuning Revenue (USD Million) by Type (2018-2022)
8.5.3 South America Petrol Tuning and Diesel Tuning Revenue (USD Million) by Applications (2018-2022)
8.6 Middle East and Africa Petrol Tuning and Diesel Tuning Revenue (USD Million), by Type, Technology, Application, Thickness (2018-2022)
8.6.1 Middle East and Africa Petrol Tuning and Diesel Tuning Revenue (USD Million) by Country (2018-2022)
8.6.2 Middle East and Africa Petrol Tuning and Diesel Tuning Revenue (USD Million) by Type (2018-2022)
8.6.3 Middle East and Africa Petrol Tuning and Diesel Tuning Revenue (USD Million) by Applications (2018-2022)
9 Company Profiles
10 Global Petrol Tuning and Diesel Tuning Market Revenue (USD Million), by Type, and Applications (2023-2030)
10.1 Global Petrol Tuning and Diesel Tuning Revenue (USD Million) and Market Share (%) by Type (2023-2030)
10.1.1 Global Petrol Tuning and Diesel Tuning Revenue (USD Million), and Market Share (%) by Type (2023-2030)
10.2 Global Petrol Tuning and Diesel Tuning Revenue (USD Million) and Market Share (%) by Applications (2023-2030)
10.2.1 Global Petrol Tuning and Diesel Tuning Revenue (USD Million), and Market Share (%) by Applications (2023-2030)
11 Global Petrol Tuning and Diesel Tuning Development Regional Status and Outlook Forecast
11.1 Global Petrol Tuning and Diesel Tuning Revenue (USD Million) By Regions (2023-2030)
11.2 North America Petrol Tuning and Diesel Tuning Revenue (USD Million) by Type, and Applications (2023-2030)
11.2.1 North America Petrol Tuning and Diesel Tuning Revenue (USD) Million by Country (2023-2030)
11.2.2 North America Petrol Tuning and Diesel Tuning Revenue (USD Million), by Type (2023-2030)
11.2.3 North America Petrol Tuning and Diesel Tuning Revenue (USD Million), Market Share (%) by Applications (2023-2030)
11.3 Europe Petrol Tuning and Diesel Tuning Revenue (USD Million), by Type, and Applications (2023-2030)
11.3.1 Europe Petrol Tuning and Diesel Tuning Revenue (USD Million), by Country (2023-2030)
11.3.2 Europe Petrol Tuning and Diesel Tuning Revenue (USD Million), by Type (2023-2030)
11.3.3 Europe Petrol Tuning and Diesel Tuning Revenue (USD Million), by Applications (2023-2030)
11.4 Asia Pacific Petrol Tuning and Diesel Tuning Revenue (USD Million) by Type, and Applications (2023-2030)
11.4.1 Asia Pacific Petrol Tuning and Diesel Tuning Revenue (USD Million), by Country (2023-2030)
11.4.2 Asia Pacific Petrol Tuning and Diesel Tuning Revenue (USD Million), by Type (2023-2030)
11.4.3 Asia Pacific Petrol Tuning and Diesel Tuning Revenue (USD Million), by Applications (2023-2030)
11.5 South America Petrol Tuning and Diesel Tuning Revenue (USD Million), by Type, and Applications (2023-2030)
11.5.1 South America Petrol Tuning and Diesel Tuning Revenue (USD Million), by Country (2023-2030)
11.5.2 South America Petrol Tuning and Diesel Tuning Revenue (USD Million), by Type (2023-2030)
11.5.3 South America Petrol Tuning and Diesel Tuning Revenue (USD Million), by Applications (2023-2030)
11.6 Middle East and Africa Petrol Tuning and Diesel Tuning Revenue (USD Million), by Type, and Applications (2023-2030)
11.6.1 Middle East and Africa Petrol Tuning and Diesel Tuning Revenue (USD Million), by Region (2023-2030)
11.6.2 Middle East and Africa Petrol Tuning and Diesel Tuning Revenue (USD Million), by Type (2023-2030)
11.6.3 Middle East and Africa Petrol Tuning and Diesel Tuning Revenue (USD Million), by Applications (2023-2030)
12 Methodology and Data Sources
12.1 Methodology/Research Approach
12.1.1 Research Programs/Design
12.1.2 Market Size Estimation
12.1.3 Market Breakdown and Data Triangulation
12.2 Data Sources
12.2.1 Secondary Sources
12.2.2 Primary Sources
12.3 Disclaimer
List of Tables
Table 1 Market Segmentation Analysis
Table 2 Global Petrol Tuning and Diesel Tuning Market Companies with Areas Served
Table 3 Products Offerings Global Petrol Tuning and Diesel Tuning Market
Table 4 Low Growth Scenario Forecasts
Table 5 Reference Case Growth Scenario
Table 6 High Growth Case Scenario
Table 7 Global Petrol Tuning and Diesel Tuning Revenue (USD Million) And CAGR (%) By Type (2018-2030)
Table 8 Global Petrol Tuning and Diesel Tuning Revenue (USD Million) And CAGR (%) By Applications (2018-2030)
Table 9 Global Petrol Tuning and Diesel Tuning Revenue (USD Million) And CAGR (%) By Regions (2018-2030)
Table 10 Global Petrol Tuning and Diesel Tuning Revenue (USD Million) By Type (2018-2022)
Table 11 Global Petrol Tuning and Diesel Tuning Revenue Market Share (%) By Type (2018-2022)
Table 12 Global Petrol Tuning and Diesel Tuning Revenue (USD Million) By Applications (2018-2022)
Table 13 Global Petrol Tuning and Diesel Tuning Revenue Market Share (%) By Applications (2018-2022)
Table 14 Global Petrol Tuning and Diesel Tuning Market Revenue (USD Million) By Regions (2018-2022)
Table 15 Global Petrol Tuning and Diesel Tuning Market Share (%) By Regions (2018-2022)
Table 16 North America Petrol Tuning and Diesel Tuning Revenue (USD Million) By Country (2018-2022)
Table 17 North America Petrol Tuning and Diesel Tuning Revenue (USD Million) By Type (2018-2022)
Table 18 North America Petrol Tuning and Diesel Tuning Revenue (USD Million) By Applications (2018-2022)
Table 19 Europe Petrol Tuning and Diesel Tuning Revenue (USD Million) By Country (2018-2022)
Table 20 Europe Petrol Tuning and Diesel Tuning Revenue (USD Million) By Type (2018-2022)
Table 21 Europe Petrol Tuning and Diesel Tuning Revenue (USD Million) By Applications (2018-2022)
Table 22 Asia Pacific Petrol Tuning and Diesel Tuning Revenue (USD Million) By Country (2018-2022)
Table 23 Asia Pacific Petrol Tuning and Diesel Tuning Revenue (USD Million) By Type (2018-2022)
Table 24 Asia Pacific Petrol Tuning and Diesel Tuning Revenue (USD Million) By Applications (2018-2022)
Table 25 South America Petrol Tuning and Diesel Tuning Revenue (USD Million) By Country (2018-2022)
Table 26 South America Petrol Tuning and Diesel Tuning Revenue (USD Million) By Type (2018-2022)
Table 27 South America Petrol Tuning and Diesel Tuning Revenue (USD Million) By Applications (2018-2022)
Table 28 Middle East and Africa Petrol Tuning and Diesel Tuning Revenue (USD Million) By Region (2018-2022)
Table 29 Middle East and Africa Petrol Tuning and Diesel Tuning Revenue (USD Million) By Type (2018-2022)
Table 30 Middle East and Africa Petrol Tuning and Diesel Tuning Revenue (USD Million) By Applications (2018-2022)
Table 31 Financial Analysis
Table 32 Global Petrol Tuning and Diesel Tuning Revenue (USD Million) By Type (2023-2030)
Table 33 Global Petrol Tuning and Diesel Tuning Revenue Market Share (%) By Type (2023-2030)
Table 34 Global Petrol Tuning and Diesel Tuning Revenue (USD Million) By Applications (2023-2030)
Table 35 Global Petrol Tuning and Diesel Tuning Revenue Market Share (%) By Applications (2023-2030)
Table 36 Global Petrol Tuning and Diesel Tuning Market Revenue (USD Million), And Revenue (USD Million) By Regions (2023-2030)
Table 37 North America Petrol Tuning and Diesel Tuning Revenue (USD)By Country (2023-2030)
Table 38 North America Petrol Tuning and Diesel Tuning Revenue (USD Million) By Type (2023-2030)
Table 39 North America Petrol Tuning and Diesel Tuning Revenue (USD Million) By Applications (2023-2030)
Table 40 Europe Petrol Tuning and Diesel Tuning Revenue (USD Million) By Country (2023-2030)
Table 41 Europe Petrol Tuning and Diesel Tuning Revenue (USD Million) By Type (2023-2030)
Table 42 Europe Petrol Tuning and Diesel Tuning Revenue (USD Million) By Applications (2023-2030)
Table 43 Asia Pacific Petrol Tuning and Diesel Tuning Revenue (USD Million) By Country (2023-2030)
Table 44 Asia Pacific Petrol Tuning and Diesel Tuning Revenue (USD Million) By Type (2023-2030)
Table 45 Asia Pacific Petrol Tuning and Diesel Tuning Revenue (USD Million) By Applications (2023-2030)
Table 46 South America Petrol Tuning and Diesel Tuning Revenue (USD Million) By Country (2023-2030)
Table 47 South America Petrol Tuning and Diesel Tuning Revenue (USD Million) By Type (2023-2030)
Table 48 South America Petrol Tuning and Diesel Tuning Revenue (USD Million) By Applications (2023-2030)
Table 49 Middle East and Africa Petrol Tuning and Diesel Tuning Revenue (USD Million) By Region (2023-2030)
Table 50 Middle East and Africa Petrol Tuning and Diesel Tuning Revenue (USD Million) By Region (2023-2030)
Table 51 Middle East and Africa Petrol Tuning and Diesel Tuning Revenue (USD Million) By Type (2023-2030)
Table 52 Middle East and Africa Petrol Tuning and Diesel Tuning Revenue (USD Million) By Applications (2023-2030)
Table 53 Research Programs/Design for This Report
Table 54 Key Data Information from Secondary Sources
Table 55 Key Data Information from Primary Sources
List of Figures
Figure 1 Market Scope
Figure 2 Porter’s Five Forces
Figure 3 Global Petrol Tuning and Diesel Tuning Revenue (USD Million) By Type (2018-2022)
Figure 4 Global Petrol Tuning and Diesel Tuning Revenue Market Share (%) By Type (2022)
Figure 5 Global Petrol Tuning and Diesel Tuning Revenue (USD Million) By Applications (2018-2022)
Figure 6 Global Petrol Tuning and Diesel Tuning Revenue Market Share (%) By Applications (2022)
Figure 7 Global Petrol Tuning and Diesel Tuning Market Revenue (USD Million) By Regions (2018-2022)
Figure 8 Global Petrol Tuning and Diesel Tuning Market Share (%) By Regions (2022)
Figure 9 North America Petrol Tuning and Diesel Tuning Revenue (USD Million) By Country (2018-2022)
Figure 10 North America Petrol Tuning and Diesel Tuning Revenue (USD Million) By Type (2018-2022)
Figure 11 North America Petrol Tuning and Diesel Tuning Revenue (USD Million) By Applications (2018-2022)
Figure 12 Europe Petrol Tuning and Diesel Tuning Revenue (USD Million) By Country (2018-2022)
Figure 13 Europe Petrol Tuning and Diesel Tuning Revenue (USD Million) By Type (2018-2022)
Figure 14 Europe Petrol Tuning and Diesel Tuning Revenue (USD Million) By Applications (2018-2022)
Figure 15 Asia Pacific Petrol Tuning and Diesel Tuning Revenue (USD Million) By Country (2018-2022)
Figure 16 Asia Pacific Petrol Tuning and Diesel Tuning Revenue (USD Million) By Type (2018-2022)
Figure 17 Asia Pacific Petrol Tuning and Diesel Tuning Revenue (USD Million) By Applications (2018-2022)
Figure 18 South America Petrol Tuning and Diesel Tuning Revenue (USD Million) By Country (2018-2022)
Figure 19 South America Petrol Tuning and Diesel Tuning Revenue (USD Million) By Type (2018-2022)
Figure 20 South America Petrol Tuning and Diesel Tuning Revenue (USD Million) By Applications (2018-2022)
Figure 21 Middle East and Africa Petrol Tuning and Diesel Tuning Revenue (USD Million) By Region (2018-2022)
Figure 22 Middle East and Africa Petrol Tuning and Diesel Tuning Revenue (USD Million) By Type (2018-2022)
Figure 23 Middle East and Africa Petrol Tuning and Diesel Tuning Revenue (USD Million) By Applications (2018-2022)
Figure 24 Global Petrol Tuning and Diesel Tuning Revenue (USD Million) By Type (2023-2030)
Figure 25 Global Petrol Tuning and Diesel Tuning Revenue Market Share (%) By Type (2030)
Figure 26 Global Petrol Tuning and Diesel Tuning Revenue (USD Million) By Applications (2023-2030)
Figure 27 Global Petrol Tuning and Diesel Tuning Revenue Market Share (%) By Applications (2030)
Figure 28 Global Petrol Tuning and Diesel Tuning Market Revenue (USD Million) By Regions (2023-2030)
Figure 29 North America Petrol Tuning and Diesel Tuning Revenue (USD Million) By Country (2023-2030)
Figure 30 North America Petrol Tuning and Diesel Tuning Revenue (USD Million) By Type (2023-2030)
Figure 31 North America Petrol Tuning and Diesel Tuning Revenue (USD Million) By Applications (2023-2030)
Figure 32 Europe Petrol Tuning and Diesel Tuning Revenue (USD Million) By Country (2023-2030)
Figure 33 Europe Petrol Tuning and Diesel Tuning Revenue (USD Million) By Type (2023-2030)
Figure 34 Europe Petrol Tuning and Diesel Tuning Revenue (USD Million) By Applications (2023-2030)
Figure 35 Asia Pacific Petrol Tuning and Diesel Tuning Revenue (USD Million) By Country (2023-2030)
Figure 36 Asia Pacific Petrol Tuning and Diesel Tuning Revenue (USD Million) By Type (2023-2030)
Figure 37 Asia Pacific Petrol Tuning and Diesel Tuning Revenue (USD Million) By Applications (2023-2030)
Figure 38 South America Petrol Tuning and Diesel Tuning Revenue (USD Million) By Country (2023-2030)
Figure 39 South America Petrol Tuning and Diesel Tuning Revenue (USD Million) By Type (2023-2030)
Figure 40 South America Petrol Tuning and Diesel Tuning Revenue (USD Million) By Applications (2023-2030)
Figure 41 Middle East and Africa Petrol Tuning and Diesel Tuning Revenue (USD Million) By Region (2023-2030)
Figure 42 Middle East and Africa Petrol Tuning and Diesel Tuning Revenue (USD Million) By Region (2023-2030)
Figure 43 Middle East and Africa Petrol Tuning and Diesel Tuning Revenue (USD Million) By Type (2023-2030)
Figure 44 Middle East and Africa Petrol Tuning and Diesel Tuning Revenue (USD Million) By Applications (2023-2030)
Figure 45 Bottom-Up and Top-Down Approaches For This Report
Figure 46 Data Triangulation
