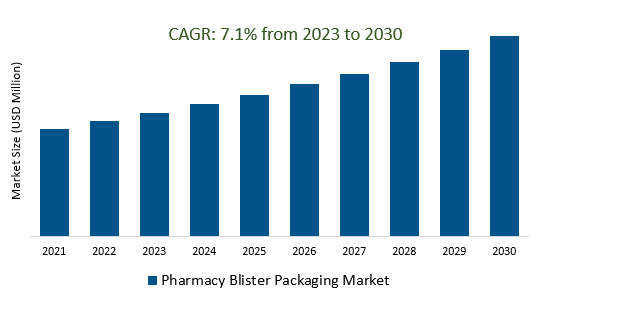
The Global Pharmacy Blister Packaging Market Size is estimated to register 7.1% growth over the forecast period from 2023 to 2030.
The market growth is driven by increasing Developing countries with growing healthcare infrastructure are witnessing increased pharmaceutical sales, boosting the demand for blister packaging solutions. Leading Companies focusing on the Growing Pharmaceutical Industry, Regulatory Compliance, Focus on Patient-Centric Care, Customization and Personalization, E-commerce and Direct-to-Consumer Sales, and others to boost market shares in the industry.
Market Overview
The Pharmacy Blister Packaging Market offers specialized packaging solutions for pharmaceuticals, featuring various types such as clamshell, cold-forming, and unit-dose blister packs. Key drivers include the rising demand for pharmaceuticals, regulatory compliance, patient safety, e-commerce, and counterfeit drug prevention. Customization, sustainability, and technological advancements are notable trends, while global expansion and mergers and acquisitions further influence the market. Challenges include increased competition, cost pressures, and sustainability concerns. The market is expected to continue growing, driven by pharmaceutical industry expansion, patient-centric care, and ongoing regulatory requirements, with a focus on innovation and materials.
Market Dynamics
Market Trends- The growth of eCommerce and direct-to-consumer (D2C) sales is driving demand for pharmacy blister packaging.
The Pharmacy Blister Packaging Market is experiencing a surge in demand due to the rapid growth of e-commerce and direct-to-consumer (D2C) sales in the pharmaceutical industry, necessitating specialized blister packaging solutions for secure home delivery. These solutions safeguard medications during shipping, uphold product integrity, and improve user-friendliness. The continued expansion of online pharmaceutical retail creates opportunities for innovation in the market, underscoring the importance of tamper-evident and child-resistant features for maintaining patient safety throughout the supply chain.
Market Driver- Increasing pharmaceutical sales are fueling demand for pharmacy blister packaging.
Increasing pharmaceutical sales are a primary driver of the Pharmacy Blister Packaging Market, fueled by factors like aging populations, growing chronic diseases, and evolving healthcare needs. Blister packaging, ensuring proper dosing and improving patient compliance while preventing medication errors, has become integral to the pharmaceutical supply chain. Its role is further underscored by the need to combat counterfeit drugs and prioritize patient safety, as pharmaceutical sales continue to rise, making blister packaging an indispensable component in healthcare.
Market Opportunity- Counterfeit drug prevention is a key driver of the pharmacy blister packaging market.
Counterfeit drug prevention is a primary driver in the Pharmacy Blister Packaging Market, where blister packaging serves as a critical solution. Its incorporation of tamper-evident and child-resistant features significantly reduces the risk of unauthorized access and tampering, aligning with regulatory requirements and enhancing patient safety by thwarting counterfeit drug distribution throughout the supply chain.
Market Share Analysis- Compartment Blister Packs Pharmacy Blister Packaging Market will register the fastest growth
The Global Pharmacy Blister Packaging Market is analyzed across Compartment Blister Packs, Slide Blister Packs, and others. Compartment Blister Packs is poised to register the fastest growth. Compartment Blister Packs are a specialized segment within the Pharmacy Blister Packaging Market, featuring individual pockets for single medication doses. These packs enhance patient adherence by simplifying medication regimens, reducing errors, and finding application in long-term care facilities, senior care, and home healthcare, where effective medication management is crucial. The market offers diverse compartment blister pack options tailored to varying patient needs and healthcare settings.
Market Share Analysis- Polyethylene Terephthalate (PET) held a significant market share in 2023
The Global Pharmacy Blister Packaging Market is analyzed across various materials including Polyethylene Terephthalate (PET), Polyethylene (PE), Polyvinyl Chloride (PVC), Aluminum, Paper and paper Board, and others. Of these, Polyethylene Terephthalate (PET) held a significant market share in 2023. Polyethylene Terephthalate (PET) is a prevalent material in the Pharmacy Blister Packaging Market, known for its durability, moisture resistance, and chemical resistance. It is commonly used for blister packaging to protect and display individual medication doses. PET blister packaging offers clarity for easy identification, and tamper-evident, and child-resistant features, making it a versatile choice for various pharmaceutical products in the industry.
Pharmacy Blister Packaging Market Segmentation
By Type
- Compartment Blister Packs
- Slide Blister Packs
- Others
By Material Type
- Polyethylene Terephthalate (PET)
- Polyethylene (PE)
- Polyvinyl Chloride (PVC)
- Aluminum
- Paper & Paper Board
- Others
By Component
- Films
- Lidding Materials
- Secondary Containers
- Packaging Accessories
By Technology
- Cold Forming
- Thermoforming
By Applications
- Tablets
- Capsules
- Drugs
- Vials
- Ampoules
- Others
By Region
- North America (United States, Canada, Mexico)
- Europe (Germany, France, United Kingdom, Spain, Italy, Others)
- Asia Pacific (China, India, Japan, South Korea, Australia, Others)
- Latin America (Brazil, Argentina, Others)
- Middle East and Africa (Saudi Arabia, UAE, Kuwait, Other Middle East, South Africa, Nigeria, Other Africa)
Pharmacy Blister Packaging Market Companies
- Amcor Plc
- ACG Pharmapack Pvt. Ltd
- Bilcare Limited
- Wonderpack group
- Sonoco Products Company
- Honeywell International Inc
- West Rock Company
- Constantia Flexibles GmbH
- WINPAK LTD
- Rohrer Corporation
- Accupack
- Nichrome Packaging Solutions
- Nirmala Industries
*List not exhaustive
Pharmacy Blister Packaging Market Outlook 2023
1 Market Overview
1.1 Introduction to the Pharmacy Blister Packaging Market
1.2 Scope of the Study
1.3 Research Objective
1.3.1 Key Market Scope and Segments
1.3.2 Players Covered
1.3.3 Years Considered
2 Executive Summary
2.1 2023 Pharmacy Blister Packaging Industry- Market Statistics
3 Market Dynamics
3.1 Market Drivers
3.2 Market Challenges
3.3 Market Opportunities
3.4 Market Trends
4 Market Factor Analysis
4.1 Porter’s Five Forces
4.2 Market Entropy
4.2.1 Global Pharmacy Blister Packaging Market Companies with Area Served
4.2.2 Products Offerings Global Pharmacy Blister Packaging Market
5 COVID-19 Impact Analysis and Outlook Scenarios
5.1.1 Covid-19 Impact Analysis
5.1.2 Post-COVID-19 Scenario- Low Growth Case
5.1.3 Post-COVID-19 Scenario- Reference Growth Case
5.1.4 Post-COVID-19 Scenario- Low Growth Case
6 Global Pharmacy Blister Packaging Market Trends
6.1 Global Pharmacy Blister Packaging Revenue (USD Million) and CAGR (%) by Type (2018-2030)
6.2 Global Pharmacy Blister Packaging Revenue (USD Million) and CAGR (%) by Applications (2018-2030)
6.3 Global Pharmacy Blister Packaging Revenue (USD Million) and CAGR (%) by Regions (2018-2030)
7 Global Pharmacy Blister Packaging Market Revenue (USD Million) by Type, and Applications (2018-2022)
7.1 Global Pharmacy Blister Packaging Revenue (USD Million) by Type (2018-2022)
7.1.1 Global Pharmacy Blister Packaging Revenue (USD Million), Market Share (%) by Type (2018-2022)
7.2 Global Pharmacy Blister Packaging Revenue (USD Million) by Applications (2018-2022)
7.2.1 Global Pharmacy Blister Packaging Revenue (USD Million), Market Share (%) by Applications (2018-2022)
8 Global Pharmacy Blister Packaging Development Regional Status and Outlook
8.1 Global Pharmacy Blister Packaging Revenue (USD Million) By Regions (2018-2022)
8.2 North America Pharmacy Blister Packaging Revenue (USD Million) by Type, and Application (2018-2022)
8.2.1 North America Pharmacy Blister Packaging Revenue (USD Million) by Country (2018-2022)
8.2.2 North America Pharmacy Blister Packaging Revenue (USD Million) by Type (2018-2022)
8.2.3 North America Pharmacy Blister Packaging Revenue (USD Million) by Applications (2018-2022)
8.3 Europe Pharmacy Blister Packaging Revenue (USD Million), by Type, and Applications (USD Million) (2018-2022)
8.3.1 Europe Pharmacy Blister Packaging Revenue (USD Million), by Country (2018-2022)
8.3.2 Europe Pharmacy Blister Packaging Revenue (USD Million) by Type (2018-2022)
8.3.3 Europe Pharmacy Blister Packaging Revenue (USD Million) by Applications (2018-2022)
8.4 Asia Pacific Pharmacy Blister Packaging Revenue (USD Million), and Revenue (USD Million) by Type, and Applications (2018-2022)
8.4.1 Asia Pacific Pharmacy Blister Packaging Revenue (USD Million) by Country (2018-2022)
8.4.2 Asia Pacific Pharmacy Blister Packaging Revenue (USD Million) by Type (2018-2022)
8.4.3 Asia Pacific Pharmacy Blister Packaging Revenue (USD Million) by Applications (2018-2022)
8.5 South America Pharmacy Blister Packaging Revenue (USD Million), by Type, and Applications (2018-2022)
8.5.1 South America Pharmacy Blister Packaging Revenue (USD Million), by Country (2018-2022)
8.5.2 South America Pharmacy Blister Packaging Revenue (USD Million) by Type (2018-2022)
8.5.3 South America Pharmacy Blister Packaging Revenue (USD Million) by Applications (2018-2022)
8.6 Middle East and Africa Pharmacy Blister Packaging Revenue (USD Million), by Type, Technology, Application, Thickness (2018-2022)
8.6.1 Middle East and Africa Pharmacy Blister Packaging Revenue (USD Million) by Country (2018-2022)
8.6.2 Middle East and Africa Pharmacy Blister Packaging Revenue (USD Million) by Type (2018-2022)
8.6.3 Middle East and Africa Pharmacy Blister Packaging Revenue (USD Million) by Applications (2018-2022)
9 Company Profiles
10 Global Pharmacy Blister Packaging Market Revenue (USD Million), by Type, and Applications (2023-2030)
10.1 Global Pharmacy Blister Packaging Revenue (USD Million) and Market Share (%) by Type (2023-2030)
10.1.1 Global Pharmacy Blister Packaging Revenue (USD Million), and Market Share (%) by Type (2023-2030)
10.2 Global Pharmacy Blister Packaging Revenue (USD Million) and Market Share (%) by Applications (2023-2030)
10.2.1 Global Pharmacy Blister Packaging Revenue (USD Million), and Market Share (%) by Applications (2023-2030)
11 Global Pharmacy Blister Packaging Development Regional Status and Outlook Forecast
11.1 Global Pharmacy Blister Packaging Revenue (USD Million) By Regions (2023-2030)
11.2 North America Pharmacy Blister Packaging Revenue (USD Million) by Type, and Applications (2023-2030)
11.2.1 North America Pharmacy Blister Packaging Revenue (USD) Million by Country (2023-2030)
11.2.2 North America Pharmacy Blister Packaging Revenue (USD Million), by Type (2023-2030)
11.2.3 North America Pharmacy Blister Packaging Revenue (USD Million), Market Share (%) by Applications (2023-2030)
11.3 Europe Pharmacy Blister Packaging Revenue (USD Million), by Type, and Applications (2023-2030)
11.3.1 Europe Pharmacy Blister Packaging Revenue (USD Million), by Country (2023-2030)
11.3.2 Europe Pharmacy Blister Packaging Revenue (USD Million), by Type (2023-2030)
11.3.3 Europe Pharmacy Blister Packaging Revenue (USD Million), by Applications (2023-2030)
11.4 Asia Pacific Pharmacy Blister Packaging Revenue (USD Million) by Type, and Applications (2023-2030)
11.4.1 Asia Pacific Pharmacy Blister Packaging Revenue (USD Million), by Country (2023-2030)
11.4.2 Asia Pacific Pharmacy Blister Packaging Revenue (USD Million), by Type (2023-2030)
11.4.3 Asia Pacific Pharmacy Blister Packaging Revenue (USD Million), by Applications (2023-2030)
11.5 South America Pharmacy Blister Packaging Revenue (USD Million), by Type, and Applications (2023-2030)
11.5.1 South America Pharmacy Blister Packaging Revenue (USD Million), by Country (2023-2030)
11.5.2 South America Pharmacy Blister Packaging Revenue (USD Million), by Type (2023-2030)
11.5.3 South America Pharmacy Blister Packaging Revenue (USD Million), by Applications (2023-2030)
11.6 Middle East and Africa Pharmacy Blister Packaging Revenue (USD Million), by Type, and Applications (2023-2030)
11.6.1 Middle East and Africa Pharmacy Blister Packaging Revenue (USD Million), by Region (2023-2030)
11.6.2 Middle East and Africa Pharmacy Blister Packaging Revenue (USD Million), by Type (2023-2030)
11.6.3 Middle East and Africa Pharmacy Blister Packaging Revenue (USD Million), by Applications (2023-2030)
12 Methodology and Data Sources
12.1 Methodology/Research Approach
12.1.1 Research Programs/Design
12.1.2 Market Size Estimation
12.1.3 Market Breakdown and Data Triangulation
12.2 Data Sources
12.2.1 Secondary Sources
12.2.2 Primary Sources
12.3 Disclaimer
List of Tables
Table 1 Market Segmentation Analysis
Table 2 Global Pharmacy Blister Packaging Market Companies with Areas Served
Table 3 Products Offerings Global Pharmacy Blister Packaging Market
Table 4 Low Growth Scenario Forecasts
Table 5 Reference Case Growth Scenario
Table 6 High Growth Case Scenario
Table 7 Global Pharmacy Blister Packaging Revenue (USD Million) And CAGR (%) By Type (2018-2030)
Table 8 Global Pharmacy Blister Packaging Revenue (USD Million) And CAGR (%) By Applications (2018-2030)
Table 9 Global Pharmacy Blister Packaging Revenue (USD Million) And CAGR (%) By Regions (2018-2030)
Table 10 Global Pharmacy Blister Packaging Revenue (USD Million) By Type (2018-2022)
Table 11 Global Pharmacy Blister Packaging Revenue Market Share (%) By Type (2018-2022)
Table 12 Global Pharmacy Blister Packaging Revenue (USD Million) By Applications (2018-2022)
Table 13 Global Pharmacy Blister Packaging Revenue Market Share (%) By Applications (2018-2022)
Table 14 Global Pharmacy Blister Packaging Market Revenue (USD Million) By Regions (2018-2022)
Table 15 Global Pharmacy Blister Packaging Market Share (%) By Regions (2018-2022)
Table 16 North America Pharmacy Blister Packaging Revenue (USD Million) By Country (2018-2022)
Table 17 North America Pharmacy Blister Packaging Revenue (USD Million) By Type (2018-2022)
Table 18 North America Pharmacy Blister Packaging Revenue (USD Million) By Applications (2018-2022)
Table 19 Europe Pharmacy Blister Packaging Revenue (USD Million) By Country (2018-2022)
Table 20 Europe Pharmacy Blister Packaging Revenue (USD Million) By Type (2018-2022)
Table 21 Europe Pharmacy Blister Packaging Revenue (USD Million) By Applications (2018-2022)
Table 22 Asia Pacific Pharmacy Blister Packaging Revenue (USD Million) By Country (2018-2022)
Table 23 Asia Pacific Pharmacy Blister Packaging Revenue (USD Million) By Type (2018-2022)
Table 24 Asia Pacific Pharmacy Blister Packaging Revenue (USD Million) By Applications (2018-2022)
Table 25 South America Pharmacy Blister Packaging Revenue (USD Million) By Country (2018-2022)
Table 26 South America Pharmacy Blister Packaging Revenue (USD Million) By Type (2018-2022)
Table 27 South America Pharmacy Blister Packaging Revenue (USD Million) By Applications (2018-2022)
Table 28 Middle East and Africa Pharmacy Blister Packaging Revenue (USD Million) By Region (2018-2022)
Table 29 Middle East and Africa Pharmacy Blister Packaging Revenue (USD Million) By Type (2018-2022)
Table 30 Middle East and Africa Pharmacy Blister Packaging Revenue (USD Million) By Applications (2018-2022)
Table 31 Financial Analysis
Table 32 Global Pharmacy Blister Packaging Revenue (USD Million) By Type (2023-2030)
Table 33 Global Pharmacy Blister Packaging Revenue Market Share (%) By Type (2023-2030)
Table 34 Global Pharmacy Blister Packaging Revenue (USD Million) By Applications (2023-2030)
Table 35 Global Pharmacy Blister Packaging Revenue Market Share (%) By Applications (2023-2030)
Table 36 Global Pharmacy Blister Packaging Market Revenue (USD Million), And Revenue (USD Million) By Regions (2023-2030)
Table 37 North America Pharmacy Blister Packaging Revenue (USD)By Country (2023-2030)
Table 38 North America Pharmacy Blister Packaging Revenue (USD Million) By Type (2023-2030)
Table 39 North America Pharmacy Blister Packaging Revenue (USD Million) By Applications (2023-2030)
Table 40 Europe Pharmacy Blister Packaging Revenue (USD Million) By Country (2023-2030)
Table 41 Europe Pharmacy Blister Packaging Revenue (USD Million) By Type (2023-2030)
Table 42 Europe Pharmacy Blister Packaging Revenue (USD Million) By Applications (2023-2030)
Table 43 Asia Pacific Pharmacy Blister Packaging Revenue (USD Million) By Country (2023-2030)
Table 44 Asia Pacific Pharmacy Blister Packaging Revenue (USD Million) By Type (2023-2030)
Table 45 Asia Pacific Pharmacy Blister Packaging Revenue (USD Million) By Applications (2023-2030)
Table 46 South America Pharmacy Blister Packaging Revenue (USD Million) By Country (2023-2030)
Table 47 South America Pharmacy Blister Packaging Revenue (USD Million) By Type (2023-2030)
Table 48 South America Pharmacy Blister Packaging Revenue (USD Million) By Applications (2023-2030)
Table 49 Middle East and Africa Pharmacy Blister Packaging Revenue (USD Million) By Region (2023-2030)
Table 50 Middle East and Africa Pharmacy Blister Packaging Revenue (USD Million) By Region (2023-2030)
Table 51 Middle East and Africa Pharmacy Blister Packaging Revenue (USD Million) By Type (2023-2030)
Table 52 Middle East and Africa Pharmacy Blister Packaging Revenue (USD Million) By Applications (2023-2030)
Table 53 Research Programs/Design for This Report
Table 54 Key Data Information from Secondary Sources
Table 55 Key Data Information from Primary Sources
List of Figures
Figure 1 Market Scope
Figure 2 Porter’s Five Forces
Figure 3 Global Pharmacy Blister Packaging Revenue (USD Million) By Type (2018-2022)
Figure 4 Global Pharmacy Blister Packaging Revenue Market Share (%) By Type (2022)
Figure 5 Global Pharmacy Blister Packaging Revenue (USD Million) By Applications (2018-2022)
Figure 6 Global Pharmacy Blister Packaging Revenue Market Share (%) By Applications (2022)
Figure 7 Global Pharmacy Blister Packaging Market Revenue (USD Million) By Regions (2018-2022)
Figure 8 Global Pharmacy Blister Packaging Market Share (%) By Regions (2022)
Figure 9 North America Pharmacy Blister Packaging Revenue (USD Million) By Country (2018-2022)
Figure 10 North America Pharmacy Blister Packaging Revenue (USD Million) By Type (2018-2022)
Figure 11 North America Pharmacy Blister Packaging Revenue (USD Million) By Applications (2018-2022)
Figure 12 Europe Pharmacy Blister Packaging Revenue (USD Million) By Country (2018-2022)
Figure 13 Europe Pharmacy Blister Packaging Revenue (USD Million) By Type (2018-2022)
Figure 14 Europe Pharmacy Blister Packaging Revenue (USD Million) By Applications (2018-2022)
Figure 15 Asia Pacific Pharmacy Blister Packaging Revenue (USD Million) By Country (2018-2022)
Figure 16 Asia Pacific Pharmacy Blister Packaging Revenue (USD Million) By Type (2018-2022)
Figure 17 Asia Pacific Pharmacy Blister Packaging Revenue (USD Million) By Applications (2018-2022)
Figure 18 South America Pharmacy Blister Packaging Revenue (USD Million) By Country (2018-2022)
Figure 19 South America Pharmacy Blister Packaging Revenue (USD Million) By Type (2018-2022)
Figure 20 South America Pharmacy Blister Packaging Revenue (USD Million) By Applications (2018-2022)
Figure 21 Middle East and Africa Pharmacy Blister Packaging Revenue (USD Million) By Region (2018-2022)
Figure 22 Middle East and Africa Pharmacy Blister Packaging Revenue (USD Million) By Type (2018-2022)
Figure 23 Middle East and Africa Pharmacy Blister Packaging Revenue (USD Million) By Applications (2018-2022)
Figure 24 Global Pharmacy Blister Packaging Revenue (USD Million) By Type (2023-2030)
Figure 25 Global Pharmacy Blister Packaging Revenue Market Share (%) By Type (2030)
Figure 26 Global Pharmacy Blister Packaging Revenue (USD Million) By Applications (2023-2030)
Figure 27 Global Pharmacy Blister Packaging Revenue Market Share (%) By Applications (2030)
Figure 28 Global Pharmacy Blister Packaging Market Revenue (USD Million) By Regions (2023-2030)
Figure 29 North America Pharmacy Blister Packaging Revenue (USD Million) By Country (2023-2030)
Figure 30 North America Pharmacy Blister Packaging Revenue (USD Million) By Type (2023-2030)
Figure 31 North America Pharmacy Blister Packaging Revenue (USD Million) By Applications (2023-2030)
Figure 32 Europe Pharmacy Blister Packaging Revenue (USD Million) By Country (2023-2030)
Figure 33 Europe Pharmacy Blister Packaging Revenue (USD Million) By Type (2023-2030)
Figure 34 Europe Pharmacy Blister Packaging Revenue (USD Million) By Applications (2023-2030)
Figure 35 Asia Pacific Pharmacy Blister Packaging Revenue (USD Million) By Country (2023-2030)
Figure 36 Asia Pacific Pharmacy Blister Packaging Revenue (USD Million) By Type (2023-2030)
Figure 37 Asia Pacific Pharmacy Blister Packaging Revenue (USD Million) By Applications (2023-2030)
Figure 38 South America Pharmacy Blister Packaging Revenue (USD Million) By Country (2023-2030)
Figure 39 South America Pharmacy Blister Packaging Revenue (USD Million) By Type (2023-2030)
Figure 40 South America Pharmacy Blister Packaging Revenue (USD Million) By Applications (2023-2030)
Figure 41 Middle East and Africa Pharmacy Blister Packaging Revenue (USD Million) By Region (2023-2030)
Figure 42 Middle East and Africa Pharmacy Blister Packaging Revenue (USD Million) By Region (2023-2030)
Figure 43 Middle East and Africa Pharmacy Blister Packaging Revenue (USD Million) By Type (2023-2030)
Figure 44 Middle East and Africa Pharmacy Blister Packaging Revenue (USD Million) By Applications (2023-2030)
Figure 45 Bottom-Up and Top-Down Approaches For This Report
Figure 46 Data Triangulation
