Pipe Coatings Market Size, Energy Infrastructure Expansion, and Corrosion Protection Technologies
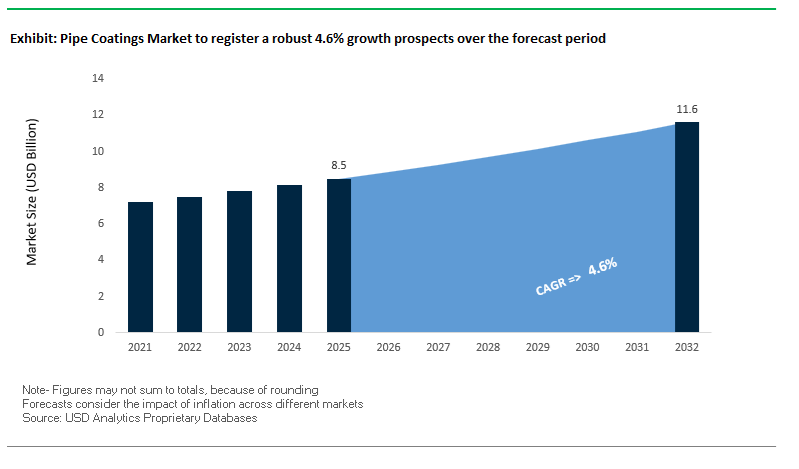
The global Pipe Coatings Market was valued at $8.5 billion in 2025 and is projected to grow at a CAGR of 4.6% through 2032, reaching $11.6 billion by 2032. This growth is driven by sustained investments in oil & gas pipelines, water infrastructure, district heating systems, and industrial fluid transport networks, where coatings are essential for corrosion protection, thermal insulation, and mechanical durability.
A key structural driver is the increasing complexity of pipeline environments, particularly in ultra-deepwater offshore fields, high-temperature operations, and chemically aggressive transport conditions. Advanced coating systems such as multi-layer polypropylene (3LPP/5LPP), fusion-bonded epoxy (FBE), polyurethane, and thermal insulation coatings are being deployed to extend pipeline lifespan and reduce maintenance costs. The growing concern around corrosion under insulation (CUI)—a major contributor to operational failures—has further intensified demand for high-performance coating technologies.
Simultaneously, the global push toward energy security and diversification, including LNG infrastructure, hydrogen pipelines, and carbon capture systems, is expanding the application scope of pipe coatings. Emerging economies in Asia-Pacific and the Middle East are investing heavily in new pipeline construction and refurbishment projects, while mature markets such as North America and Europe are focusing on pipeline integrity management and retrofitting aging infrastructure.
Another defining trend is the transition toward environmentally sustainable coating solutions, including low-VOC, solvent-free formulations, and energy-efficient application processes. Companies are increasingly adopting electrostatic application technologies and eco-phosphating pre-treatment systems to reduce waste, emissions, and environmental impact while maintaining high performance standards.
Market Analysis: Ultra-Deepwater Projects, Sustainable Manufacturing Initiatives, and Application Efficiency Driving Market Evolution
Recent developments in the Pipe Coatings Market highlight strong momentum in large-scale energy projects, sustainability initiatives, and process innovation. A landmark example is Tenaris’ Mero 4 project in Brazil, where the company began delivering TenCoat™ Marine 5LPP coatings for 81 km of risers and flowlines operating at depths of 2,100 meters. This project underscores the critical role of advanced coating systems in extreme offshore environments, combining thermal insulation with passive fire protection capabilities.
Operational efficiency and capacity optimization are also shaping market dynamics. Mattr (formerly Shawcor) completed major facility modernization efforts in February 2026, transitioning from heavy capital investment toward enhanced operational efficiency and service delivery, particularly in North America’s evolving energy landscape.
Sustainability is emerging as a key competitive differentiator. Wasco Energy’s commitment to achieving net-zero operational emissions by 2026 highlights the industry’s shift toward renewable energy integration and low-VOC coating technologies. This aligns with increasing regulatory pressure and customer demand for environmentally responsible pipeline solutions.
Product innovation is addressing critical industry challenges. PPG’s launch of Pitt-Therm 909 (April 2025) targets corrosion under insulation (CUI), a major cost driver in oil and gas operations. Additionally, PPG’s advancements in electrostatic coating application technology have demonstrated up to 35% reduction in overspray and material waste, improving both cost efficiency and environmental compliance.
Regional expansion and localization strategies are accelerating growth. Master Builders Solutions’ ramp-up of localized coating production in Saudi Arabia (March 2026) supports large-scale infrastructure initiatives under Vision 2030, while Sherwin-Williams’ expansion of its Performance Coatings Group—following the integration of Suvinil—strengthens its presence in Latin America’s industrial coatings segment.
Pre-treatment innovations are also gaining traction. BASF’s expansion of Viant® eco-phosphating technology (November 2025) addresses environmental challenges associated with sludge generation, supporting compliance with emerging manufacturing standards in Asia-Pacific.
Market Trend: 3LPP Coatings Advancing Ultra-Deepwater Pipeline Performance and Thermal Stability
The pipe coatings industry is undergoing a significant shift toward 3-layer polypropylene systems as offshore oil and gas operators expand into ultra-deepwater environments exceeding depths of 2,500 to 3,500 meters. These extreme conditions impose severe hydrostatic pressure and elevated operating temperatures, requiring advanced external pipeline coating technologies with superior thermal resistance and long-term durability.
3LPP coatings are increasingly specified over traditional 3-layer polyethylene systems due to their enhanced thermal performance. Modern 3LPP systems support continuous operating temperatures up to 140°C, compared to the typical upper limit of approximately 80°C for 3LPE coatings. This higher thermal threshold is critical for maintaining coating integrity in high-temperature subsea flowlines transporting hydrocarbons from deep reservoirs.
Cathodic disbondment resistance is another defining advantage. Premium 3LPP coatings demonstrate disbondment radii below 5 mm after 28 days under controlled testing conditions, maintaining adhesion even after extended exposure exceeding 10,000 hours in simulated deep-sea environments. This ensures effective corrosion protection and minimizes the risk of coating failure under cathodic protection systems.
Hydrostatic resilience is equally critical. In ultra-deepwater conditions, 3LPP coatings exhibit water absorption rates below 0.05%, preventing osmotic blistering caused by high external pressure. This property enhances long-term coating stability and reduces maintenance requirements in offshore pipeline systems. These combined performance characteristics are driving widespread adoption of 3LPP coatings in next-generation deepwater energy projects.
Market Trend: Dual-Layer FBE Coatings Enhancing Durability and Installation Efficiency in High-Temperature Water Pipelines
Municipal and industrial pipeline operators are increasingly adopting dual-layer fusion bonded epoxy coatings to address the challenges of high-temperature water distribution and demanding installation environments. These systems combine a corrosion-resistant base layer with an abrasion-resistant overcoat, delivering improved mechanical and thermal performance compared to traditional single-layer FBE coatings.
Dual FBE coatings provide significantly enhanced impact resistance, exceeding 20 Joules in standardized testing, compared to approximately 8 to 10 Joules for conventional systems. This increased toughness protects pipelines during transportation, handling, and backfilling, reducing the risk of coating damage prior to commissioning.
Adhesion performance remains stable even under elevated temperature conditions. Dual-layer systems maintain strong adhesion ratings during prolonged exposure to hot water environments, ensuring coating integrity at service temperatures up to 85°C. This is particularly important for high-pressure municipal water systems and industrial pipelines where thermal cycling can induce coating stress.
Installation efficiency is a key economic benefit. The abrasion-resistant overcoat enables the use of native backfill materials, including rocks up to 50 mm in size, eliminating the need for sand bedding in many projects. This reduces installation costs by approximately 15% to 20%, particularly in rocky or mountainous regions where traditional preparation methods are more resource-intensive. These advantages are accelerating the adoption of dual-layer FBE coatings across water infrastructure and industrial pipeline applications.
Market Opportunity: PHMSA Pipeline Integrity Regulations Driving Demand for High-Performance External Coatings
Regulatory developments in the United States are creating strong demand for advanced pipe coating solutions. The implementation of updated pipeline safety standards under federal regulations is increasing the focus on integrity management, particularly in high consequence areas where environmental and safety risks are elevated.
Operators are required to conduct more frequent inspections and implement advanced leak detection systems, increasing the importance of coatings that provide consistent dielectric performance and long-term corrosion protection. High-integrity coatings such as 3LPP and advanced FBE systems reduce cathodic protection current demand and enhance the effectiveness of monitoring technologies by minimizing signal interference.
The emphasis on proactive maintenance and risk mitigation is driving pipeline operators to upgrade legacy coating systems with modern, high-performance alternatives. This regulatory environment is expected to accelerate investment in advanced coating technologies that improve asset reliability and reduce long-term operational risks.
Market Opportunity: China Water Infrastructure Standards Driving Large-Scale Adoption of Advanced Pipe Coating Systems
China’s implementation of updated national standards for water supply infrastructure is creating a substantial opportunity for the pipe coatings industry. The revised framework introduces stricter requirements for pressure resistance, material safety, and long-term durability in pipeline systems used for urban water distribution and large-scale diversion projects.
For high-pressure pipelines operating above 2.5 MPa, the standards mandate the use of advanced external coatings such as 3-layer polyethylene or dual-layer fusion bonded epoxy systems. This requirement is driving a large-scale upgrade cycle across urban water networks, particularly in rapidly developing metropolitan regions.
Internal coating specifications are also evolving. The introduction of strict limits on total organic carbon leaching is eliminating the use of legacy materials such as coal-tar epoxy linings. This is creating demand for solvent-free, high-purity epoxy systems that ensure compliance with water safety regulations while maintaining corrosion resistance.
The scale of infrastructure investment under national development initiatives is significant. Government programs targeting reduced water leakage and improved distribution efficiency are driving the replacement of aging pipeline networks with coated steel systems. This transition is expected to generate sustained demand for high-performance pipe coatings across municipal and industrial applications.
Pipe Coatings Market Share and Segmentation Insights
External Coatings Capture 68.4% Share Driven by Buried and Subsea Pipeline Protection Needs
The pipe coatings market by surface location is led by external pipe coatings, accounting for 68.4% of global market share in 2025, due to their essential role in protecting pipelines from harsh environmental exposure. External coatings such as fusion bonded epoxy (FBE), 3-layer polyethylene (3LPE), 3-layer polypropylene (3LPP), coal tar epoxy, and polyurethane coatings are widely used to safeguard pipelines against soil corrosion, moisture ingress, cathodic disbondment, and mechanical damage during installation and operation. Since external corrosion remains the primary cause of pipeline failure, these coatings act as the first line of defense, often applied in thicker, multi-layer systems compared to internal coatings. With increasing investments in oil & gas pipelines, water infrastructure, and subsea transmission networks, demand for high-performance external pipe coatings continues to dominate the global pipeline protection coatings market.
Steel Pipes Hold 74.5% Share Due to Corrosion Susceptibility and Structural Strength
In the pipe coatings market by pipe type, steel pipes dominate with a 74.5% market share in 2025, driven by their extensive use in high-pressure, long-distance oil, gas, and water transmission systems. Steel offers superior mechanical strength and durability, making it the preferred material for both onshore and offshore pipeline infrastructure. However, carbon steel is highly susceptible to corrosion when exposed to moisture and aggressive environments, necessitating the application of advanced coatings such as FBE, 3LPE, and polypropylene systems to ensure long-term performance. Unlike plastic or ductile iron alternatives, steel pipelines require mandatory protective coatings to prevent degradation and extend service life. As global energy demand and infrastructure development expand, steel pipes continue to drive growth in the pipeline coatings and corrosion protection market, reinforcing their dominant position.
Competitive Landscape of the Pipe Coatings Market
AkzoNobel Leads Sustainable Pipe Coatings Innovation with Bio-Based Powder Technologies
AkzoNobel N.V. remains a dominant player in the pipe coatings market, leveraging its global scale and strong performance coatings portfolio. In Q1 2026, the company reported an adjusted EBITDA of €345 million with a 14.5% margin, supported by disciplined pricing strategies. Its planned merger with Axalta is expected to significantly enhance its R&D capabilities in pipe coatings. AkzoNobel has introduced Interpon D low-cure powder coatings developed with BASF, incorporating bio-attributed raw materials to reduce carbon footprint. Its “Rhythm of Blues” initiative focuses on AI-driven coating optimization, enabling enhanced anti-corrosion performance across diverse pipeline environments.
PPG Strengthens Market Leadership with Graphene-Enhanced Coatings and Hydrogen Pipeline Solutions
PPG Industries, Inc. is a key player in the global pipe coatings market, particularly in external coatings, which account for over 78% of total market volume. In 2026, the company implemented price increases while expanding R&D investments to address cost pressures and improve coating performance. PPG is pioneering graphene-infused epoxy coatings, which reduce water permeation by 40% and significantly enhance resistance to cathodic disbondment. It is also a major supplier for Europe’s hydrogen backbone infrastructure, providing coatings that resist hydrogen embrittlement, a critical requirement in energy transition projects.
Sherwin-Williams Expands Global Presence with High-Performance Epoxy Coating Systems
The Sherwin-Williams Company is a leading force in the pipe coatings market, supported by its strong Protective & Marine division. Following the acquisition of Suvinil, the company has expanded its presence in Latin America’s growing pipeline infrastructure market. Its Nova-Plate® and Pipeclad® product lines remain industry benchmarks for high-build epoxy coatings, particularly in sour-service pipelines and high-abrasion applications. Sherwin-Williams is also shifting toward waterborne formulations, aligning with the growing demand for eco-friendly coatings, which is expanding at 20% annually. Its strong financial position supports continued investment in R&D and regional expansion.
Jotun Drives Regional Leadership with Sustainable Powder Coatings and Lifecycle Solutions
Jotun Group is a dominant player in the pipe coatings market, particularly in the Middle East and Asia-Pacific regions. With over 40 production facilities worldwide, the company offers localized coating solutions tailored to regional conditions. Its GreenSteps program provides a comprehensive lifecycle approach, ensuring compliance across global markets. Jotun is focusing on powder coatings as eco-friendly alternatives to solvent-based systems, along with fast-curing technologies for large-scale infrastructure. Its innovation in sensor-based technologies is also being adapted for automated pipe inspection and coating processes, enhancing operational efficiency and asset management.
Shawcor (Mattr) Leads Integrated Pipeline Solutions with Multi-Layer Coating Technologies
Shawcor, now transitioning under the Mattr brand, is a specialist in integrated pipe coating and performance solutions, particularly for offshore and subsea applications. The company excels in multi-layer polyolefin systems such as 3LPE and 3LPP coatings, as well as concrete weight coatings for deepwater pipelines. It is also shifting toward non-metallic composite materials to address corrosion challenges in carbon capture and storage infrastructure. Shawcor’s mobile coating plants enable on-site application, reducing logistics costs and environmental impact, making it a leader in end-to-end pipeline integrity solutions.
Hempel Strengthens High-Performance Pipe Coatings with Advanced Adhesion and Sustainability Solutions
Hempel A/S is a key player in the pipe coatings market, focusing on advanced anti-corrosion technologies and sustainability. Its “Double for Tomorrow” strategy aims to drive significant growth in energy and infrastructure segments. In 2026, the company introduced the Nexus series, a next-generation tie-coat technology that improves adhesion in multi-layer systems under extreme temperature conditions ranging from -40°C to +150°C. Hempel is also expanding its presence in Asia-Pacific through localized service centers. Its commitment to solvent-free, high-solids epoxy coatings aligns with global environmental goals, reinforcing its position in sustainable and high-performance pipeline coatings.
United States Pipe Coatings Market: Shale Expansion and EPA-Driven Sustainability Transition
The United States pipe coatings market is being reshaped by the dual impact of shale gas expansion and stringent environmental regulations. The implementation of the EPA NESHAP 2027 mandate is accelerating the phase-out of hexavalent chromium, driving increased adoption of PVD-based metallic pipe coatings, fusion bonded epoxy (FBE), and high-solid epoxy systems. This regulatory shift is fundamentally transforming coating technologies across oil & gas and infrastructure sectors.
Federal investments under the Infrastructure Investment and Jobs Act (IIJA) are fueling large-scale water system modernization, including the replacement of legacy pipelines with cement-mortar lined and FBE-coated steel pipes. Additionally, strong activity in the Permian Basin is driving demand for 3-layer polyethylene (3LPE) coatings in newly installed gathering lines. Innovations such as internal epoxy linings are improving flow efficiency and reducing methane emissions, while offshore projects in the Gulf of Mexico are increasingly specifying advanced insulation coatings to support deepwater operations.
China Pipe Coatings Market: Deep-Sea Exploration and Green Manufacturing Mandates
China remains the global leader in volume within the pipe coatings market, with a strategic shift toward high-performance and environmentally sustainable solutions. The enforcement of GB 30981.1-2025 has mandated the adoption of waterborne and powder-based coatings, significantly reducing VOC emissions across major industrial hubs.
The country is also advancing in deep-sea and marine applications, as demonstrated by large-scale contracts for ultra-durable protective coatings on drilling vessels operating at extreme ocean depths. Infrastructure megaprojects like the West-East Gas Pipeline Phase IV are utilizing dual-layer FBE coatings to ensure long-term durability under harsh environmental conditions. Furthermore, innovations such as graphene-enhanced epoxy coatings are improving corrosion resistance, while smart coating technologies integrating fiber-optic sensors are enabling real-time monitoring of pipeline integrity.
Germany Pipe Coatings Market: Hydrogen Infrastructure and Circular Economy Leadership
Germany is at the forefront of innovation in the pipe coatings market, particularly in hydrogen infrastructure and sustainable energy systems. As a central player in the European Hydrogen Backbone (EHB) initiative, Germany is developing advanced coatings designed to prevent hydrogen embrittlement and permeation, ensuring pipeline safety and longevity.
Technologies such as the “White Jacket” dual-polymer coating system are being introduced for hydrogen and CCUS pipelines, offering enhanced mechanical strength and thermal insulation. The expansion of offshore wind projects is also driving demand for reinforced polypropylene coatings for subsea cables and pipes. Germany’s alignment with the EU Green Deal is promoting lifecycle tracking through digital product passports, while innovations in HiPIMS-based metallic coatings are enabling ultra-dense protective layers for hydrogen distribution systems.
India Pipe Coatings Market: Gas Infrastructure Expansion and Localization Initiatives
India’s pipe coatings market is experiencing rapid growth, supported by the government’s push toward a gas-based economy and large-scale pipeline infrastructure development. Investments such as the Paradip Petrochemical Complex are driving demand for 3-layer polypropylene (3LPP) coatings capable of handling high-temperature petroleum and chemical transport.
The expansion of City Gas Distribution (CGD) networks is increasing the installation of pipelines using polyethylene-based coatings for safety and durability. Major projects like the Mundra-Panipat pipeline are utilizing FBE coatings with concrete weight coatings for enhanced stability in challenging terrains. Additionally, India is advancing in cross-border pipeline development and green hydrogen initiatives, where specialized internal coatings are critical for high-pressure gas transport. Localization efforts under the Make in India initiative are also strengthening domestic production of coating equipment, reducing import dependency and supporting long-term industry growth.
Saudi Arabia Pipe Coatings Market: Vision 2030 and Non-Metallic Pipeline Innovation
Saudi Arabia is transforming its pipe coatings market under the ambitious Vision 2030 strategy, focusing on large-scale gas infrastructure and localized manufacturing. The expansion of the Master Gas System (MGS) Phase 3 is generating significant demand for dual-layer fusion bonded epoxy coatings and advanced internal flow coatings.
The Kingdom is also shifting toward non-metallic pipeline solutions, such as thermoplastic composite pipes (TCP), which reduce the need for traditional coatings while improving corrosion resistance. Projects like Jafurah are driving the adoption of abrasion-resistant coatings for challenging environments, while the IKTVA program is promoting domestic production of key coating materials. Smart infrastructure developments such as NEOM are integrating IoT-enabled pipeline coatings, enhancing monitoring and operational efficiency in next-generation urban ecosystems.
Brazil Pipe Coatings Market: Deepwater Oil & Gas Expansion and Advanced Subsea Technologies
Brazil’s pipe coatings market is heavily driven by offshore oil & gas developments, particularly in the pre-salt deepwater fields. Projects such as the Equinor Raia Gas development and the expansion of the Búzios field are creating strong demand for high-performance epoxy and polyurethane coatings capable of withstanding extreme pressures and corrosive conditions.
Technological advancements include the adoption of CO₂-resistant internal coatings for subsea pipelines, critical for handling high CO₂ content in offshore gas streams. Brazil is also advancing in electrified subsea systems, requiring specialized dielectric coatings for high-voltage environments. The deployment of robotic inspection technologies for coating integrity is further improving maintenance efficiency and safety. Local content requirements are encouraging domestic production of coated pipes, strengthening Brazil’s industrial ecosystem.
Canada Pipe Coatings Market: Oil Sands Maintenance and Arctic-Grade Innovations
Canada’s pipe coatings market is characterized by its focus on maintaining extensive oil sands infrastructure and adapting to extreme environmental conditions. Large-scale infrastructure integrity programs are driving demand for rubber-lined and ceramic-epoxy hybrid coatings to extend the lifespan of tailings pipelines.
The drilling sector is also increasing demand for internal plastic coatings (IPC) for drill pipes, supporting growing exploration activities. Canada is a leader in Arctic-grade coating technologies, with polyethylene coatings designed to maintain flexibility and adhesion at temperatures as low as -45°C. Additionally, government initiatives aimed at reducing methane emissions are promoting the use of advanced internal flow coatings to minimize leakage. Collaborative projects such as the Cedar LNG development highlight the importance of sustainable pipeline infrastructure and partnerships with Indigenous communities in shaping the future of the Canadian pipe coatings industry.
Pipe Coatings Market Report Scope
Pipe Coatings Market
|
Parameter
|
Details
|
|
Market Size (2025)
|
$8.5 Billion
|
|
Market Size (2032)
|
$11.6 Billion
|
|
Market Growth Rate
|
4.6%
|
|
Segments
|
By Material (Fusion Bonded Epoxy, Thermoplastic Polymer Coatings, Polyurethane, Liquid Epoxy, Bituminous, Concrete Weight Coatings, Specialty), By Technology (Single-Layer Coatings, Multi-Layer Coatings, Composite Coatings), By Surface Location (External Pipe Coatings, Internal Pipe Coatings), By Formulation (Powder Coatings, Solvent-borne Liquid Coatings, Water-borne Liquid Coatings, Radiation-Cured), By End-Use Industry (Oil and Gas, Water and Wastewater, Chemical Processing, Mining, Agriculture and Irrigation, Power Generation), By Functionality (Corrosion Protection, Mechanical, Thermal Insulation, Chemical, Flow Assurance), By Pipe Type (Steel Pipes, Ductile Iron Pipes, Plastic)
|
|
Study Period
|
2019- 2025 and 2026-2032
|
|
Units
|
Revenue (USD)
|
|
Qualitative Analysis
|
Porter’s Five Forces, SWOT Profile, Market Share, Scenario Forecasts, Market Ecosystem, Company Ranking, Market Dynamics, Industry Benchmarking
|
|
Companies
|
Shawcor Ltd., The Sherwin-Williams Company, PPG Industries, Inc., Akzo Nobel N.V., Jotun A/S, Axalta Coating Systems Ltd., Wasco Energy Group of Companies, Hempel A/S, BASF SE, Tenaris S.A., 3M Company, Arkema S.A., Nippon Paint Holdings Co., Ltd., Winn and Coales, Aegion Corporation
|
|
Countries
|
US, Canada, Mexico, Germany, France, Spain, Italy, UK, Russia, China, India, Japan, South Korea, Australia, South East Asia, Brazil, Argentina, Middle East, Africa
|
Pipe Coatings Market Segmentation
By Material
- Fusion Bonded Epoxy
- Thermoplastic Polymer Coatings
- Polyurethane
- Liquid Epoxy
- Bituminous
- Concrete Weight Coatings
- Specialty
By Technology
- Single-Layer Coatings
- Multi-Layer Coatings
- Composite Coatings
By Surface Location
- External Pipe Coatings
- Internal Pipe Coatings
By Formulation
- Powder Coatings
- Solvent-borne Liquid Coatings
- Water-borne Liquid Coatings
- Radiation-Cured
By End-Use Industry
- Oil and Gas
- Water and Wastewater
- Chemical Processing
- Mining
- Agriculture and Irrigation
- Power Generation
By Functionality
- Corrosion Protection
- Mechanical
- Thermal Insulation
- Chemical
- Flow Assurance
By Pipe Type
- Steel Pipes
- Ductile Iron Pipes
- Plastic
Leading Countries in the Industry
- North America (United States, Canada, Mexico)
- Europe (Germany, France, Spain, United Kingdom, Italy, Russia, Rest of Europe)
- Asia Pacific (China, India, Japan, South Korea, Australia, South East Asia, Rest of APAC)
- South and Central America (Brazil, Argentina, Rest of SCA)
- Middle East and Africa (Saudi Arabia, UAE, MENA, Sub-Saharan Africa)
Top Companies in Pipe Coatings Industry
- Shawcor Ltd.
- The Sherwin-Williams Company
- PPG Industries, Inc.
- Akzo Nobel N.V.
- Jotun A/S
- Axalta Coating Systems Ltd.
- Wasco Energy Group of Companies
- Hempel A/S
- BASF SE
- Tenaris S.A.
- 3M Company
- Arkema S.A.
- Nippon Paint Holdings Co., Ltd.
- Winn & Coales
- Aegion Corporation
*- List not Exhaustive
