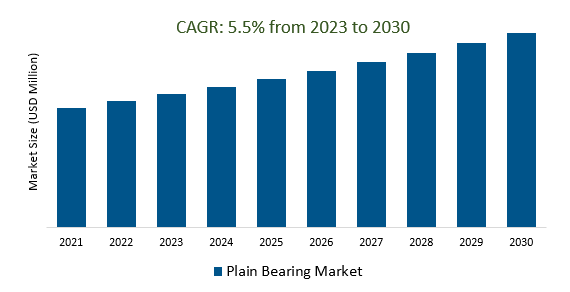
The Global Plain Bearing Market Size is estimated to register 5.5% growth over the forecast period from 2023 to 2030.
The market growth is driven by the increasing demand for tailor-made plain bearings to meet specific application requirements is driving manufacturers to offer customized solutions. Leading Companies that are focusing on Technological Advancements, Smart Bearings and IoT Integration, Sustainability and Environmental Concerns, Electric Vehicles (EVs) and Alternative Energy, Aerospace and Defense, Globalization and Trade, Automated Manufacturing and Robotics, and others to boost market shares in the industry.
Market Overview
The plain bearing market involves a range of manufacturers providing essential components to reduce friction and support machinery across industries. These simple yet crucial bearings come in various types and materials, serving applications in automotive, manufacturing, aerospace, and more. Market growth is driven by technological advancements, sustainability concerns, customization, IoT integration, globalization, and emerging markets. Challenges include intense competition, stringent regulations, and the presence of counterfeit products.
Market Dynamics
Market Trends - The increasing demand for self-lubricating bearings is driving the growth of the plain bearing market.
The plain bearing market is experiencing significant growth due to the rising demand for self-lubricating bearings. These innovative bearings require minimal maintenance and offer extended service life, making them a cost-effective and efficient choice for various industries. As businesses seek to reduce downtime and enhance operational efficiency, self-lubricating bearings have gained prominence for their ability to lower friction, improve performance, and reduce the need for constant manual lubrication. This trend underscores a shift towards more sustainable and maintenance-friendly solutions in the plain bearing market, meeting the evolving needs of modern industrial applications.
Market Driver- Advancements in Material Technology demand for the Plain Bearing Market
Advancements in material technology are serving as a driving force for the plain bearing market. Innovations in bearing materials, such as the development of advanced composites and polymers, are enhancing the performance and durability of plain bearings. These materials are not only providing higher load-carrying capacities and increased wear resistance but are also contributing to improved energy efficiency, making them a valuable choice across a range of industries. As technology continues to evolve, the demand for next-generation materials in plain bearings is expected to rise, reflecting a market trend that prioritizes enhanced performance and extended product lifespan.
Market Opportunity- The growth of the industry is driving demand for plain bearings
The growth of various industrial sectors is spurring demand for plain bearings. As industries such as automotive, manufacturing, aerospace, and energy continue to expand, the need for machinery and equipment that relies on plain bearings to reduce friction and support moving parts is on the rise. This demand is fueled by the necessity for smooth and efficient operations, and plain bearings play a crucial role in achieving these objectives across a wide spectrum of applications. As industrial activities expand, the plain bearing market is expected to grow in tandem, underlining its significance in facilitating the functioning of vital machinery and equipment within various industries.
The Global Plain Bearing Market is analyzed across Journal, Linear, Thrust, Angular Contact, Others, and others. Journal is poised to register the fastest growth. The Journal Plain Bearing Market involves critical components used in various industries to support rotating shafts and reduce friction. Key drivers include technological advancements, material innovations, customization, sustainability, and energy efficiency. These bearings are integral to engine and machinery operation, impacting the market's growth in response to economic conditions and industrial expansion. Compliance with stringent regulations in critical applications, emerging markets, globalization, and material technology advancements also shape this market. To obtain the latest information, consulting up-to-date sources is recommended.
Market Share Analysis- Industrial held a significant market share in 2023
The Global Plain Bearing Market is analyzed across various applications including Automotive, Industrial, Aerospace, Energy, Machinery, Agriculture, and others. Of these, industrial held a significant market share in 2023. Plain bearings are integral in the industrial sector, extensively used to reduce friction and support rotating machine parts. They play a crucial role in various industries, including manufacturing, automotive, aerospace, energy, construction, and mining, contributing to the smooth operation of machinery and equipment like conveyor systems, pumps, engines, and heavy machinery. Their demand in the industrial sector is closely linked to economic and industrial activity, underscoring their significance in the broader plain bearing market.
Plain Bearing Market Segmentation
By Type
- Journal
- Linear
- Thrust
- Angular Contact
- Others
By End-User
- Automotive
- Industrial
- Aerospace
- Energy
- Machinery
- Agriculture
- Others
By Region
- North America (United States, Canada, Mexico)
- Europe (Germany, France, United Kingdom, Spain, Italy, Others)
- Asia Pacific (China, India, Japan, South Korea, Australia, Others)
- Latin America (Brazil, Argentina, Others)
- Middle East and Africa (Saudi Arabia, UAE, Kuwait, Other Middle East, South Africa, Nigeria, Other Africa)
Plain Bearing Market Companies
- THK Co., Ltd. (Japan)
- Schaeffler Group (Germany)
- SKF Group (Sweden)
- NSK Ltd. (Japan)
- MinebeaMitsumi Inc. (Japan)
- RBC Bearings Inc (United States)
- NTN Corporation (Japan)
- SGL Carbon (Germany)
- Timken Company (United States)
- GGB (France)
- Kashima Bearings, Inc (Japan)
- Boston Gear LLC (United States)
- Thomson Industries Inc (United States)
- PBC Linear (United States)
- GGT Gleitlager AG (Switzerland)
- Kingsbury Inc (United States)
- Midwest Control Products Corp. (United States)
- Chiavette Unificate S.p.A. (Italy)
- HepcoMotion (United Kingdom)
- Alloy Bearings (New Zealand)
- Accurate Bushing Company (United States)
- ZOLLERN GmbH & Co. KG (Germany)
- ElringKlinger AG (Germany)
- AEC (India)
*List not exhaustive
Plain Bearing Market Outlook 2023
1 Market Overview
1.1 Introduction to the Plain Bearing Market
1.2 Scope of the Study
1.3 Research Objective
1.3.1 Key Market Scope and Segments
1.3.2 Players Covered
1.3.3 Years Considered
2 Executive Summary
2.1 2023 Plain Bearing Industry- Market Statistics
3 Market Dynamics
3.1 Market Drivers
3.2 Market Challenges
3.3 Market Opportunities
3.4 Market Trends
4 Market Factor Analysis
4.1 Porter’s Five Forces
4.2 Market Entropy
4.2.1 Global Plain Bearing Market Companies with Area Served
4.2.2 Products Offerings Global Plain Bearing Market
5 COVID-19 Impact Analysis and Outlook Scenarios
5.1.1 Covid-19 Impact Analysis
5.1.2 post-COVID-19 Scenario- Low Growth Case
5.1.3 post-COVID-19 Scenario- Reference Growth Case
5.1.4 post-COVID-19 Scenario- Low Growth Case
6 Global Plain Bearing Market Trends
6.1 Global Plain Bearing Revenue (USD Million) and CAGR (%) by Type (2018-2030)
6.2 Global Plain Bearing Revenue (USD Million) and CAGR (%) by Applications (2018-2030)
6.3 Global Plain Bearing Revenue (USD Million) and CAGR (%) by regions (2018-2030)
7 Global Plain Bearing Market Revenue (USD Million) by Type, and Applications (2018-2022)
7.1 Global Plain Bearing Revenue (USD Million) by Type (2018-2022)
7.1.1 Global Plain Bearing Revenue (USD Million), Market Share (%) by Type (2018-2022)
7.2 Global Plain Bearing Revenue (USD Million) by Applications (2018-2022)
7.2.1 Global Plain Bearing Revenue (USD Million), Market Share (%) by Applications (2018-2022)
8 Global Plain Bearing Development Regional Status and Outlook
8.1 Global Plain Bearing Revenue (USD Million) By Regions (2018-2022)
8.2 North America Plain Bearing Revenue (USD Million) by Type, and Application (2018-2022)
8.2.1 North America Plain Bearing Revenue (USD Million) by Country (2018-2022)
8.2.2 North America Plain Bearing Revenue (USD Million) by Type (2018-2022)
8.2.3 North America Plain Bearing Revenue (USD Million) by Applications (2018-2022)
8.3 Europe Plain Bearing Revenue (USD Million), by Type, and Applications (USD Million) (2018-2022)
8.3.1 Europe Plain Bearing Revenue (USD Million), by Country (2018-2022)
8.3.2 Europe Plain Bearing Revenue (USD Million) by Type (2018-2022)
8.3.3 Europe Plain Bearing Revenue (USD Million) by Applications (2018-2022)
8.4 Asia Pacific Plain Bearing Revenue (USD Million), and Revenue (USD Million) by Type, and Applications (2018-2022)
8.4.1 Asia Pacific Plain Bearing Revenue (USD Million) by Country (2018-2022)
8.4.2 Asia Pacific Plain Bearing Revenue (USD Million) by Type (2018-2022)
8.4.3 Asia Pacific Plain Bearing Revenue (USD Million) by Applications (2018-2022)
8.5 South America Plain Bearing Revenue (USD Million), by Type, and Applications (2018-2022)
8.5.1 South America Plain Bearing Revenue (USD Million), by Country (2018-2022)
8.5.2 South America Plain Bearing Revenue (USD Million) by Type (2018-2022)
8.5.3 South America Plain Bearing Revenue (USD Million) by Applications (2018-2022)
8.6 Middle East and Africa Plain Bearing Revenue (USD Million), by Type, Technology, Application, Thickness (2018-2022)
8.6.1 Middle East and Africa Plain Bearing Revenue (USD Million) by Country (2018-2022)
8.6.2 Middle East and Africa Plain Bearing Revenue (USD Million) by Type (2018-2022)
8.6.3 Middle East and Africa Plain Bearing Revenue (USD Million) by Applications (2018-2022)
9 Company Profiles
10 Global Plain Bearing Market Revenue (USD Million), by Type, and Applications (2023-2030)
10.1 Global Plain Bearing Revenue (USD Million) and Market Share (%) by Type (2023-2030)
10.1.1 Global Plain Bearing Revenue (USD Million), and Market Share (%) by Type (2023-2030)
10.2 Global Plain Bearing Revenue (USD Million) and Market Share (%) by Applications (2023-2030)
10.2.1 Global Plain Bearing Revenue (USD Million), and Market Share (%) by Applications (2023-2030)
11 Global Plain Bearing Development Regional Status and Outlook Forecast
11.1 Global Plain Bearing Revenue (USD Million) By Regions (2023-2030)
11.2 North America Plain Bearing Revenue (USD Million) by Type, and Applications (2023-2030)
11.2.1 North America Plain Bearing Revenue (USD) Million by Country (2023-2030)
11.2.2 North America Plain Bearing Revenue (USD Million), by Type (2023-2030)
11.2.3 North America Plain Bearing Revenue (USD Million), Market Share (%) by Applications (2023-2030)
11.3 Europe Plain Bearing Revenue (USD Million), by Type, and Applications (2023-2030)
11.3.1 Europe Plain Bearing Revenue (USD Million), by Country (2023-2030)
11.3.2 Europe Plain Bearing Revenue (USD Million), by Type (2023-2030)
11.3.3 Europe Plain Bearing Revenue (USD Million), by Applications (2023-2030)
11.4 Asia Pacific Plain Bearing Revenue (USD Million) by Type, and Applications (2023-2030)
11.4.1 Asia Pacific Plain Bearing Revenue (USD Million), by Country (2023-2030)
11.4.2 Asia Pacific Plain Bearing Revenue (USD Million), by Type (2023-2030)
11.4.3 Asia Pacific Plain Bearing Revenue (USD Million), by Applications (2023-2030)
11.5 South America Plain Bearing Revenue (USD Million), by Type, and Applications (2023-2030)
11.5.1 South America Plain Bearing Revenue (USD Million), by Country (2023-2030)
11.5.2 South America Plain Bearing Revenue (USD Million), by Type (2023-2030)
11.5.3 South America Plain Bearing Revenue (USD Million), by Applications (2023-2030)
11.6 Middle East and Africa Plain Bearing Revenue (USD Million), by Type, and Applications (2023-2030)
11.6.1 Middle East and Africa Plain Bearing Revenue (USD Million), by region (2023-2030)
11.6.2 Middle East and Africa Plain Bearing Revenue (USD Million), by Type (2023-2030)
11.6.3 Middle East and Africa Plain Bearing Revenue (USD Million), by Applications (2023-2030)
12 Methodology and Data Sources
12.1 Methodology/Research Approach
12.1.1 Research Programs/Design
12.1.2 Market Size Estimation
12.1.3 Market Breakdown and Data Triangulation
12.2 Data Sources
12.2.1 Secondary Sources
12.2.2 Primary Sources
12.3 Disclaimer
List of Tables
Table 1 Market Segmentation Analysis
Table 2 Global Plain Bearing Market Companies with Areas Served
Table 3 Products Offerings Global Plain Bearing Market
Table 4 Low Growth Scenario Forecasts
Table 5 Reference Case Growth Scenario
Table 6 High Growth Case Scenario
Table 7 Global Plain Bearing Revenue (USD Million) And CAGR (%) By Type (2018-2030)
Table 8 Global Plain Bearing Revenue (USD Million) And CAGR (%) By Applications (2018-2030)
Table 9 Global Plain Bearing Revenue (USD Million) And CAGR (%) By Regions (2018-2030)
Table 10 Global Plain Bearing Revenue (USD Million) By Type (2018-2022)
Table 11 Global Plain Bearing Revenue Market Share (%) By Type (2018-2022)
Table 12 Global Plain Bearing Revenue (USD Million) By Applications (2018-2022)
Table 13 Global Plain Bearing Revenue Market Share (%) By Applications (2018-2022)
Table 14 Global Plain Bearing Market Revenue (USD Million) By Regions (2018-2022)
Table 15 Global Plain Bearing Market Share (%) By Regions (2018-2022)
Table 16 North America Plain Bearing Revenue (USD Million) By Country (2018-2022)
Table 17 North America Plain Bearing Revenue (USD Million) By Type (2018-2022)
Table 18 North America Plain Bearing Revenue (USD Million) By Applications (2018-2022)
Table 19 Europe Plain Bearing Revenue (USD Million) By Country (2018-2022)
Table 20 Europe Plain Bearing Revenue (USD Million) By Type (2018-2022)
Table 21 Europe Plain Bearing Revenue (USD Million) By Applications (2018-2022)
Table 22 Asia Pacific Plain Bearing Revenue (USD Million) By Country (2018-2022)
Table 23 Asia Pacific Plain Bearing Revenue (USD Million) By Type (2018-2022)
Table 24 Asia Pacific Plain Bearing Revenue (USD Million) By Applications (2018-2022)
Table 25 South America Plain Bearing Revenue (USD Million) By Country (2018-2022)
Table 26 South America Plain Bearing Revenue (USD Million) By Type (2018-2022)
Table 27 South America Plain Bearing Revenue (USD Million) By Applications (2018-2022)
Table 28 Middle East and Africa Plain Bearing Revenue (USD Million) By Region (2018-2022)
Table 29 Middle East and Africa Plain Bearing Revenue (USD Million) By Type (2018-2022)
Table 30 Middle East and Africa Plain Bearing Revenue (USD Million) By Applications (2018-2022)
Table 31 Financial Analysis
Table 32 Global Plain Bearing Revenue (USD Million) By Type (2023-2030)
Table 33 Global Plain Bearing Revenue Market Share (%) By Type (2023-2030)
Table 34 Global Plain Bearing Revenue (USD Million) By Applications (2023-2030)
Table 35 Global Plain Bearing Revenue Market Share (%) By Applications (2023-2030)
Table 36 Global Plain Bearing Market Revenue (USD Million), And Revenue (USD Million) By Regions (2023-2030)
Table 37 North America Plain Bearing Revenue (USD)By Country (2023-2030)
Table 38 North America Plain Bearing Revenue (USD Million) By Type (2023-2030)
Table 39 North America Plain Bearing Revenue (USD Million) By Applications (2023-2030)
Table 40 Europe Plain Bearing Revenue (USD Million) By Country (2023-2030)
Table 41 Europe Plain Bearing Revenue (USD Million) By Type (2023-2030)
Table 42 Europe Plain Bearing Revenue (USD Million) By Applications (2023-2030)
Table 43 Asia Pacific Plain Bearing Revenue (USD Million) By Country (2023-2030)
Table 44 Asia Pacific Plain Bearing Revenue (USD Million) By Type (2023-2030)
Table 45 Asia Pacific Plain Bearing Revenue (USD Million) By Applications (2023-2030)
Table 46 South America Plain Bearing Revenue (USD Million) By Country (2023-2030)
Table 47 South America Plain Bearing Revenue (USD Million) By Type (2023-2030)
Table 48 South America Plain Bearing Revenue (USD Million) By Applications (2023-2030)
Table 49 Middle East and Africa Plain Bearing Revenue (USD Million) By Region (2023-2030)
Table 50 Middle East and Africa Plain Bearing Revenue (USD Million) By Region (2023-2030)
Table 51 Middle East and Africa Plain Bearing Revenue (USD Million) By Type (2023-2030)
Table 52 Middle East and Africa Plain Bearing Revenue (USD Million) By Applications (2023-2030)
Table 53 Research Programs/Design for This Report
Table 54 Key Data Information from Secondary Sources
Table 55 Key Data Information from Primary Sources
List of Figures
Figure 1 Market Scope
Figure 2 Porter’s Five Forces
Figure 3 Global Plain Bearing Revenue (USD Million) By Type (2018-2022)
Figure 4 Global Plain Bearing Revenue Market Share (%) By Type (2022)
Figure 5 Global Plain Bearing Revenue (USD Million) By Applications (2018-2022)
Figure 6 Global Plain Bearing Revenue Market Share (%) By Applications (2022)
Figure 7 Global Plain Bearing Market Revenue (USD Million) By Regions (2018-2022)
Figure 8 Global Plain Bearing Market Share (%) By Regions (2022)
Figure 9 North America Plain Bearing Revenue (USD Million) By Country (2018-2022)
Figure 10 North America Plain Bearing Revenue (USD Million) By Type (2018-2022)
Figure 11 North America Plain Bearing Revenue (USD Million) By Applications (2018-2022)
Figure 12 Europe Plain Bearing Revenue (USD Million) By Country (2018-2022)
Figure 13 Europe Plain Bearing Revenue (USD Million) By Type (2018-2022)
Figure 14 Europe Plain Bearing Revenue (USD Million) By Applications (2018-2022)
Figure 15 Asia Pacific Plain Bearing Revenue (USD Million) By Country (2018-2022)
Figure 16 Asia Pacific Plain Bearing Revenue (USD Million) By Type (2018-2022)
Figure 17 Asia Pacific Plain Bearing Revenue (USD Million) By Applications (2018-2022)
Figure 18 South America Plain Bearing Revenue (USD Million) By Country (2018-2022)
Figure 19 South America Plain Bearing Revenue (USD Million) By Type (2018-2022)
Figure 20 South America Plain Bearing Revenue (USD Million) By Applications (2018-2022)
Figure 21 Middle East and Africa Plain Bearing Revenue (USD Million) By Region (2018-2022)
Figure 22 Middle East and Africa Plain Bearing Revenue (USD Million) By Type (2018-2022)
Figure 23 Middle East and Africa Plain Bearing Revenue (USD Million) By Applications (2018-2022)
Figure 24 Global Plain Bearing Revenue (USD Million) By Type (2023-2030)
Figure 25 Global Plain Bearing Revenue Market Share (%) By Type (2030)
Figure 26 Global Plain Bearing Revenue (USD Million) By Applications (2023-2030)
Figure 27 Global Plain Bearing Revenue Market Share (%) By Applications (2030)
Figure 28 Global Plain Bearing Market Revenue (USD Million) By Regions (2023-2030)
Figure 29 North America Plain Bearing Revenue (USD Million) By Country (2023-2030)
Figure 30 North America Plain Bearing Revenue (USD Million) By Type (2023-2030)
Figure 31 North America Plain Bearing Revenue (USD Million) By Applications (2023-2030)
Figure 32 Europe Plain Bearing Revenue (USD Million) By Country (2023-2030)
Figure 33 Europe Plain Bearing Revenue (USD Million) By Type (2023-2030)
Figure 34 Europe Plain Bearing Revenue (USD Million) By Applications (2023-2030)
Figure 35 Asia Pacific Plain Bearing Revenue (USD Million) By Country (2023-2030)
Figure 36 Asia Pacific Plain Bearing Revenue (USD Million) By Type (2023-2030)
Figure 37 Asia Pacific Plain Bearing Revenue (USD Million) By Applications (2023-2030)
Figure 38 South America Plain Bearing Revenue (USD Million) By Country (2023-2030)
Figure 39 South America Plain Bearing Revenue (USD Million) By Type (2023-2030)
Figure 40 South America Plain Bearing Revenue (USD Million) By Applications (2023-2030)
Figure 41 Middle East and Africa Plain Bearing Revenue (USD Million) By Region (2023-2030)
Figure 42 Middle East and Africa Plain Bearing Revenue (USD Million) By Region (2023-2030)
Figure 43 Middle East and Africa Plain Bearing Revenue (USD Million) By Type (2023-2030)
Figure 44 Middle East and Africa Plain Bearing Revenue (USD Million) By Applications (2023-2030)
Figure 45 Bottom-Up and Top-Down Approaches for This Report
Figure 46 Data Triangulation
