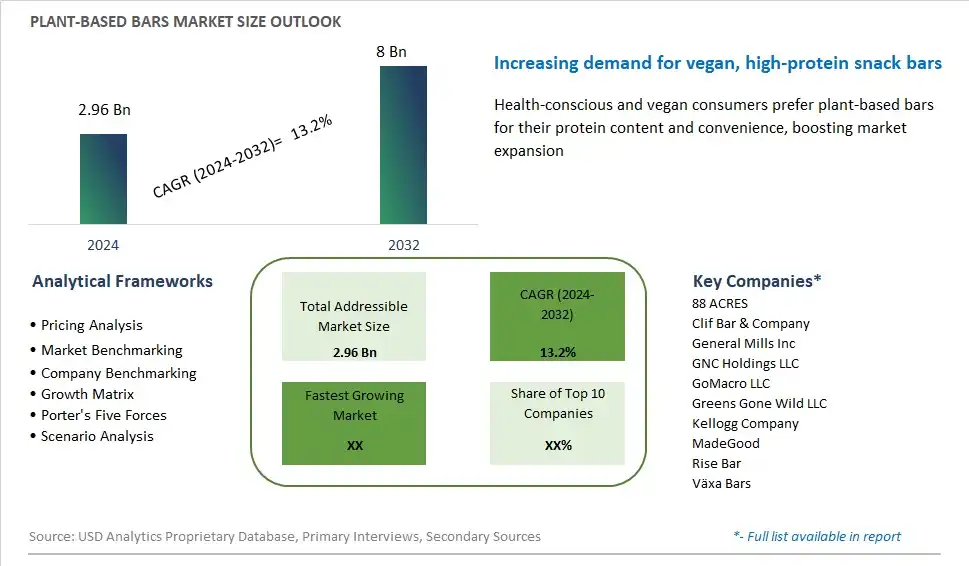
Global Plant-based Bars Market Size is valued at $2.96 Billion in 2024 and is forecast to register a growth rate (CAGR) of 13.2% to reach $8 Billion by 2032.
The global Plant-based Bars Market Comprehensive Study analyzes and forecasts the market size across 6 regions and 24 countries for diverse segments -By Product (Protein Bars, Granola/Cereal Bars, Energy Bars, Fruit & Nut Bars, Others), By Nature (Organic, Conventional), By Distribution Channel (Hypermarkets/Supermarkets, Convenience Stores, Specialty Stores, Online, Others)
An Introduction to Plant-based Bars Market
The plant-based bars market in 2024 is thriving, driven by increasing consumer demand for healthy, convenient, and environmentally sustainable snack options. Plant-based bars, made from ingredients such as nuts, seeds, fruits, and plant proteins, offer a nutritious and satisfying alternative to traditional snack bars. The market includes a wide range of products, from protein bars and energy bars to meal replacement bars, catering to diverse dietary preferences and needs. Health-conscious consumers are drawn to plant-based bars for their clean labels, natural ingredients, and superior nutritional profiles, often rich in fiber, vitamins, and antioxidants. The trend towards plant-based diets and the growing awareness of the environmental impact of animal agriculture have significantly boosted demand for these products. Innovations in flavor combinations and packaging are further enhancing the appeal and accessibility of plant-based bars. As consumers continue to prioritize health, wellness, and sustainability, the plant-based bars market is set for robust growth and innovation.
Plant based Bars Competitive Landscape
The market report analyses the leading companies in the industry including 88 ACRES, Clif Bar & Company, General Mills Inc, GNC Holdings LLC, GoMacro LLC, Greens Gone Wild LLC, Kellogg Company, MadeGood, Rise Bar, Växa Bars, and Others.
Plant based Bars Market Dynamics
Market Trend: Increasing Demand for Plant-Based Foods
The most prominent trend in the Plant-Based Bars Market is the increasing demand for plant-based foods. As more consumers adopt vegetarian, vegan, and flexitarian diets, there is a growing preference for plant-based snacks that align with these dietary choices. This trend is driven by health, environmental, and ethical considerations. Plant-based bars, made from ingredients like nuts, seeds, fruits, and plant proteins, are gaining popularity as convenient and nutritious snack options that cater to this demand
Market Driver: Health and Wellness Movement
The health and wellness movement is a major driver of the Plant-Based Bars Market. Consumers are becoming more conscious of the nutritional content and health benefits of their food choices. Plant-based bars, which are often rich in protein, fiber, and essential nutrients, are perceived as healthier alternatives to traditional snack bars. The growing awareness of the benefits of plant-based diets, such as improved heart health and reduced risk of chronic diseases, is driving the demand for plant-based bars
Market Opportunity: Expansion into Functional Snacks
A significant opportunity in the Plant-Based Bars Market lies in the expansion into functional snacks. As consumers seek foods that offer specific health benefits, there is potential for companies to develop plant-based bars with added functional ingredients, such as adaptogens, probiotics, and superfoods. By creating bars that not only provide nutrition but also support specific health goals, companies can tap into the growing demand for functional foods and differentiate their products in a competitive market
Plant-based Bars Market Share Analysis: Product (Protein Bars, Granola/Cereal Bars, Energy Bars, Fruit & Nut Bars, Others)
Protein bars are anticipated to be the fastest-growing segment in the Plant-based Bars Market by product to 2032. The increasing demand for high-protein snacks, driven by the growing trend of health and fitness, propels the growth of the protein bars segment. Consumers are increasingly seeking convenient and nutritious snack options that provide sustained energy and support muscle recovery and growth. Plant-based protein bars appeal to a broad range of consumers, including vegans, vegetarians, and those looking to reduce their meat consumption. The availability of innovative formulations and flavors, along with the inclusion of functional ingredients such as superfoods and probiotics, further drives the popularity of plant-based protein bars.
Plant-based Bars Market Share Analysis: Nature (Organic, Conventional)
The organic segment is expected to be the fastest-growing in the Plant-based Bars Market by nature to 2032. The rising consumer awareness of health and wellness, coupled with the increasing demand for clean label and organic products, drives the growth of the organic segment. Consumers are becoming more conscious of the ingredients and sourcing practices of the products they consume, leading to a preference for organic plant-based bars. Additionally, the perception of organic products as being healthier and more environmentally friendly contributes to the segment's rapid growth. The expanding availability of organic plant-based bars in various retail channels, including specialty stores and online platforms, further supports the growth of this segment.
Plant-based Bars Market Share Analysis: Distribution Channel (Hypermarkets/Supermarkets, Convenience Stores, Specialty Stores, Online, Others)
The online distribution channel is projected to be the fastest-growing segment in the Plant-based Bars Market by distribution channel to 2032. The convenience and accessibility of online shopping, combined with the growing consumer preference for e-commerce, drive the rapid growth of this segment. Online platforms offer a wide variety of plant-based bars, detailed product descriptions, and customer reviews, making it easier for consumers to make informed purchasing decisions. The COVID-19 pandemic has further accelerated the shift towards online shopping, as consumers seek contactless and convenient ways to purchase their favorite snacks. Subscription services and direct-to-consumer models also contribute to the segment's expansion, providing consumers with regular deliveries of their preferred plant-based bars.
Plant based Bars Market Segmentation
By Product
Protein Bars
Granola/Cereal Bars
Energy Bars
Fruit & Nut Bars
Others
By Nature
Organic
Conventional
By Distribution Channel
Hypermarkets/Supermarkets
Convenience Stores
Specialty Stores
Online
Others
Countries Analyzed
North America (US, Canada, Mexico)
Europe (Germany, UK, France, Spain, Italy, Russia, Rest of Europe)
Asia Pacific (China, India, Japan, South Korea, Australia, South East Asia, Rest of Asia)
South America (Brazil, Argentina, Rest of South America)
Middle East and Africa (Saudi Arabia, UAE, Rest of Middle East, South Africa, Egypt, Rest of Africa)
Plant based Bars Companies Profiled in the Study
88 ACRES
Clif Bar & Company
General Mills Inc
GNC Holdings LLC
GoMacro LLC
Greens Gone Wild LLC
Kellogg Company
MadeGood
Rise Bar
Växa Bars
*- List Not Exhaustive
Chapter 1. TABLE OF CONTENTS
Chapter 2. Introduction to Plant based Bars Market
2.1. Market Overview
2.2. Key Statistics and Report Highlights
2.3. Scope of the Comprehensive Study
2.3.1. Market Definition
2.3.2 Countries and Regions Covered
2.3.3 Research Objective
2.3.4 Units, Currency, and Conversions
2.3.5 Industry Value Chain
2.4. Key Market Segments
2.5. Key Companies
2.6. Study Period
Chapter 3. Strategic Analysis Review
3.1. Plant based Bars Pricing Analysis and Forecast
3.2. Porter’s Five Forces
3.3. Market Ecosystem
3.4. SWOT Analysis
3.5. Regulatory Scenario
3.3. Effects of Inflation, Russia-Ukraine War, moderating economic growth, and other macroeconomic factors
Chapter 4. Competitive Landscape
4.1. Market Share Analysis
4.1.1. Global Plant based Bars Market Share by Company, 2023
4.1.2. Product Offerings of Leading Plant based Bars Companies
4.2. Market Entropy
4.2.1. New Product Launches in the Industry
4.2.2. Mergers, Acquisitions, Joint ventures, and Partnerships
4.3. Key Strategies and Best Practices
Chapter 5. Global Market Projections: Best, Reference, and Low Case Scenarios
5.1. Growth Analysis- Case Scenario Definitions
5.2. Low Growth Case Scenario Forecasts
5.3. Reference Growth Case Scenario Forecasts
5.4. High Growth Case Scenario Forecasts
Chapter 6. Market Dynamics
6.1. Plant based Bars Market Drivers
6.2. Plant based Bars Market Challenges
6.6. Plant based Bars Market Opportunities
6.4. Plant based Bars Market Trends
Chapter 7. Global Plant based Bars Market Outlook Trends
7.1. Global Plant based Bars Revenue (USD Million) and CAGR (%) by Type (2021-2032)
7.2. Global Plant based Bars Revenue (USD Million) and CAGR (%) by Application (2021-2032)
7.3. Global Plant based Bars Revenue (USD Million) and CAGR (%) by Product (2021-2032)
By Product
Protein Bars
Granola/Cereal Bars
Energy Bars
Fruit & Nut Bars
Others
By Nature
Organic
Conventional
By Distribution Channel
Hypermarkets/Supermarkets
Convenience Stores
Specialty Stores
Online
Others
Chapter 8. Global Plant based Bars Regional Analysis and Outlook
8.1. Global Plant based Bars Revenue (USD Million) By Regions (2021- 2032)
8.2. North America Plant based Bars Revenue (USD Million) by Country (2021-2032)
8.2.1. United States Plant based Bars Regional Analysis and Outlook
8.2.2. Canada Plant based Bars Regional Analysis and Outlook
8.2.3. Mexico Plant based Bars Regional Analysis and Outlook
8.3. Europe Plant based Bars Revenue (USD Million), by Country (2021-2032)
8.3.1. Germany Plant based Bars Regional Analysis and Outlook
8.3.2. France Plant based Bars Regional Analysis and Outlook
8.3.3. United Kingdom Plant based Bars Regional Analysis and Outlook
8.3.4. Spain Plant based Bars Regional Analysis and Outlook
8.3.5. Italy Plant based Bars Regional Analysis and Outlook
8.3.6. Russia Plant based Bars Regional Analysis and Outlook
8.3.7. Rest of Europe Plant based Bars Regional Analysis and Outlook
8.4. Asia Pacific Plant based Bars Revenue (USD Million) by Country (2021-2032)
8.4.1. China Plant based Bars Regional Analysis and Outlook
8.4.2. Japan Plant based Bars Regional Analysis and Outlook
8.4.3. India Plant based Bars Regional Analysis and Outlook
8.4.4. South Korea Plant based Bars Regional Analysis and Outlook
8.4.5. Australia Plant based Bars Regional Analysis and Outlook
8.4.6. South East Asia Plant based Bars Regional Analysis and Outlook
8.4.7. Rest of Asia Pacific Plant based Bars Regional Analysis and Outlook
8.5. South America Plant based Bars Revenue (USD Million), by Country (2021-2032)
8.5.1. Brazil Plant based Bars Regional Analysis and Outlook
8.5.2. Argentina Plant based Bars Regional Analysis and Outlook
8.5.3. Rest of South America Plant based Bars Regional Analysis and Outlook
8.6. Middle East and Africa Plant based Bars Revenue (USD Million) by Country (2021-2032)
8.6.1. Middle East Plant based Bars Regional Analysis and Outlook
8.6.2. Africa Plant based Bars Regional Analysis and Outlook
Chapter 9. North America Plant based Bars Analysis and Outlook
9.1. North America Plant based Bars Revenue (USD Million) by Segments (2021-2032)
9.1.1. North America Plant based Bars Revenue (USD Million) by Type (2021-2032)
9.1.2. North America Plant based Bars Revenue (USD Million) by Application (2021-2032)
9.1.3. North America Plant based Bars Revenue (USD Million) by Product (2021-2032)
By Product
Protein Bars
Granola/Cereal Bars
Energy Bars
Fruit & Nut Bars
Others
By Nature
Organic
Conventional
By Distribution Channel
Hypermarkets/Supermarkets
Convenience Stores
Specialty Stores
Online
Others
Chapter 10. Europe Plant based Bars Analysis and Outlook
10.1. Europe Plant based Bars Revenue (USD Million), by Segments (USD Million) (2021-2032)
10.1.1. Europe Plant based Bars Revenue (USD Million) by Type (2021-2032)
10.1.2. Europe Plant based Bars Revenue (USD Million) by Application (2021-2032)
10.1.3. Europe Plant based Bars Revenue (USD Million) by Product (2021-2032)
By Product
Protein Bars
Granola/Cereal Bars
Energy Bars
Fruit & Nut Bars
Others
By Nature
Organic
Conventional
By Distribution Channel
Hypermarkets/Supermarkets
Convenience Stores
Specialty Stores
Online
Others
Chapter 11. Asia Pacific Plant based Bars Analysis and Outlook
11.1. Asia Pacific Plant based Bars Revenue (USD Million), and Revenue (USD Million) by Segments (2021-2032)
11.1.1. Asia Pacific Plant based Bars Revenue (USD Million) by Type (2021-2032)
11.1.2. Asia Pacific Plant based Bars Revenue (USD Million) by Application (2021-2032)
11.1.3. Asia Pacific Plant based Bars Revenue (USD Million) by Product (2021-2032)
By Product
Protein Bars
Granola/Cereal Bars
Energy Bars
Fruit & Nut Bars
Others
By Nature
Organic
Conventional
By Distribution Channel
Hypermarkets/Supermarkets
Convenience Stores
Specialty Stores
Online
Others
Chapter 12. South America Plant based Bars Analysis and Outlook
12.1. South America Plant based Bars Revenue (USD Million), by Segments (2021-2032)
12.1.1. South America Plant based Bars Revenue (USD Million) by Type (2021-2032)
12.1.2. South America Plant based Bars Revenue (USD Million) by Application (2021-2032)
12.1.3. South America Plant based Bars Revenue (USD Million) by Product (2021-2032)
By Product
Protein Bars
Granola/Cereal Bars
Energy Bars
Fruit & Nut Bars
Others
By Nature
Organic
Conventional
By Distribution Channel
Hypermarkets/Supermarkets
Convenience Stores
Specialty Stores
Online
Others
Chapter 13. Middle East and Africa Plant based Bars Analysis and Outlook
13.1. Middle East and Africa Plant based Bars Revenue (USD Million), by Segments (2021-2032)
13.1.1. Middle East and Africa Plant based Bars Revenue (USD Million) by Type (2021-2032)
13.1.2. Middle East and Africa Plant based Bars Revenue (USD Million) by Application (2021-2032)
13.1.3. Middle East and Africa Plant based Bars Revenue (USD Million) by Product (2021-2032)
By Product
Protein Bars
Granola/Cereal Bars
Energy Bars
Fruit & Nut Bars
Others
By Nature
Organic
Conventional
By Distribution Channel
Hypermarkets/Supermarkets
Convenience Stores
Specialty Stores
Online
Others
Chapter 14. Plant based Bars Company Profiles
14.1 Business Overview
14.2 Product Profiles
14.3 SWOT Profiles
14.5 Recent Developments
14.6 Financial Profile
List of Companies
88 ACRES
Clif Bar & Company
General Mills Inc
GNC Holdings LLC
GoMacro LLC
Greens Gone Wild LLC
Kellogg Company
MadeGood
Rise Bar
Växa Bars
15. Methodology and Data Sources
15.1 Customization Offerings
15.2 Subscription Services
15.3 Related Reports
15.4 Publisher Expertise
LIST OF TABLES
Table 1 Market Segmentation Analysis
Table 2 Global Plant based Bars Market Share of Leading Companies, 2023
Table 3 Product Offerings of Leading Companies
Table 4 Low Growth Scenario Forecasts
Table 5 Reference Case Growth Scenario
Table 6 High Growth Case Scenario
Table 7 Global Plant based Bars Revenue (USD Million) And CAGR (%) By Type (2021-2032)
Table 8 Global Plant based Bars Revenue (USD Million) And CAGR (%) By Application (2021-2032)
Table 9 Global Plant based Bars Revenue (USD Million) And CAGR (%) By Product (2021-2032)
Table 10 Global Plant based Bars Market Revenue (USD Million) By Regions (2021-2032)
Table 11 Global Plant based Bars Market Share (%) By Regions (2021-2032)
Table 12 North America Plant based Bars Revenue (USD Million) By Country (2021-2032)
Table 13 Europe Plant based Bars Revenue (USD Million) By Country (2021-2032)
Table 14 Asia Pacific Plant based Bars Revenue (USD Million) By Country (2021-2032)
Table 15 South America Plant based Bars Revenue (USD Million) By Country (2021-2032)
Table 16 Middle East and Africa Plant based Bars Revenue (USD Million) By Region (2021-2032)
Table 17 North America Plant based Bars Revenue (USD Million) By Type (2021-2032)
Table 18 North America Plant based Bars Revenue (USD Million) By Application (2021-2032)
Table 19 North America Plant based Bars Revenue (USD Million) By Product (2021-2032)
Table 20 Europe Plant based Bars Revenue (USD Million) By Type (2021-2032)
Table 21 Europe Plant based Bars Revenue (USD Million) By Application (2021-2032)
Table 22 Europe Plant based Bars Revenue (USD Million) By Product (2021-2032)
Table 23 Asia Pacific Plant based Bars Revenue (USD Million) By Type (2021-2032)
Table 24 Asia Pacific Plant based Bars Revenue (USD Million) By Application (2021-2032)
Table 25 Asia Pacific Plant based Bars Revenue (USD Million) By Product (2021-2032)
Table 26 South America Plant based Bars Revenue (USD Million) By Type (2021-2032)
Table 27 South America Plant based Bars Revenue (USD Million) By Application (2021-2032)
Table 28 South America Plant based Bars Revenue (USD Million) By Product (2021-2032)
Table 29 Middle East and Africa Plant based Bars Revenue (USD Million) By Type (2021-2032)
Table 30 Middle East and Africa Plant based Bars Revenue (USD Million) By Application (2021-2032)
Table 31 Middle East and Africa Plant based Bars Revenue (USD Million) By Product (2021-2032)
LIST OF FIGURES
Figure 1. Market Scope
Figure 2. Pricing Forecasts Per Unit, 2023- 2032
Figure 3. Porter’s Five Forces
Figure 4. Global Plant based Bars Market Revenue (USD Million) By Regions (2021-2032)
Figure 5. Global Plant based Bars Market Share (%) By Regions (2023)
Figure 6. North America Plant based Bars Revenue (USD Million) By Country (2021-2032)
Figure 7. United States Plant based Bars Revenue (USD Million) By Country (2021-2032)
Figure 8. Canada Plant based Bars Revenue (USD Million) By Country (2021-2032)
Figure 9. Mexico Plant based Bars Revenue (USD Million) By Country (2021-2032)
Figure 10. Europe Plant based Bars Revenue (USD Million) By Country (2021-2032)
Figure 11. Germany Plant based Bars Revenue (USD Million) By Country (2021-2032)
Figure 12. France Plant based Bars Revenue (USD Million) By Country (2021-2032)
Figure 13. United Kingdom Plant based Bars Revenue (USD Million) By Country (2021-2032)
Figure 14. Spain Plant based Bars Revenue (USD Million) By Country (2021-2032)
Figure 15. Italy Plant based Bars Revenue (USD Million) By Country (2021-2032)
Figure 16. Russia Plant based Bars Revenue (USD Million) By Country (2021-2032)
Figure 17. Rest of Europe Plant based Bars Revenue (USD Million) By Country (2021-2032)
Figure 11. Asia Pacific Plant based Bars Revenue (USD Million) By Country (2021-2032)
Figure 12. China Plant based Bars Revenue (USD Million) By Country (2021-2032)
Figure 13. Japan Plant based Bars Revenue (USD Million) By Country (2021-2032)
Figure 14. India Plant based Bars Revenue (USD Million) By Country (2021-2032)
Figure 15. South Korea Plant based Bars Revenue (USD Million) By Country (2021-2032)
Figure 16. Australia Plant based Bars Revenue (USD Million) By Country (2021-2032)
Figure 17. South East Asia Plant based Bars Revenue (USD Million) By Country (2021-2032)
Figure 18. South America Plant based Bars Revenue (USD Million) By Country (2021-2032)
Figure 19. Brazil Plant based Bars Revenue (USD Million) By Country (2021-2032)
Figure 20. Argentina Plant based Bars Revenue (USD Million) By Country (2021-2032)
Figure 21. Rest of Asia Pacific Plant based Bars Revenue (USD Million) By Country (2021-2032)
Figure 22. Middle East and Africa Plant based Bars Revenue (USD Million) By Region (2021-2032)
Figure 23. Saudi Arabia Plant based Bars Revenue (USD Million) By Region (2021-2032)
Figure 24. The UAE Plant based Bars Revenue (USD Million) By Region (2021-2032)
Figure 25. Rest of Middle East Plant based Bars Revenue (USD Million) By Region (2021-2032)
Figure 26. South Africa Plant based Bars Revenue (USD Million) By Region (2021-2032)
Figure 27. Africa Plant based Bars Revenue (USD Million) By Region (2021-2032)
Figure 28. North America Plant based Bars Revenue (USD Million) By Type (2021-2032)
Figure 29. North America Plant based Bars Revenue (USD Million) By Application (2021-2032)
Figure 30. North America Plant based Bars Revenue (USD Million) By Product (2021-2032)
Figure 31. Europe Plant based Bars Revenue (USD Million) By Type (2021-2032)
Figure 32. Europe Plant based Bars Revenue (USD Million) By Application (2021-2032)
Figure 33. Europe Plant based Bars Revenue (USD Million) By Product (2021-2032)
Figure 34. Asia Pacific Plant based Bars Revenue (USD Million) By Type (2021-2032)
Figure 35. Asia Pacific Plant based Bars Revenue (USD Million) By Application (2021-2032)
Figure 36. Asia Pacific Plant based Bars Revenue (USD Million) By Product (2021-2032)
Figure 37. South America Plant based Bars Revenue (USD Million) By Type (2021-2032)
Figure 38. South America Plant based Bars Revenue (USD Million) By Application (2021-2032)
Figure 39. South America Plant based Bars Revenue (USD Million) By Product (2021-2032)
Figure 40. Middle East and Africa Plant based Bars Revenue (USD Million) By Type (2021-2032)
Figure 41. Middle East and Africa Plant based Bars Revenue (USD Million) By Application (2021-2032)
Figure 42. Middle East and Africa Plant based Bars Revenue (USD Million) By Product (2021-2032)
By Product
Protein Bars
Granola/Cereal Bars
Energy Bars
Fruit & Nut Bars
Others
By Nature
Organic
Conventional
By Distribution Channel
Hypermarkets/Supermarkets
Convenience Stores
Specialty Stores
Online
Others
Countries Analyzed
North America (US, Canada, Mexico)
Europe (Germany, UK, France, Spain, Italy, Russia, Rest of Europe)
Asia Pacific (China, India, Japan, South Korea, Australia, South East Asia, Rest of Asia)
South America (Brazil, Argentina, Rest of South America)
Middle East and Africa (Saudi Arabia, UAE, Rest of Middle East, South Africa, Egypt, Rest of Africa)
