The global Plant Extracts Market Comprehensive Study analyzes and forecasts the market size across 6 regions and 24 countries for diverse segments -By Product (Oleoresins, Essential Oils, Flavonoids, Alkaloids, Carotenoids, Others), By Source (Food & beverages, Cosmetics, Pharmaceuticals, Dietary Supplements, Others), By Form (Dry, Liquid), By Application (Herbs & spices, Fruits & vegetables, Flowers)
Plant extracts are concentrated solutions or powders obtained from botanical sources such as leaves, roots, fruits, and seeds, used in various industries including food, pharmaceuticals, cosmetics, and nutraceuticals in 2024. Plant extracts contain bioactive compounds such as polyphenols, flavonoids, alkaloids, and terpenes, which exhibit antioxidant, anti-inflammatory, antimicrobial, and other health-promoting properties. In the food industry, plant extracts are used as natural colorants, flavorings, preservatives, and functional ingredients in products such as beverages, confectionery, dairy, and snacks. In the pharmaceutical and nutraceutical sectors, plant extracts are utilized in dietary supplements, herbal remedies, and traditional medicines for their therapeutic effects on health and wellness. In cosmetics, plant extracts are incorporated into skincare, haircare, and personal care products for their moisturizing, anti-aging, and skin-soothing properties. With growing consumer demand for natural, clean label ingredients and holistic health solutions, the market for plant extracts is expanding, driven by innovations in extraction technology, formulation techniques, and product applications that harness the diverse bioactive compounds found in plants to deliver safe, effective, and sustainable solutions to meet market demands and consumer preferences.
The market report analyses the leading companies in the industry including Archer Daniels Midland Company (ADM), Carbery Group, Givaudan SA, International Flavors & Fragrances Inc, Kalsec Inc, Kangcare bioindustry co. Ltd, Kerry Group Plc, Symrise AG, Synthite Industries Ltd, and Others.
One prominent market trend in plant extracts is the growing preference for natural and plant-based products, driven by increasing consumer awareness of health, sustainability, and environmental concerns. As consumers seek alternatives to synthetic ingredients and chemical additives, there's a rising demand for plant extracts derived from botanical sources such as herbs, fruits, vegetables, and spices. Plant extracts are valued for their bioactive compounds, phytochemicals, and functional properties, which offer a wide range of health benefits and applications in food, beverages, cosmetics, pharmaceuticals, and dietary supplements. This trend is further fueled by the desire for clean label products made from minimally processed ingredients and the perception of plant extracts as safer, healthier, and more sustainable alternatives to artificial additives and preservatives. As consumer preferences shift towards plant-based lifestyles and natural remedies, the market for plant extracts continues to expand, driving innovation and market growth in the plant extract industry.
A key driver propelling the market for plant extracts is the increasing focus on health and wellness trends driving consumer demand for functional foods, nutraceuticals, and natural remedies. Consumers are increasingly seeking products that not only taste good but also offer health-enhancing benefits, such as immune support, antioxidant protection, and anti-inflammatory properties. Plant extracts contain bioactive compounds such as polyphenols, flavonoids, and carotenoids that have been shown to exert various physiological effects, including cardiovascular health, cognitive function, and digestive wellness. This driver is supported by scientific research highlighting the health-promoting properties of plant extracts and their potential role in disease prevention and health optimization. Moreover, the rise of holistic approaches to health, personalized nutrition, and preventive medicine is driving the integration of plant extracts into functional foods, dietary supplements, and wellness products targeting specific health concerns and consumer demographics. As consumers increasingly prioritize their health and well-being, the demand for plant extracts as natural, functional ingredients continues to grow, creating opportunities for market expansion and product innovation in the plant extract industry.
An opportunity within the plant extracts market lies in innovation in product development and formulations to meet evolving consumer preferences and market demands. With advancements in extraction technologies, formulation techniques, and ingredient science, there's potential to create novel plant extract-based products with improved efficacy, stability, and sensory attributes. For example, companies can develop standardized plant extract formulations with optimized bioavailability and dosage forms to enhance their therapeutic effects and consumer acceptance. Additionally, there's an opportunity to explore synergistic combinations of plant extracts and other natural ingredients to create multi-functional products targeting specific health benefits or market segments. Moreover, the incorporation of plant extracts into novel delivery systems such as nanoemulsions, encapsulation, and microencapsulation can enhance their stability, bioavailability, and shelf life, expanding their applications in functional foods, beverages, supplements, and personal care products. By investing in research and development and collaborating with academic institutions and industry partners, companies can unlock the full potential of plant extracts and drive innovation in the creation of next-generation natural products for health and wellness-conscious consumers.
In the plant extracts market, the Oleoresins segment is the largest, driven by several pivotal factors. Oleoresins are concentrated extracts obtained from various plant materials, containing both volatile essential oils and non-volatile resinous compounds. Their versatility and wide-ranging applications across industries such as food and beverages, pharmaceuticals, cosmetics, and aromatherapy contribute to their market dominance. Oleoresins are prized for their intense flavor profiles, vibrant colors, and potent bioactive properties, making them essential ingredients in food flavorings, fragrances, herbal remedies, and natural colorants. Further, advancements in extraction technologies enable the efficient and selective extraction of oleoresins from different plant sources, ensuring high product yields and purity levels. Additionally, the growing demand for natural and clean label ingredients drives the adoption of oleoresins as preferred alternatives to synthetic additives and flavorings. Furthermore, the diverse chemical composition of oleoresins, containing a complex mixture of active compounds, enhances their functionality and efficacy in various applications, solidifying their position as the largest segment in the plant extracts market.
In the plant extracts market, the Cosmetics segment is the fastest-growing, propelled by several pivotal factors. With increasing consumer preference for natural and organic ingredients in personal care products, plant extracts have gained significant traction in the cosmetics industry. Plant-derived ingredients offer a range of beneficial properties, including antioxidant, anti-inflammatory, and moisturizing effects, making them ideal for skincare, haircare, and cosmetics formulations. The growing demand for plant-based alternatives to synthetic chemicals and preservatives drives the adoption of plant extracts in cosmetics, as consumers seek safer and more sustainable options for their beauty routines. Further, advancements in extraction techniques and ingredient formulation enable the development of innovative plant-based cosmetic products with enhanced efficacy and sensorial qualities. Additionally, the rising awareness of environmental sustainability and ethical sourcing practices further accelerates the demand for plant extracts in cosmetics, as consumers prioritize products that align with their values. Furthermore, the versatility of plant extracts allows for a wide range of applications in cosmetics, including anti-aging serums, natural pigments, and botanical fragrances, driving growth and innovation in the Cosmetics segment of the plant extracts market.
In the plant extracts market, the Dry segment is the largest, driven by several pivotal factors. Dry plant extracts offer numerous advantages, including longer shelf life, ease of storage, and transportation, making them preferred by manufacturers and consumers alike. Their concentrated form allows for versatile applications across various industries, including food and beverages, pharmaceuticals, dietary supplements, and cosmetics. Dry plant extracts retain the bioactive compounds and properties of the original plant material, ensuring consistency and efficacy in product formulations. Further, advancements in drying technologies, such as spray drying and freeze-drying, enable the preservation of volatile compounds and delicate phytochemicals, enhancing the quality of dry plant extracts. Additionally, the rising demand for natural and clean label ingredients fuels the adoption of dry plant extracts as alternatives to synthetic additives and flavorings. Furthermore, the convenience and versatility of dry plant extracts in powder or granular form enable precise dosing and blending, facilitating their integration into a wide range of products, thus solidifying their position as the largest segment in the plant extracts market.
By Product
Oleoresins
Essential Oils
Flavonoids
Alkaloids
Carotenoids
Others
By Source
Food & beverages
Cosmetics
Pharmaceuticals
Dietary Supplements
Others
By Form
Dry
Liquid
By Application
Herbs & spices
Fruits & vegetables
Flowers
Countries Analyzed
North America (US, Canada, Mexico)
Europe (Germany, UK, France, Spain, Italy, Russia, Rest of Europe)
Asia Pacific (China, India, Japan, South Korea, Australia, South East Asia, Rest of Asia)
South America (Brazil, Argentina, Rest of South America)
Middle East and Africa (Saudi Arabia, UAE, Rest of Middle East, South Africa, Egypt, Rest of Africa)
Archer Daniels Midland Company (ADM)
Carbery Group
Givaudan SA
International Flavors & Fragrances Inc
Kalsec Inc
Kangcare bioindustry co. Ltd
Kerry Group Plc
Symrise AG
Synthite Industries Ltd
*- List Not Exhaustive
Chapter 1. TABLE OF CONTENTS
Chapter 2. Introduction to Plant Extracts Market
2.1. Market Overview
2.2. Key Statistics and Report Highlights
2.3. Scope of the Comprehensive Study
2.3.1. Market Definition
2.3.2 Countries and Regions Covered
2.3.3 Research Objective
2.3.4 Units, Currency, and Conversions
2.3.5 Industry Value Chain
2.4. Key Market Segments
2.5. Key Companies
2.6. Study Period
Chapter 3. Strategic Analysis Review
3.1. Plant Extracts Pricing Analysis and Forecast
3.2. Porter’s Five Forces
3.3. Market Ecosystem
3.4. SWOT Analysis
3.5. Regulatory Scenario
3.3. Effects of Inflation, Russia-Ukraine War, moderating economic growth, and other macroeconomic factors
Chapter 4. Competitive Landscape
4.1. Market Share Analysis
4.1.1. Global Plant Extracts Market Share by Company, 2023
4.1.2. Product Offerings of Leading Plant Extracts Companies
4.2. Market Entropy
4.2.1. New Product Launches in the Industry
4.2.2. Mergers, Acquisitions, Joint ventures, and Partnerships
4.3. Key Strategies and Best Practices
Chapter 5. Global Market Projections: Best, Reference, and Low Case Scenarios
5.1. Growth Analysis- Case Scenario Definitions
5.2. Low Growth Case Scenario Forecasts
5.3. Reference Growth Case Scenario Forecasts
5.4. High Growth Case Scenario Forecasts
Chapter 6. Market Dynamics
6.1. Plant Extracts Market Drivers
6.2. Plant Extracts Market Challenges
6.6. Plant Extracts Market Opportunities
6.4. Plant Extracts Market Trends
Chapter 7. Global Plant Extracts Market Outlook Trends
7.1. Global Plant Extracts Revenue (USD Million) and CAGR (%) by Type (2021-2032)
7.2. Global Plant Extracts Revenue (USD Million) and CAGR (%) by Application (2021-2032)
7.3. Global Plant Extracts Revenue (USD Million) and CAGR (%) by Product (2021-2032)
By Product
Oleoresins
Essential Oils
Flavonoids
Alkaloids
Carotenoids
Others
By Source
Food & beverages
Cosmetics
Pharmaceuticals
Dietary Supplements
Others
By Form
Dry
Liquid
By Application
Herbs & spices
Fruits & vegetables
Flowers
Chapter 8. Global Plant Extracts Regional Analysis and Outlook
8.1. Global Plant Extracts Revenue (USD Million) By Regions (2021- 2032)
8.2. North America Plant Extracts Revenue (USD Million) by Country (2021-2032)
8.2.1. United States Plant Extracts Regional Analysis and Outlook
8.2.2. Canada Plant Extracts Regional Analysis and Outlook
8.2.3. Mexico Plant Extracts Regional Analysis and Outlook
8.3. Europe Plant Extracts Revenue (USD Million), by Country (2021-2032)
8.3.1. Germany Plant Extracts Regional Analysis and Outlook
8.3.2. France Plant Extracts Regional Analysis and Outlook
8.3.3. United Kingdom Plant Extracts Regional Analysis and Outlook
8.3.4. Spain Plant Extracts Regional Analysis and Outlook
8.3.5. Italy Plant Extracts Regional Analysis and Outlook
8.3.6. Russia Plant Extracts Regional Analysis and Outlook
8.3.7. Rest of Europe Plant Extracts Regional Analysis and Outlook
8.4. Asia Pacific Plant Extracts Revenue (USD Million) by Country (2021-2032)
8.4.1. China Plant Extracts Regional Analysis and Outlook
8.4.2. Japan Plant Extracts Regional Analysis and Outlook
8.4.3. India Plant Extracts Regional Analysis and Outlook
8.4.4. South Korea Plant Extracts Regional Analysis and Outlook
8.4.5. Australia Plant Extracts Regional Analysis and Outlook
8.4.6. South East Asia Plant Extracts Regional Analysis and Outlook
8.4.7. Rest of Asia Pacific Plant Extracts Regional Analysis and Outlook
8.5. South America Plant Extracts Revenue (USD Million), by Country (2021-2032)
8.5.1. Brazil Plant Extracts Regional Analysis and Outlook
8.5.2. Argentina Plant Extracts Regional Analysis and Outlook
8.5.3. Rest of South America Plant Extracts Regional Analysis and Outlook
8.6. Middle East and Africa Plant Extracts Revenue (USD Million) by Country (2021-2032)
8.6.1. Middle East Plant Extracts Regional Analysis and Outlook
8.6.2. Africa Plant Extracts Regional Analysis and Outlook
Chapter 9. North America Plant Extracts Analysis and Outlook
9.1. North America Plant Extracts Revenue (USD Million) by Segments (2021-2032)
9.1.1. North America Plant Extracts Revenue (USD Million) by Type (2021-2032)
9.1.2. North America Plant Extracts Revenue (USD Million) by Application (2021-2032)
9.1.3. North America Plant Extracts Revenue (USD Million) by Product (2021-2032)
By Product
Oleoresins
Essential Oils
Flavonoids
Alkaloids
Carotenoids
Others
By Source
Food & beverages
Cosmetics
Pharmaceuticals
Dietary Supplements
Others
By Form
Dry
Liquid
By Application
Herbs & spices
Fruits & vegetables
Flowers
Chapter 10. Europe Plant Extracts Analysis and Outlook
10.1. Europe Plant Extracts Revenue (USD Million), by Segments (USD Million) (2021-2032)
10.1.1. Europe Plant Extracts Revenue (USD Million) by Type (2021-2032)
10.1.2. Europe Plant Extracts Revenue (USD Million) by Application (2021-2032)
10.1.3. Europe Plant Extracts Revenue (USD Million) by Product (2021-2032)
By Product
Oleoresins
Essential Oils
Flavonoids
Alkaloids
Carotenoids
Others
By Source
Food & beverages
Cosmetics
Pharmaceuticals
Dietary Supplements
Others
By Form
Dry
Liquid
By Application
Herbs & spices
Fruits & vegetables
Flowers
Chapter 11. Asia Pacific Plant Extracts Analysis and Outlook
11.1. Asia Pacific Plant Extracts Revenue (USD Million), and Revenue (USD Million) by Segments (2021-2032)
11.1.1. Asia Pacific Plant Extracts Revenue (USD Million) by Type (2021-2032)
11.1.2. Asia Pacific Plant Extracts Revenue (USD Million) by Application (2021-2032)
11.1.3. Asia Pacific Plant Extracts Revenue (USD Million) by Product (2021-2032)
By Product
Oleoresins
Essential Oils
Flavonoids
Alkaloids
Carotenoids
Others
By Source
Food & beverages
Cosmetics
Pharmaceuticals
Dietary Supplements
Others
By Form
Dry
Liquid
By Application
Herbs & spices
Fruits & vegetables
Flowers
Chapter 12. South America Plant Extracts Analysis and Outlook
12.1. South America Plant Extracts Revenue (USD Million), by Segments (2021-2032)
12.1.1. South America Plant Extracts Revenue (USD Million) by Type (2021-2032)
12.1.2. South America Plant Extracts Revenue (USD Million) by Application (2021-2032)
12.1.3. South America Plant Extracts Revenue (USD Million) by Product (2021-2032)
By Product
Oleoresins
Essential Oils
Flavonoids
Alkaloids
Carotenoids
Others
By Source
Food & beverages
Cosmetics
Pharmaceuticals
Dietary Supplements
Others
By Form
Dry
Liquid
By Application
Herbs & spices
Fruits & vegetables
Flowers
Chapter 13. Middle East and Africa Plant Extracts Analysis and Outlook
13.1. Middle East and Africa Plant Extracts Revenue (USD Million), by Segments (2021-2032)
13.1.1. Middle East and Africa Plant Extracts Revenue (USD Million) by Type (2021-2032)
13.1.2. Middle East and Africa Plant Extracts Revenue (USD Million) by Application (2021-2032)
13.1.3. Middle East and Africa Plant Extracts Revenue (USD Million) by Product (2021-2032)
By Product
Oleoresins
Essential Oils
Flavonoids
Alkaloids
Carotenoids
Others
By Source
Food & beverages
Cosmetics
Pharmaceuticals
Dietary Supplements
Others
By Form
Dry
Liquid
By Application
Herbs & spices
Fruits & vegetables
Flowers
Chapter 14. Plant Extracts Company Profiles
14.1 Business Overview
14.2 Product Profiles
14.3 SWOT Profiles
14.5 Recent Developments
14.6 Financial Profile
List of Companies
Archer Daniels Midland Company (ADM)
Carbery Group
Givaudan SA
International Flavors & Fragrances Inc
Kalsec Inc
Kangcare bioindustry co. Ltd
Kerry Group Plc
Symrise AG
Synthite Industries Ltd
15. Methodology and Data Sources
15.1 Customization Offerings
15.2 Subscription Services
15.3 Related Reports
15.4 Publisher Expertise
LIST OF TABLES
Table 1 Market Segmentation Analysis
Table 2 Global Plant Extracts Market Share of Leading Companies, 2023
Table 3 Product Offerings of Leading Companies
Table 4 Low Growth Scenario Forecasts
Table 5 Reference Case Growth Scenario
Table 6 High Growth Case Scenario
Table 7 Global Plant Extracts Revenue (USD Million) And CAGR (%) By Type (2021-2032)
Table 8 Global Plant Extracts Revenue (USD Million) And CAGR (%) By Application (2021-2032)
Table 9 Global Plant Extracts Revenue (USD Million) And CAGR (%) By Product (2021-2032)
Table 10 Global Plant Extracts Market Revenue (USD Million) By Regions (2021-2032)
Table 11 Global Plant Extracts Market Share (%) By Regions (2021-2032)
Table 12 North America Plant Extracts Revenue (USD Million) By Country (2021-2032)
Table 13 Europe Plant Extracts Revenue (USD Million) By Country (2021-2032)
Table 14 Asia Pacific Plant Extracts Revenue (USD Million) By Country (2021-2032)
Table 15 South America Plant Extracts Revenue (USD Million) By Country (2021-2032)
Table 16 Middle East and Africa Plant Extracts Revenue (USD Million) By Region (2021-2032)
Table 17 North America Plant Extracts Revenue (USD Million) By Type (2021-2032)
Table 18 North America Plant Extracts Revenue (USD Million) By Application (2021-2032)
Table 19 North America Plant Extracts Revenue (USD Million) By Product (2021-2032)
Table 20 Europe Plant Extracts Revenue (USD Million) By Type (2021-2032)
Table 21 Europe Plant Extracts Revenue (USD Million) By Application (2021-2032)
Table 22 Europe Plant Extracts Revenue (USD Million) By Product (2021-2032)
Table 23 Asia Pacific Plant Extracts Revenue (USD Million) By Type (2021-2032)
Table 24 Asia Pacific Plant Extracts Revenue (USD Million) By Application (2021-2032)
Table 25 Asia Pacific Plant Extracts Revenue (USD Million) By Product (2021-2032)
Table 26 South America Plant Extracts Revenue (USD Million) By Type (2021-2032)
Table 27 South America Plant Extracts Revenue (USD Million) By Application (2021-2032)
Table 28 South America Plant Extracts Revenue (USD Million) By Product (2021-2032)
Table 29 Middle East and Africa Plant Extracts Revenue (USD Million) By Type (2021-2032)
Table 30 Middle East and Africa Plant Extracts Revenue (USD Million) By Application (2021-2032)
Table 31 Middle East and Africa Plant Extracts Revenue (USD Million) By Product (2021-2032)
LIST OF FIGURES
Figure 1. Market Scope
Figure 2. Pricing Forecasts Per Unit, 2023- 2032
Figure 3. Porter’s Five Forces
Figure 4. Global Plant Extracts Market Revenue (USD Million) By Regions (2021-2032)
Figure 5. Global Plant Extracts Market Share (%) By Regions (2023)
Figure 6. North America Plant Extracts Revenue (USD Million) By Country (2021-2032)
Figure 7. United States Plant Extracts Revenue (USD Million) By Country (2021-2032)
Figure 8. Canada Plant Extracts Revenue (USD Million) By Country (2021-2032)
Figure 9. Mexico Plant Extracts Revenue (USD Million) By Country (2021-2032)
Figure 10. Europe Plant Extracts Revenue (USD Million) By Country (2021-2032)
Figure 11. Germany Plant Extracts Revenue (USD Million) By Country (2021-2032)
Figure 12. France Plant Extracts Revenue (USD Million) By Country (2021-2032)
Figure 13. United Kingdom Plant Extracts Revenue (USD Million) By Country (2021-2032)
Figure 14. Spain Plant Extracts Revenue (USD Million) By Country (2021-2032)
Figure 15. Italy Plant Extracts Revenue (USD Million) By Country (2021-2032)
Figure 16. Russia Plant Extracts Revenue (USD Million) By Country (2021-2032)
Figure 17. Rest of Europe Plant Extracts Revenue (USD Million) By Country (2021-2032)
Figure 11. Asia Pacific Plant Extracts Revenue (USD Million) By Country (2021-2032)
Figure 12. China Plant Extracts Revenue (USD Million) By Country (2021-2032)
Figure 13. Japan Plant Extracts Revenue (USD Million) By Country (2021-2032)
Figure 14. India Plant Extracts Revenue (USD Million) By Country (2021-2032)
Figure 15. South Korea Plant Extracts Revenue (USD Million) By Country (2021-2032)
Figure 16. Australia Plant Extracts Revenue (USD Million) By Country (2021-2032)
Figure 17. South East Asia Plant Extracts Revenue (USD Million) By Country (2021-2032)
Figure 18. South America Plant Extracts Revenue (USD Million) By Country (2021-2032)
Figure 19. Brazil Plant Extracts Revenue (USD Million) By Country (2021-2032)
Figure 20. Argentina Plant Extracts Revenue (USD Million) By Country (2021-2032)
Figure 21. Rest of Asia Pacific Plant Extracts Revenue (USD Million) By Country (2021-2032)
Figure 22. Middle East and Africa Plant Extracts Revenue (USD Million) By Region (2021-2032)
Figure 23. Saudi Arabia Plant Extracts Revenue (USD Million) By Region (2021-2032)
Figure 24. The UAE Plant Extracts Revenue (USD Million) By Region (2021-2032)
Figure 25. Rest of Middle East Plant Extracts Revenue (USD Million) By Region (2021-2032)
Figure 26. South Africa Plant Extracts Revenue (USD Million) By Region (2021-2032)
Figure 27. Africa Plant Extracts Revenue (USD Million) By Region (2021-2032)
Figure 28. North America Plant Extracts Revenue (USD Million) By Type (2021-2032)
Figure 29. North America Plant Extracts Revenue (USD Million) By Application (2021-2032)
Figure 30. North America Plant Extracts Revenue (USD Million) By Product (2021-2032)
Figure 31. Europe Plant Extracts Revenue (USD Million) By Type (2021-2032)
Figure 32. Europe Plant Extracts Revenue (USD Million) By Application (2021-2032)
Figure 33. Europe Plant Extracts Revenue (USD Million) By Product (2021-2032)
Figure 34. Asia Pacific Plant Extracts Revenue (USD Million) By Type (2021-2032)
Figure 35. Asia Pacific Plant Extracts Revenue (USD Million) By Application (2021-2032)
Figure 36. Asia Pacific Plant Extracts Revenue (USD Million) By Product (2021-2032)
Figure 37. South America Plant Extracts Revenue (USD Million) By Type (2021-2032)
Figure 38. South America Plant Extracts Revenue (USD Million) By Application (2021-2032)
Figure 39. South America Plant Extracts Revenue (USD Million) By Product (2021-2032)
Figure 40. Middle East and Africa Plant Extracts Revenue (USD Million) By Type (2021-2032)
Figure 41. Middle East and Africa Plant Extracts Revenue (USD Million) By Application (2021-2032)
Figure 42. Middle East and Africa Plant Extracts Revenue (USD Million) By Product (2021-2032)
By Product
Oleoresins
Essential Oils
Flavonoids
Alkaloids
Carotenoids
Others
By Source
Food & beverages
Cosmetics
Pharmaceuticals
Dietary Supplements
Others
By Form
Dry
Liquid
By Application
Herbs & spices
Fruits & vegetables
Flowers
Countries Analyzed
North America (US, Canada, Mexico)
Europe (Germany, UK, France, Spain, Italy, Russia, Rest of Europe)
Asia Pacific (China, India, Japan, South Korea, Australia, South East Asia, Rest of Asia)
South America (Brazil, Argentina, Rest of South America)
Middle East and Africa (Saudi Arabia, UAE, Rest of Middle East, South Africa, Egypt, Rest of Africa)
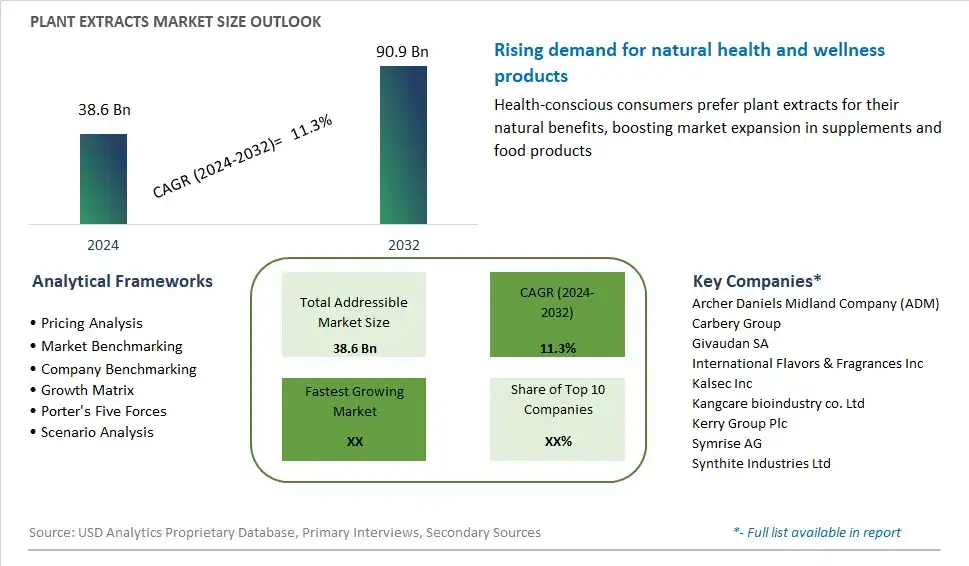
Global Plant Extracts Market Size is valued at $38.6 Billion in 2024 and is forecast to register a growth rate (CAGR) of 11.3% to reach $90.9 Billion by 2032.
Emerging Markets across Asia Pacific, Europe, and Americas present robust growth prospects.
Archer Daniels Midland Company (ADM), Carbery Group, Givaudan SA, International Flavors & Fragrances Inc, Kalsec Inc, Kangcare bioindustry co. Ltd, Kerry Group Plc, Symrise AG, Synthite Industries Ltd
Base Year- 2023; Estimated Year- 2024; Historic Period- 2018-2023; Forecast period- 2024 to 2032; Currency: Revenue (USD); Volume