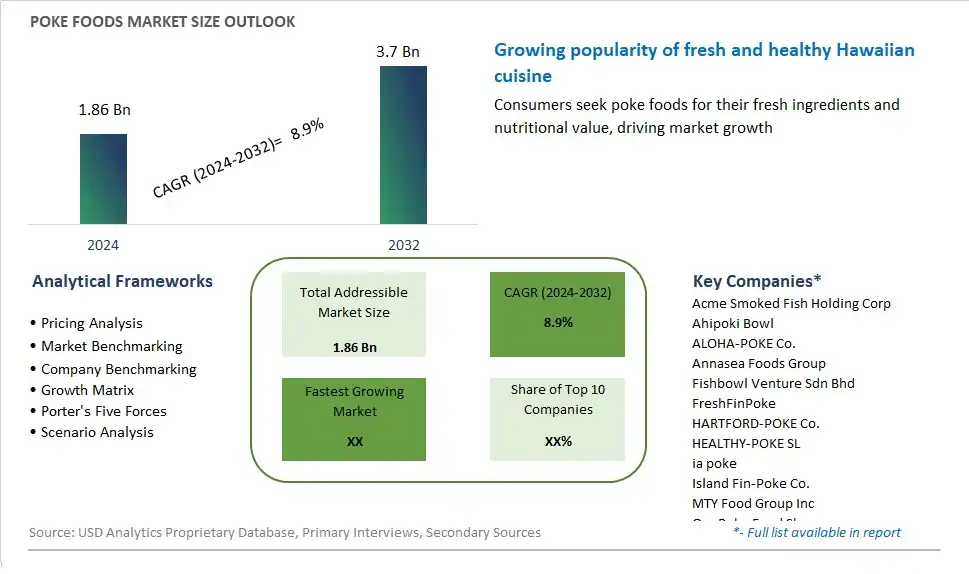
Global Poke Foods Market Size is valued at $1.86 Billion in 2024 and is forecast to register a growth rate (CAGR) of 8.9% to reach $3.7 Billion by 2032.
The global Poke Foods Market Comprehensive Study analyzes and forecasts the market size across 6 regions and 24 countries for diverse segments -By Product (Varieties of tuna, Others), By Distribution Channel (Offline, Online)
An Introduction to Poke Foods Market
The market for poke foods continues to grow as this Hawaiian-inspired dish gains popularity worldwide for its fresh, flavorful ingredients and customizable appeal. Poke, traditionally made with diced raw fish, rice, vegetables, and sauces, offers a healthy and satisfying meal option that reflects the vibrant flavors of Pacific Island cuisine. With consumers increasingly seeking convenient and nutritious dining options, poke bowls and salads have emerged as go-to choices for lunch, dinner, and on-the-go snacking. Moreover, the versatility of poke allows for endless variations and regional adaptations, incorporating diverse seafood, proteins, grains, and toppings to suit different tastes and dietary preferences. As consumers continue to prioritize health, freshness, and culinary exploration, the market for poke foods is expected to expand further, driven by demand for innovative flavors, sustainable sourcing practices, and immersive dining experiences.
Poke Foods Competitive Landscape
The market report analyses the leading companies in the industry including Acme Smoked Fish Holding Corp, Ahipoki Bowl, ALOHA-POKE Co., Annasea Foods Group, Fishbowl Venture Sdn Bhd, FreshFinPoke, HARTFORD-POKE Co., HEALTHY-POKE SL, ia poke, Island Fin-Poke Co., MTY Food Group Inc, OnoPoke Food Shop, POKED, PokeMe Group Pty Ltd, Pokeworks, RedPoke, Sweetfin, The PokeCo. and wings, The PokeLab, white rabbit projects LLP, and Others.
Poke Foods Market Dynamics
Poke Foods Market Trend: Rise of Hawaiian Cuisine and Healthy Eating
One prominent trend in the poke foods market is the rise of Hawaiian cuisine and healthy eating. Poke, a traditional Hawaiian dish featuring diced raw fish, rice, vegetables, and flavorful sauces, has gained popularity worldwide as consumers embrace fresh and nutritious dining options. This trend is driven by a growing interest in global cuisines, culinary exploration, and health-conscious eating habits. Poke bowls offer a balanced and customizable meal option that caters to diverse dietary preferences, including gluten-free, dairy-free, and vegetarian diets. As consumers prioritize freshness, quality ingredients, and bold flavors, poke foods have become a popular choice for individuals seeking a satisfying and guilt-free dining experience.
Market Driver: Consumer Demand for Customization and Fresh Ingredients
A key driver propelling the poke foods market is consumer demand for customization and fresh ingredients. Poke bowls allow consumers to personalize their meals by choosing their preferred base (such as rice or greens), protein (such as tuna, salmon, or tofu), toppings (such as avocado, edamame, or seaweed), and sauces (such as soy sauce, sesame oil, or spicy mayo). This driver is fueled by the desire for flexibility, variety, and transparency in food choices, as well as the appeal of made-to-order meals prepared with high-quality, locally sourced ingredients. Poke restaurants and foodservice providers that offer customizable options and emphasize the use of fresh, sustainable seafood and produce can attract and retain customers seeking flavorful, nutritious, and Instagram-worthy dining experiences.
Market Opportunity: Diversification of Menu Offerings and Expansion into New Markets
An opportunity for market expansion in the poke foods segment lies in the diversification of menu offerings and expansion into new markets. While traditional poke bowls remain popular, there is potential to innovate with new flavors, ingredients, and formats to attract a broader audience and differentiate offerings from competitors. Manufacturers and foodservice providers can explore creative variations of poke bowls, such as poke burritos, poke salads, poke tacos, or poke sliders, to appeal to different tastes and eating occasions. Additionally, there is an opportunity to expand into new geographic markets where poke foods are less prevalent, leveraging the global popularity of Hawaiian cuisine and the growing demand for healthy and flavorful meal options. By diversifying menu offerings and expanding market reach, businesses can capitalize on the increasing consumer interest in poke foods and drive growth in the segment.
Poke Foods Market Share Analysis: Varieties of Tuna held the dominant market share in 2024
In the Poke Foods market, the Varieties of Tuna segment is the largest due to several key factors. Tuna is a staple ingredient in traditional Hawaiian poke dishes, renowned for its rich flavor, firm texture, and versatility in various culinary preparations. The popularity of tuna poke bowls has surged globally, driven by the growing demand for fresh, healthy, and flavorful meal options. Further, tuna is prized for its high protein content, omega-3 fatty acids, and low levels of mercury, making it a nutritious choice for health-conscious consumers. Additionally, the availability of different tuna varieties, including Ahi (yellowfin), Albacore, and Bluefin, allows for a diverse range of flavor profiles and culinary experiences to suit varying tastes and preferences. Furthermore, the rising trend of seafood consumption and the increasing popularity of Hawaiian cuisine contribute to the sustained dominance of the Varieties of Tuna segment in the Poke Foods market. As a result, tuna remains the preferred choice for creating authentic and delicious poke bowls, driving the segment's continued growth and market share expansion.
Poke Foods Market Share Analysis: Online Distribution Channel market is poised to register the fastest growth rae over the forecast period to 2032
In the Poke Foods market, the Online Distribution Channel segment is experiencing the most rapid growth, driven by several key factors. The proliferation of e-commerce platforms has revolutionized the way consumers access and purchase food products, including poke bowls, offering convenience, variety, and accessibility. Online retailers provide a wide selection of poke bowl options from different vendors, allowing consumers to explore and order their favorite dishes conveniently from the comfort of their homes or workplaces. Further, the ease of browsing, ordering, and doorstep delivery services offered by online platforms appeal to busy consumers seeking convenient dining solutions. Additionally, the global reach and scalability of online channels enable poke bowl vendors to reach a broader audience, including consumers in remote areas or regions with limited access to traditional poke restaurants. Furthermore, the increasing trend of health-consciousness and the growing popularity of poke as a nutritious and flavorful meal option further drive the demand for poke bowls through online channels. As a result, the Online Distribution Channel segment is witnessing significant growth within the Poke Foods market, fueled by its convenience, diverse product offerings, and alignment with evolving consumer preferences for convenient and healthier dining options.
Poke Foods Market Segmentation
By Product
Varieties of tuna
Others
By Distribution Channel
Offline
Online
Countries Analyzed
North America (US, Canada, Mexico)
Europe (Germany, UK, France, Spain, Italy, Russia, Rest of Europe)
Asia Pacific (China, India, Japan, South Korea, Australia, South East Asia, Rest of Asia)
South America (Brazil, Argentina, Rest of South America)
Middle East and Africa (Saudi Arabia, UAE, Rest of Middle East, South Africa, Egypt, Rest of Africa)
Poke Foods Companies Profiled in the Study
Acme Smoked Fish Holding Corp
Ahipoki Bowl
ALOHA-POKE Co.
Annasea Foods Group
Fishbowl Venture Sdn Bhd
FreshFinPoke
HARTFORD-POKE Co.
HEALTHY-POKE SL
ia poke
Island Fin-Poke Co.
MTY Food Group Inc
OnoPoke Food Shop
POKED
PokeMe Group Pty Ltd
Pokeworks
RedPoke
Sweetfin
The PokeCo. and wings
The PokeLab
white rabbit projects LLP
*- List Not Exhaustive
Chapter 1. TABLE OF CONTENTS
Chapter 2. Introduction to Poke Foods Market
2.1. Market Overview
2.2. Key Statistics and Report Highlights
2.3. Scope of the Comprehensive Study
2.3.1. Market Definition
2.3.2 Countries and Regions Covered
2.3.3 Research Objective
2.3.4 Units, Currency, and Conversions
2.3.5 Industry Value Chain
2.4. Key Market Segments
2.5. Key Companies
2.6. Study Period
Chapter 3. Strategic Analysis Review
3.1. Poke Foods Pricing Analysis and Forecast
3.2. Porter’s Five Forces
3.3. Market Ecosystem
3.4. SWOT Analysis
3.5. Regulatory Scenario
3.3. Effects of Inflation, Russia-Ukraine War, moderating economic growth, and other macroeconomic factors
Chapter 4. Competitive Landscape
4.1. Market Share Analysis
4.1.1. Global Poke Foods Market Share by Company, 2023
4.1.2. Product Offerings of Leading Poke Foods Companies
4.2. Market Entropy
4.2.1. New Product Launches in the Industry
4.2.2. Mergers, Acquisitions, Joint ventures, and Partnerships
4.3. Key Strategies and Best Practices
Chapter 5. Global Market Projections: Best, Reference, and Low Case Scenarios
5.1. Growth Analysis- Case Scenario Definitions
5.2. Low Growth Case Scenario Forecasts
5.3. Reference Growth Case Scenario Forecasts
5.4. High Growth Case Scenario Forecasts
Chapter 6. Market Dynamics
6.1. Poke Foods Market Drivers
6.2. Poke Foods Market Challenges
6.6. Poke Foods Market Opportunities
6.4. Poke Foods Market Trends
Chapter 7. Global Poke Foods Market Outlook Trends
7.1. Global Poke Foods Revenue (USD Million) and CAGR (%) by Type (2021-2032)
7.2. Global Poke Foods Revenue (USD Million) and CAGR (%) by Application (2021-2032)
7.3. Global Poke Foods Revenue (USD Million) and CAGR (%) by Product (2021-2032)
By Product
Varieties of tuna
Others
By Distribution Channel
Offline
Online
Chapter 8. Global Poke Foods Regional Analysis and Outlook
8.1. Global Poke Foods Revenue (USD Million) By Regions (2021- 2032)
8.2. North America Poke Foods Revenue (USD Million) by Country (2021-2032)
8.2.1. United States Poke Foods Regional Analysis and Outlook
8.2.2. Canada Poke Foods Regional Analysis and Outlook
8.2.3. Mexico Poke Foods Regional Analysis and Outlook
8.3. Europe Poke Foods Revenue (USD Million), by Country (2021-2032)
8.3.1. Germany Poke Foods Regional Analysis and Outlook
8.3.2. France Poke Foods Regional Analysis and Outlook
8.3.3. United Kingdom Poke Foods Regional Analysis and Outlook
8.3.4. Spain Poke Foods Regional Analysis and Outlook
8.3.5. Italy Poke Foods Regional Analysis and Outlook
8.3.6. Russia Poke Foods Regional Analysis and Outlook
8.3.7. Rest of Europe Poke Foods Regional Analysis and Outlook
8.4. Asia Pacific Poke Foods Revenue (USD Million) by Country (2021-2032)
8.4.1. China Poke Foods Regional Analysis and Outlook
8.4.2. Japan Poke Foods Regional Analysis and Outlook
8.4.3. India Poke Foods Regional Analysis and Outlook
8.4.4. South Korea Poke Foods Regional Analysis and Outlook
8.4.5. Australia Poke Foods Regional Analysis and Outlook
8.4.6. South East Asia Poke Foods Regional Analysis and Outlook
8.4.7. Rest of Asia Pacific Poke Foods Regional Analysis and Outlook
8.5. South America Poke Foods Revenue (USD Million), by Country (2021-2032)
8.5.1. Brazil Poke Foods Regional Analysis and Outlook
8.5.2. Argentina Poke Foods Regional Analysis and Outlook
8.5.3. Rest of South America Poke Foods Regional Analysis and Outlook
8.6. Middle East and Africa Poke Foods Revenue (USD Million) by Country (2021-2032)
8.6.1. Middle East Poke Foods Regional Analysis and Outlook
8.6.2. Africa Poke Foods Regional Analysis and Outlook
Chapter 9. North America Poke Foods Analysis and Outlook
9.1. North America Poke Foods Revenue (USD Million) by Segments (2021-2032)
9.1.1. North America Poke Foods Revenue (USD Million) by Type (2021-2032)
9.1.2. North America Poke Foods Revenue (USD Million) by Application (2021-2032)
9.1.3. North America Poke Foods Revenue (USD Million) by Product (2021-2032)
By Product
Varieties of tuna
Others
By Distribution Channel
Offline
Online
Chapter 10. Europe Poke Foods Analysis and Outlook
10.1. Europe Poke Foods Revenue (USD Million), by Segments (USD Million) (2021-2032)
10.1.1. Europe Poke Foods Revenue (USD Million) by Type (2021-2032)
10.1.2. Europe Poke Foods Revenue (USD Million) by Application (2021-2032)
10.1.3. Europe Poke Foods Revenue (USD Million) by Product (2021-2032)
By Product
Varieties of tuna
Others
By Distribution Channel
Offline
Online
Chapter 11. Asia Pacific Poke Foods Analysis and Outlook
11.1. Asia Pacific Poke Foods Revenue (USD Million), and Revenue (USD Million) by Segments (2021-2032)
11.1.1. Asia Pacific Poke Foods Revenue (USD Million) by Type (2021-2032)
11.1.2. Asia Pacific Poke Foods Revenue (USD Million) by Application (2021-2032)
11.1.3. Asia Pacific Poke Foods Revenue (USD Million) by Product (2021-2032)
By Product
Varieties of tuna
Others
By Distribution Channel
Offline
Online
Chapter 12. South America Poke Foods Analysis and Outlook
12.1. South America Poke Foods Revenue (USD Million), by Segments (2021-2032)
12.1.1. South America Poke Foods Revenue (USD Million) by Type (2021-2032)
12.1.2. South America Poke Foods Revenue (USD Million) by Application (2021-2032)
12.1.3. South America Poke Foods Revenue (USD Million) by Product (2021-2032)
By Product
Varieties of tuna
Others
By Distribution Channel
Offline
Online
Chapter 13. Middle East and Africa Poke Foods Analysis and Outlook
13.1. Middle East and Africa Poke Foods Revenue (USD Million), by Segments (2021-2032)
13.1.1. Middle East and Africa Poke Foods Revenue (USD Million) by Type (2021-2032)
13.1.2. Middle East and Africa Poke Foods Revenue (USD Million) by Application (2021-2032)
13.1.3. Middle East and Africa Poke Foods Revenue (USD Million) by Product (2021-2032)
By Product
Varieties of tuna
Others
By Distribution Channel
Offline
Online
Chapter 14. Poke Foods Company Profiles
14.1 Business Overview
14.2 Product Profiles
14.3 SWOT Profiles
14.5 Recent Developments
14.6 Financial Profile
List of Companies
Acme Smoked Fish Holding Corp
Ahipoki Bowl
ALOHA-POKE Co.
Annasea Foods Group
Fishbowl Venture Sdn Bhd
FreshFinPoke
HARTFORD-POKE Co.
HEALTHY-POKE SL
ia poke
Island Fin-Poke Co.
MTY Food Group Inc
OnoPoke Food Shop
POKED
PokeMe Group Pty Ltd
Pokeworks
RedPoke
Sweetfin
The PokeCo. and wings
The PokeLab
white rabbit projects LLP
15. Methodology and Data Sources
15.1 Customization Offerings
15.2 Subscription Services
15.3 Related Reports
15.4 Publisher Expertise
LIST OF TABLES
Table 1 Market Segmentation Analysis
Table 2 Global Poke Foods Market Share of Leading Companies, 2023
Table 3 Product Offerings of Leading Companies
Table 4 Low Growth Scenario Forecasts
Table 5 Reference Case Growth Scenario
Table 6 High Growth Case Scenario
Table 7 Global Poke Foods Revenue (USD Million) And CAGR (%) By Type (2021-2032)
Table 8 Global Poke Foods Revenue (USD Million) And CAGR (%) By Application (2021-2032)
Table 9 Global Poke Foods Revenue (USD Million) And CAGR (%) By Product (2021-2032)
Table 10 Global Poke Foods Market Revenue (USD Million) By Regions (2021-2032)
Table 11 Global Poke Foods Market Share (%) By Regions (2021-2032)
Table 12 North America Poke Foods Revenue (USD Million) By Country (2021-2032)
Table 13 Europe Poke Foods Revenue (USD Million) By Country (2021-2032)
Table 14 Asia Pacific Poke Foods Revenue (USD Million) By Country (2021-2032)
Table 15 South America Poke Foods Revenue (USD Million) By Country (2021-2032)
Table 16 Middle East and Africa Poke Foods Revenue (USD Million) By Region (2021-2032)
Table 17 North America Poke Foods Revenue (USD Million) By Type (2021-2032)
Table 18 North America Poke Foods Revenue (USD Million) By Application (2021-2032)
Table 19 North America Poke Foods Revenue (USD Million) By Product (2021-2032)
Table 20 Europe Poke Foods Revenue (USD Million) By Type (2021-2032)
Table 21 Europe Poke Foods Revenue (USD Million) By Application (2021-2032)
Table 22 Europe Poke Foods Revenue (USD Million) By Product (2021-2032)
Table 23 Asia Pacific Poke Foods Revenue (USD Million) By Type (2021-2032)
Table 24 Asia Pacific Poke Foods Revenue (USD Million) By Application (2021-2032)
Table 25 Asia Pacific Poke Foods Revenue (USD Million) By Product (2021-2032)
Table 26 South America Poke Foods Revenue (USD Million) By Type (2021-2032)
Table 27 South America Poke Foods Revenue (USD Million) By Application (2021-2032)
Table 28 South America Poke Foods Revenue (USD Million) By Product (2021-2032)
Table 29 Middle East and Africa Poke Foods Revenue (USD Million) By Type (2021-2032)
Table 30 Middle East and Africa Poke Foods Revenue (USD Million) By Application (2021-2032)
Table 31 Middle East and Africa Poke Foods Revenue (USD Million) By Product (2021-2032)
LIST OF FIGURES
Figure 1. Market Scope
Figure 2. Pricing Forecasts Per Unit, 2023- 2032
Figure 3. Porter’s Five Forces
Figure 4. Global Poke Foods Market Revenue (USD Million) By Regions (2021-2032)
Figure 5. Global Poke Foods Market Share (%) By Regions (2023)
Figure 6. North America Poke Foods Revenue (USD Million) By Country (2021-2032)
Figure 7. United States Poke Foods Revenue (USD Million) By Country (2021-2032)
Figure 8. Canada Poke Foods Revenue (USD Million) By Country (2021-2032)
Figure 9. Mexico Poke Foods Revenue (USD Million) By Country (2021-2032)
Figure 10. Europe Poke Foods Revenue (USD Million) By Country (2021-2032)
Figure 11. Germany Poke Foods Revenue (USD Million) By Country (2021-2032)
Figure 12. France Poke Foods Revenue (USD Million) By Country (2021-2032)
Figure 13. United Kingdom Poke Foods Revenue (USD Million) By Country (2021-2032)
Figure 14. Spain Poke Foods Revenue (USD Million) By Country (2021-2032)
Figure 15. Italy Poke Foods Revenue (USD Million) By Country (2021-2032)
Figure 16. Russia Poke Foods Revenue (USD Million) By Country (2021-2032)
Figure 17. Rest of Europe Poke Foods Revenue (USD Million) By Country (2021-2032)
Figure 11. Asia Pacific Poke Foods Revenue (USD Million) By Country (2021-2032)
Figure 12. China Poke Foods Revenue (USD Million) By Country (2021-2032)
Figure 13. Japan Poke Foods Revenue (USD Million) By Country (2021-2032)
Figure 14. India Poke Foods Revenue (USD Million) By Country (2021-2032)
Figure 15. South Korea Poke Foods Revenue (USD Million) By Country (2021-2032)
Figure 16. Australia Poke Foods Revenue (USD Million) By Country (2021-2032)
Figure 17. South East Asia Poke Foods Revenue (USD Million) By Country (2021-2032)
Figure 18. South America Poke Foods Revenue (USD Million) By Country (2021-2032)
Figure 19. Brazil Poke Foods Revenue (USD Million) By Country (2021-2032)
Figure 20. Argentina Poke Foods Revenue (USD Million) By Country (2021-2032)
Figure 21. Rest of Asia Pacific Poke Foods Revenue (USD Million) By Country (2021-2032)
Figure 22. Middle East and Africa Poke Foods Revenue (USD Million) By Region (2021-2032)
Figure 23. Saudi Arabia Poke Foods Revenue (USD Million) By Region (2021-2032)
Figure 24. The UAE Poke Foods Revenue (USD Million) By Region (2021-2032)
Figure 25. Rest of Middle East Poke Foods Revenue (USD Million) By Region (2021-2032)
Figure 26. South Africa Poke Foods Revenue (USD Million) By Region (2021-2032)
Figure 27. Africa Poke Foods Revenue (USD Million) By Region (2021-2032)
Figure 28. North America Poke Foods Revenue (USD Million) By Type (2021-2032)
Figure 29. North America Poke Foods Revenue (USD Million) By Application (2021-2032)
Figure 30. North America Poke Foods Revenue (USD Million) By Product (2021-2032)
Figure 31. Europe Poke Foods Revenue (USD Million) By Type (2021-2032)
Figure 32. Europe Poke Foods Revenue (USD Million) By Application (2021-2032)
Figure 33. Europe Poke Foods Revenue (USD Million) By Product (2021-2032)
Figure 34. Asia Pacific Poke Foods Revenue (USD Million) By Type (2021-2032)
Figure 35. Asia Pacific Poke Foods Revenue (USD Million) By Application (2021-2032)
Figure 36. Asia Pacific Poke Foods Revenue (USD Million) By Product (2021-2032)
Figure 37. South America Poke Foods Revenue (USD Million) By Type (2021-2032)
Figure 38. South America Poke Foods Revenue (USD Million) By Application (2021-2032)
Figure 39. South America Poke Foods Revenue (USD Million) By Product (2021-2032)
Figure 40. Middle East and Africa Poke Foods Revenue (USD Million) By Type (2021-2032)
Figure 41. Middle East and Africa Poke Foods Revenue (USD Million) By Application (2021-2032)
Figure 42. Middle East and Africa Poke Foods Revenue (USD Million) By Product (2021-2032)
By Product
Varieties of tuna
Others
By Distribution Channel
Offline
Online
Countries Analyzed
North America (US, Canada, Mexico)
Europe (Germany, UK, France, Spain, Italy, Russia, Rest of Europe)
Asia Pacific (China, India, Japan, South Korea, Australia, South East Asia, Rest of Asia)
South America (Brazil, Argentina, Rest of South America)
Middle East and Africa (Saudi Arabia, UAE, Rest of Middle East, South Africa, Egypt, Rest of Africa)
