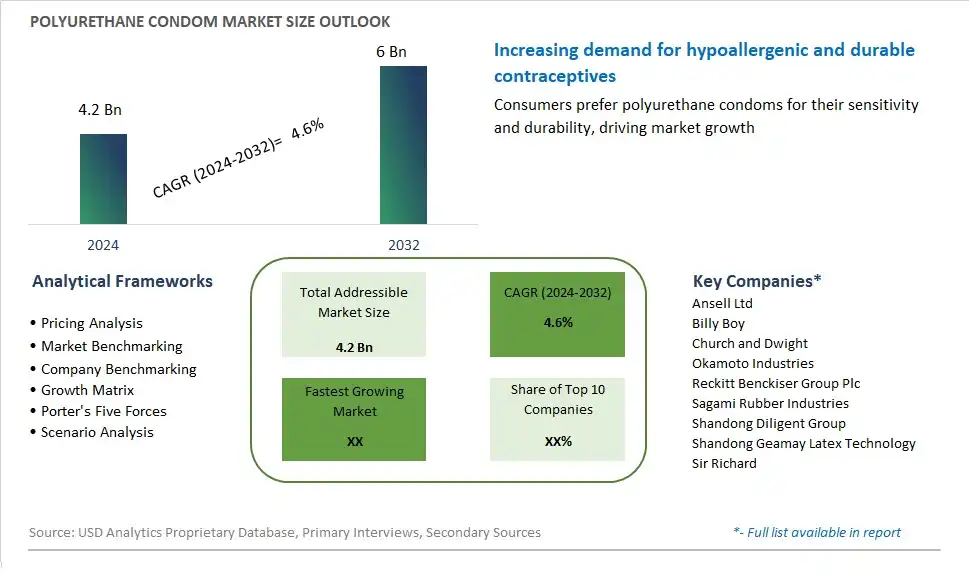
Global Polyurethane Condom Market Size is valued at $4.2 Billion in 2024 and is forecast to register a growth rate (CAGR) of 4.6% to reach $6 Billion by 2032.
The global Polyurethane Condom Market Comprehensive Study analyzes and forecasts the market size across 6 regions and 24 countries for diverse segments -By Type (Polyester Polyurethane, Polyether Polyurethane), By Product (Male Condom, Female Condom), By Distribution Channel (Mass Merchandizers, Drug Stores, E-commerce)
An Introduction to Polyurethane Condom Market
In 2024, the market for polyurethane condoms is gaining traction as consumers seek alternatives to traditional latex condoms for safer and more pleasurable sexual experiences. Polyurethane condoms are made from a synthetic material that is thinner, stronger, and more heat-sensitive than latex, offering increased sensitivity and reduced risk of allergic reactions for individuals with latex sensitivities or allergies. Additionally, polyurethane condoms are compatible with oil-based lubricants, making them a versatile choice for couples seeking enhanced comfort and sensation during intimacy. With growing awareness of sexual health and contraceptive options, as well as shifting attitudes towards sexual wellness and pleasure, polyurethane condoms are becoming increasingly popular among sexually active individuals of all genders and orientations. Moreover, the availability of polyurethane condoms in a variety of sizes, textures, and styles caters to diverse preferences and needs, further driving adoption in the market.
Polyurethane Condom Competitive Landscape
The market report analyses the leading companies in the industry including Ansell Ltd, Billy Boy, Church and Dwight, Okamoto Industries, Reckitt Benckiser Group Plc, Sagami Rubber Industries, Shandong Diligent Group, Shandong Geamay Latex Technology, Sir Richard, and Others.
Polyurethane Condom Market Dynamics
Polyurethane Condom Market Trend: Shift Towards Non-Latex Condoms and Increased Focus on Sensory Experience
One prominent trend in the polyurethane condom market is the shift towards non-latex condoms and an increased focus on the sensory experience during sexual activity. As consumers become more aware of latex allergies and sensitivities, there is a growing preference for alternative materials such as polyurethane, which offers hypoallergenic properties and is suitable for individuals with latex allergies. Additionally, polyurethane condoms are thinner and transmit heat better than latex condoms, providing a more natural sensation during intercourse. This trend is driven by the desire for heightened pleasure and intimacy, as well as the recognition of the importance of sexual wellness and satisfaction in relationships. As a result, polyurethane condoms are gaining popularity among sexually active individuals seeking a comfortable, enjoyable, and safe sexual experience.
Market Driver: Rising Awareness of Sexual Health and Prevention of STIs
A key driver propelling the polyurethane condom market is the rising awareness of sexual health and the prevention of sexually transmitted infections (STIs). With increasing education and advocacy efforts surrounding safe sex practices, there is a growing emphasis on the importance of using condoms to prevent the transmission of STIs and unwanted pregnancies. Polyurethane condoms offer effective protection against STIs and unintended pregnancies, making them a preferred choice for individuals who prioritize sexual health and responsibility. This driver is reinforced by healthcare professionals, public health campaigns, and initiatives aimed at promoting condom use as a vital component of comprehensive sexual health education and disease prevention strategies. As awareness of STIs and the importance of safe sex continues to grow, the demand for polyurethane condoms is expected to increase, driving market growth and adoption.
Market Opportunity: Targeting Niche Markets and Diversifying Product Offerings
An opportunity for market expansion in the polyurethane condom segment lies in targeting niche markets and diversifying product offerings. Manufacturers can capitalize on niche demographics such as individuals with latex allergies, vegan consumers, or those seeking enhanced sensory experiences during intercourse. By catering to specific needs and preferences, such as offering flavored or textured polyurethane condoms, manufacturers can appeal to a broader audience and differentiate their products from traditional latex condoms. Additionally, there is an opportunity to explore partnerships with sexual wellness brands, healthcare providers, and advocacy groups to promote the benefits of polyurethane condoms and expand market reach. By tapping into niche markets and diversifying product offerings, manufacturers can unlock new revenue streams and gain a competitive edge in the polyurethane condom market.
Polyurethane Condom Market Share Analysis: Polyester Polyurethane held the dominant market share in 2024
In the Polyurethane Condom Market, the Polyester Polyurethane segment is the largest due to several key factors. Polyester polyurethane condoms are widely favored for their durability, elasticity, and enhanced sensitivity, making them a preferred choice among consumers seeking reliable protection without sacrificing comfort or sensation. The material's strength and flexibility allow for a snug and secure fit, reducing the risk of breakage during intercourse. Further, polyester polyurethane condoms are compatible with both water-based and silicone-based lubricants, offering versatility and convenience for users. Additionally, the widespread availability of polyester polyurethane condoms in various retail outlets, pharmacies, and online platforms contributes to their dominance in the market. Furthermore, the increasing awareness about sexually transmitted infections (STIs) and the importance of safe sex practices further drive the demand for polyester polyurethane condoms, reinforcing their position as the largest segment in the Polyurethane Condom Market.
Polyurethane Condom Market Share Analysis: Female Condoms market is poised to register the fastest growth rae over the forecast period to 2032
In the Polyurethane Condom Market, the Female Condom segment is experiencing the most rapid growth, driven by several key factors. Female condoms offer women greater control over their sexual health and protection, empowering them to take proactive measures to prevent unwanted pregnancies and sexually transmitted infections (STIs). Further, female condoms provide a non-hormonal contraceptive option for women, offering an alternative to traditional male condoms and other forms of birth control. Additionally, the increasing awareness about the importance of female reproductive health and gender equality further drives the demand for female condoms, leading to their rising popularity and adoption. Furthermore, advancements in female condom design and materials, including polyurethane, contribute to improved comfort, reliability, and ease of use, enhancing the appeal of this contraceptive option among women. As a result, the Female Condom segment is witnessing significant growth within the Polyurethane Condom Market, fueled by its empowerment of women, contraceptive efficacy, and expanding market acceptance.
Polyurethane Condom Market Share Analysis: Drug Stores held the dominant market share in 2024
When considering the Polyurethane Condom Market, it's evident that the Drug Stores segment is the largest. This can be attributed to various factors intricately woven into the fabric of consumer behavior and market dynamics. Drug stores, also known as pharmacies, epitomize convenience and reliability, serving as trusted havens for individuals seeking health and wellness products. Their strategic placement in communities ensures accessibility to a broad spectrum of consumers. Further, drug stores boast a curated selection of contraceptive options, including polyurethane condoms, thus becoming natural destinations for those prioritizing their sexual health. The knowledgeable pharmacists and staff provide invaluable guidance, answering queries, and offering recommendations, fostering a sense of trust and assurance among customers. Additionally, drug stores maintain stringent quality control measures, ensuring that only premium-grade products, including polyurethane condoms, grace their shelves. This commitment to quality resonates deeply with consumers, further solidifying drug stores' status as the go-to destination for polyurethane condoms. Furthermore, the discreet and professional environment of drug stores instills a sense of comfort and confidentiality, encouraging individuals to browse and purchase contraceptives without hesitation or embarrassment. The comprehensive range of polyurethane condoms available at drug stores caters to diverse preferences and needs, reinforcing their appeal to a wide demographic. As a result, the Drug Stores segment stands tall as the largest in the Polyurethane Condom Market, underpinned by a blend of accessibility, expertise, quality assurance, and consumer trust.
Polyurethane Condom Market Segmentation
By Type
Polyester Polyurethane
Polyether Polyurethane
By Product
Male Condom
Female Condom
By Distribution Channel
Mass Merchandizers
Drug Stores
E-commerce
Countries Analyzed
North America (US, Canada, Mexico)
Europe (Germany, UK, France, Spain, Italy, Russia, Rest of Europe)
Asia Pacific (China, India, Japan, South Korea, Australia, South East Asia, Rest of Asia)
South America (Brazil, Argentina, Rest of South America)
Middle East and Africa (Saudi Arabia, UAE, Rest of Middle East, South Africa, Egypt, Rest of Africa)
Polyurethane Condom Companies Profiled in the Study
Ansell Ltd
Billy Boy
Church and Dwight
Okamoto Industries
Reckitt Benckiser Group Plc
Sagami Rubber Industries
Shandong Diligent Group
Shandong Geamay Latex Technology
Sir Richard
*- List Not Exhaustive
Chapter 1. TABLE OF CONTENTS
Chapter 2. Introduction to Polyurethane Condom Market
2.1. Market Overview
2.2. Key Statistics and Report Highlights
2.3. Scope of the Comprehensive Study
2.3.1. Market Definition
2.3.2 Countries and Regions Covered
2.3.3 Research Objective
2.3.4 Units, Currency, and Conversions
2.3.5 Industry Value Chain
2.4. Key Market Segments
2.5. Key Companies
2.6. Study Period
Chapter 3. Strategic Analysis Review
3.1. Polyurethane Condom Pricing Analysis and Forecast
3.2. Porter’s Five Forces
3.3. Market Ecosystem
3.4. SWOT Analysis
3.5. Regulatory Scenario
3.3. Effects of Inflation, Russia-Ukraine War, moderating economic growth, and other macroeconomic factors
Chapter 4. Competitive Landscape
4.1. Market Share Analysis
4.1.1. Global Polyurethane Condom Market Share by Company, 2023
4.1.2. Product Offerings of Leading Polyurethane Condom Companies
4.2. Market Entropy
4.2.1. New Product Launches in the Industry
4.2.2. Mergers, Acquisitions, Joint ventures, and Partnerships
4.3. Key Strategies and Best Practices
Chapter 5. Global Market Projections: Best, Reference, and Low Case Scenarios
5.1. Growth Analysis- Case Scenario Definitions
5.2. Low Growth Case Scenario Forecasts
5.3. Reference Growth Case Scenario Forecasts
5.4. High Growth Case Scenario Forecasts
Chapter 6. Market Dynamics
6.1. Polyurethane Condom Market Drivers
6.2. Polyurethane Condom Market Challenges
6.6. Polyurethane Condom Market Opportunities
6.4. Polyurethane Condom Market Trends
Chapter 7. Global Polyurethane Condom Market Outlook Trends
7.1. Global Polyurethane Condom Revenue (USD Million) and CAGR (%) by Type (2021-2032)
7.2. Global Polyurethane Condom Revenue (USD Million) and CAGR (%) by Application (2021-2032)
7.3. Global Polyurethane Condom Revenue (USD Million) and CAGR (%) by Product (2021-2032)
By Type
Polyester Polyurethane
Polyether Polyurethane
By Product
Male Condom
Female Condom
By Distribution Channel
Mass Merchandizers
Drug Stores
E-commerce
Chapter 8. Global Polyurethane Condom Regional Analysis and Outlook
8.1. Global Polyurethane Condom Revenue (USD Million) By Regions (2021- 2032)
8.2. North America Polyurethane Condom Revenue (USD Million) by Country (2021-2032)
8.2.1. United States Polyurethane Condom Regional Analysis and Outlook
8.2.2. Canada Polyurethane Condom Regional Analysis and Outlook
8.2.3. Mexico Polyurethane Condom Regional Analysis and Outlook
8.3. Europe Polyurethane Condom Revenue (USD Million), by Country (2021-2032)
8.3.1. Germany Polyurethane Condom Regional Analysis and Outlook
8.3.2. France Polyurethane Condom Regional Analysis and Outlook
8.3.3. United Kingdom Polyurethane Condom Regional Analysis and Outlook
8.3.4. Spain Polyurethane Condom Regional Analysis and Outlook
8.3.5. Italy Polyurethane Condom Regional Analysis and Outlook
8.3.6. Russia Polyurethane Condom Regional Analysis and Outlook
8.3.7. Rest of Europe Polyurethane Condom Regional Analysis and Outlook
8.4. Asia Pacific Polyurethane Condom Revenue (USD Million) by Country (2021-2032)
8.4.1. China Polyurethane Condom Regional Analysis and Outlook
8.4.2. Japan Polyurethane Condom Regional Analysis and Outlook
8.4.3. India Polyurethane Condom Regional Analysis and Outlook
8.4.4. South Korea Polyurethane Condom Regional Analysis and Outlook
8.4.5. Australia Polyurethane Condom Regional Analysis and Outlook
8.4.6. South East Asia Polyurethane Condom Regional Analysis and Outlook
8.4.7. Rest of Asia Pacific Polyurethane Condom Regional Analysis and Outlook
8.5. South America Polyurethane Condom Revenue (USD Million), by Country (2021-2032)
8.5.1. Brazil Polyurethane Condom Regional Analysis and Outlook
8.5.2. Argentina Polyurethane Condom Regional Analysis and Outlook
8.5.3. Rest of South America Polyurethane Condom Regional Analysis and Outlook
8.6. Middle East and Africa Polyurethane Condom Revenue (USD Million) by Country (2021-2032)
8.6.1. Middle East Polyurethane Condom Regional Analysis and Outlook
8.6.2. Africa Polyurethane Condom Regional Analysis and Outlook
Chapter 9. North America Polyurethane Condom Analysis and Outlook
9.1. North America Polyurethane Condom Revenue (USD Million) by Segments (2021-2032)
9.1.1. North America Polyurethane Condom Revenue (USD Million) by Type (2021-2032)
9.1.2. North America Polyurethane Condom Revenue (USD Million) by Application (2021-2032)
9.1.3. North America Polyurethane Condom Revenue (USD Million) by Product (2021-2032)
By Type
Polyester Polyurethane
Polyether Polyurethane
By Product
Male Condom
Female Condom
By Distribution Channel
Mass Merchandizers
Drug Stores
E-commerce
Chapter 10. Europe Polyurethane Condom Analysis and Outlook
10.1. Europe Polyurethane Condom Revenue (USD Million), by Segments (USD Million) (2021-2032)
10.1.1. Europe Polyurethane Condom Revenue (USD Million) by Type (2021-2032)
10.1.2. Europe Polyurethane Condom Revenue (USD Million) by Application (2021-2032)
10.1.3. Europe Polyurethane Condom Revenue (USD Million) by Product (2021-2032)
By Type
Polyester Polyurethane
Polyether Polyurethane
By Product
Male Condom
Female Condom
By Distribution Channel
Mass Merchandizers
Drug Stores
E-commerce
Chapter 11. Asia Pacific Polyurethane Condom Analysis and Outlook
11.1. Asia Pacific Polyurethane Condom Revenue (USD Million), and Revenue (USD Million) by Segments (2021-2032)
11.1.1. Asia Pacific Polyurethane Condom Revenue (USD Million) by Type (2021-2032)
11.1.2. Asia Pacific Polyurethane Condom Revenue (USD Million) by Application (2021-2032)
11.1.3. Asia Pacific Polyurethane Condom Revenue (USD Million) by Product (2021-2032)
By Type
Polyester Polyurethane
Polyether Polyurethane
By Product
Male Condom
Female Condom
By Distribution Channel
Mass Merchandizers
Drug Stores
E-commerce
Chapter 12. South America Polyurethane Condom Analysis and Outlook
12.1. South America Polyurethane Condom Revenue (USD Million), by Segments (2021-2032)
12.1.1. South America Polyurethane Condom Revenue (USD Million) by Type (2021-2032)
12.1.2. South America Polyurethane Condom Revenue (USD Million) by Application (2021-2032)
12.1.3. South America Polyurethane Condom Revenue (USD Million) by Product (2021-2032)
By Type
Polyester Polyurethane
Polyether Polyurethane
By Product
Male Condom
Female Condom
By Distribution Channel
Mass Merchandizers
Drug Stores
E-commerce
Chapter 13. Middle East and Africa Polyurethane Condom Analysis and Outlook
13.1. Middle East and Africa Polyurethane Condom Revenue (USD Million), by Segments (2021-2032)
13.1.1. Middle East and Africa Polyurethane Condom Revenue (USD Million) by Type (2021-2032)
13.1.2. Middle East and Africa Polyurethane Condom Revenue (USD Million) by Application (2021-2032)
13.1.3. Middle East and Africa Polyurethane Condom Revenue (USD Million) by Product (2021-2032)
By Type
Polyester Polyurethane
Polyether Polyurethane
By Product
Male Condom
Female Condom
By Distribution Channel
Mass Merchandizers
Drug Stores
E-commerce
Chapter 14. Polyurethane Condom Company Profiles
14.1 Business Overview
14.2 Product Profiles
14.3 SWOT Profiles
14.5 Recent Developments
14.6 Financial Profile
List of Companies
Ansell Ltd
Billy Boy
Church and Dwight
Okamoto Industries
Reckitt Benckiser Group Plc
Sagami Rubber Industries
Shandong Diligent Group
Shandong Geamay Latex Technology
Sir Richard
15. Methodology and Data Sources
15.1 Customization Offerings
15.2 Subscription Services
15.3 Related Reports
15.4 Publisher Expertise
LIST OF TABLES
Table 1 Market Segmentation Analysis
Table 2 Global Polyurethane Condom Market Share of Leading Companies, 2023
Table 3 Product Offerings of Leading Companies
Table 4 Low Growth Scenario Forecasts
Table 5 Reference Case Growth Scenario
Table 6 High Growth Case Scenario
Table 7 Global Polyurethane Condom Revenue (USD Million) And CAGR (%) By Type (2021-2032)
Table 8 Global Polyurethane Condom Revenue (USD Million) And CAGR (%) By Application (2021-2032)
Table 9 Global Polyurethane Condom Revenue (USD Million) And CAGR (%) By Product (2021-2032)
Table 10 Global Polyurethane Condom Market Revenue (USD Million) By Regions (2021-2032)
Table 11 Global Polyurethane Condom Market Share (%) By Regions (2021-2032)
Table 12 North America Polyurethane Condom Revenue (USD Million) By Country (2021-2032)
Table 13 Europe Polyurethane Condom Revenue (USD Million) By Country (2021-2032)
Table 14 Asia Pacific Polyurethane Condom Revenue (USD Million) By Country (2021-2032)
Table 15 South America Polyurethane Condom Revenue (USD Million) By Country (2021-2032)
Table 16 Middle East and Africa Polyurethane Condom Revenue (USD Million) By Region (2021-2032)
Table 17 North America Polyurethane Condom Revenue (USD Million) By Type (2021-2032)
Table 18 North America Polyurethane Condom Revenue (USD Million) By Application (2021-2032)
Table 19 North America Polyurethane Condom Revenue (USD Million) By Product (2021-2032)
Table 20 Europe Polyurethane Condom Revenue (USD Million) By Type (2021-2032)
Table 21 Europe Polyurethane Condom Revenue (USD Million) By Application (2021-2032)
Table 22 Europe Polyurethane Condom Revenue (USD Million) By Product (2021-2032)
Table 23 Asia Pacific Polyurethane Condom Revenue (USD Million) By Type (2021-2032)
Table 24 Asia Pacific Polyurethane Condom Revenue (USD Million) By Application (2021-2032)
Table 25 Asia Pacific Polyurethane Condom Revenue (USD Million) By Product (2021-2032)
Table 26 South America Polyurethane Condom Revenue (USD Million) By Type (2021-2032)
Table 27 South America Polyurethane Condom Revenue (USD Million) By Application (2021-2032)
Table 28 South America Polyurethane Condom Revenue (USD Million) By Product (2021-2032)
Table 29 Middle East and Africa Polyurethane Condom Revenue (USD Million) By Type (2021-2032)
Table 30 Middle East and Africa Polyurethane Condom Revenue (USD Million) By Application (2021-2032)
Table 31 Middle East and Africa Polyurethane Condom Revenue (USD Million) By Product (2021-2032)
LIST OF FIGURES
Figure 1. Market Scope
Figure 2. Pricing Forecasts Per Unit, 2023- 2032
Figure 3. Porter’s Five Forces
Figure 4. Global Polyurethane Condom Market Revenue (USD Million) By Regions (2021-2032)
Figure 5. Global Polyurethane Condom Market Share (%) By Regions (2023)
Figure 6. North America Polyurethane Condom Revenue (USD Million) By Country (2021-2032)
Figure 7. United States Polyurethane Condom Revenue (USD Million) By Country (2021-2032)
Figure 8. Canada Polyurethane Condom Revenue (USD Million) By Country (2021-2032)
Figure 9. Mexico Polyurethane Condom Revenue (USD Million) By Country (2021-2032)
Figure 10. Europe Polyurethane Condom Revenue (USD Million) By Country (2021-2032)
Figure 11. Germany Polyurethane Condom Revenue (USD Million) By Country (2021-2032)
Figure 12. France Polyurethane Condom Revenue (USD Million) By Country (2021-2032)
Figure 13. United Kingdom Polyurethane Condom Revenue (USD Million) By Country (2021-2032)
Figure 14. Spain Polyurethane Condom Revenue (USD Million) By Country (2021-2032)
Figure 15. Italy Polyurethane Condom Revenue (USD Million) By Country (2021-2032)
Figure 16. Russia Polyurethane Condom Revenue (USD Million) By Country (2021-2032)
Figure 17. Rest of Europe Polyurethane Condom Revenue (USD Million) By Country (2021-2032)
Figure 11. Asia Pacific Polyurethane Condom Revenue (USD Million) By Country (2021-2032)
Figure 12. China Polyurethane Condom Revenue (USD Million) By Country (2021-2032)
Figure 13. Japan Polyurethane Condom Revenue (USD Million) By Country (2021-2032)
Figure 14. India Polyurethane Condom Revenue (USD Million) By Country (2021-2032)
Figure 15. South Korea Polyurethane Condom Revenue (USD Million) By Country (2021-2032)
Figure 16. Australia Polyurethane Condom Revenue (USD Million) By Country (2021-2032)
Figure 17. South East Asia Polyurethane Condom Revenue (USD Million) By Country (2021-2032)
Figure 18. South America Polyurethane Condom Revenue (USD Million) By Country (2021-2032)
Figure 19. Brazil Polyurethane Condom Revenue (USD Million) By Country (2021-2032)
Figure 20. Argentina Polyurethane Condom Revenue (USD Million) By Country (2021-2032)
Figure 21. Rest of Asia Pacific Polyurethane Condom Revenue (USD Million) By Country (2021-2032)
Figure 22. Middle East and Africa Polyurethane Condom Revenue (USD Million) By Region (2021-2032)
Figure 23. Saudi Arabia Polyurethane Condom Revenue (USD Million) By Region (2021-2032)
Figure 24. The UAE Polyurethane Condom Revenue (USD Million) By Region (2021-2032)
Figure 25. Rest of Middle East Polyurethane Condom Revenue (USD Million) By Region (2021-2032)
Figure 26. South Africa Polyurethane Condom Revenue (USD Million) By Region (2021-2032)
Figure 27. Africa Polyurethane Condom Revenue (USD Million) By Region (2021-2032)
Figure 28. North America Polyurethane Condom Revenue (USD Million) By Type (2021-2032)
Figure 29. North America Polyurethane Condom Revenue (USD Million) By Application (2021-2032)
Figure 30. North America Polyurethane Condom Revenue (USD Million) By Product (2021-2032)
Figure 31. Europe Polyurethane Condom Revenue (USD Million) By Type (2021-2032)
Figure 32. Europe Polyurethane Condom Revenue (USD Million) By Application (2021-2032)
Figure 33. Europe Polyurethane Condom Revenue (USD Million) By Product (2021-2032)
Figure 34. Asia Pacific Polyurethane Condom Revenue (USD Million) By Type (2021-2032)
Figure 35. Asia Pacific Polyurethane Condom Revenue (USD Million) By Application (2021-2032)
Figure 36. Asia Pacific Polyurethane Condom Revenue (USD Million) By Product (2021-2032)
Figure 37. South America Polyurethane Condom Revenue (USD Million) By Type (2021-2032)
Figure 38. South America Polyurethane Condom Revenue (USD Million) By Application (2021-2032)
Figure 39. South America Polyurethane Condom Revenue (USD Million) By Product (2021-2032)
Figure 40. Middle East and Africa Polyurethane Condom Revenue (USD Million) By Type (2021-2032)
Figure 41. Middle East and Africa Polyurethane Condom Revenue (USD Million) By Application (2021-2032)
Figure 42. Middle East and Africa Polyurethane Condom Revenue (USD Million) By Product (2021-2032)
By Type
Polyester Polyurethane
Polyether Polyurethane
By Product
Male Condom
Female Condom
By Distribution Channel
Mass Merchandizers
Drug Stores
E-commerce
Countries Analyzed
North America (US, Canada, Mexico)
Europe (Germany, UK, France, Spain, Italy, Russia, Rest of Europe)
Asia Pacific (China, India, Japan, South Korea, Australia, South East Asia, Rest of Asia)
South America (Brazil, Argentina, Rest of South America)
Middle East and Africa (Saudi Arabia, UAE, Rest of Middle East, South Africa, Egypt, Rest of Africa)
