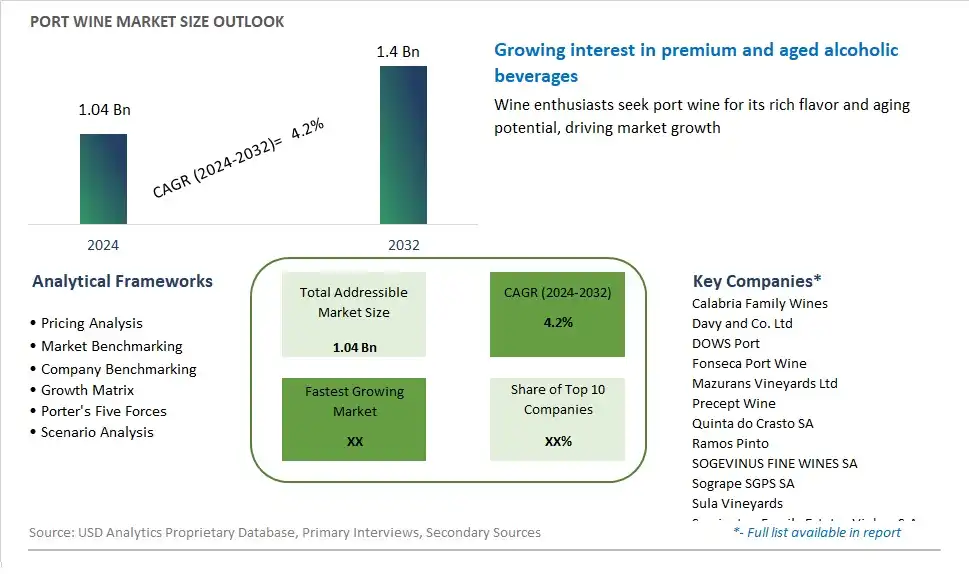
Global Port Wine Market Size is valued at $1.04 Billion in 2024 and is forecast to register a growth rate (CAGR) of 4.2% to reach $1.4 Billion by 2032.
The global Port Wine Market Comprehensive Study analyzes and forecasts the market size across 6 regions and 24 countries for diverse segments -By Nature (Red, White), By Type (Ruby, Tawny, Vintage), By Distribution Channel (Online, Offline)
An Introduction to Port Wine Market
In 2024, the market for port wine continues to thrive as consumers appreciate the rich history, unique flavors, and artisanal craftsmanship associated with this renowned fortified wine. Port wine, produced exclusively in the Douro Valley of Portugal, is celebrated for its depth, complexity, and versatility, ranging from dry and fruity styles to sweet and aged varieties. With centuries of winemaking tradition and expertise, port wine producers continue to innovate with new grape varietals, aging techniques, and blending methods to satisfy evolving consumer tastes and preferences. Moreover, as consumers seek authentic and experiential beverages, port wine tourism experiences, including vineyard tours, tastings, and food pairings, are gaining popularity, further enhancing the allure and global appeal of this iconic wine.
Port Wine Competitive Landscape
The market report analyses the leading companies in the industry including Calabria Family Wines, Davy and Co. Ltd, DOWS Port, Fonseca Port Wine, Mazurans Vineyards Ltd, Precept Wine, Quinta do Crasto SA, Ramos Pinto, SOGEVINUS FINE WINES SA, Sogrape SGPS SA, Sula Vineyards, Symington Family Estates Vinhos S.A., Taylors Port, THE FLADGATE PARTNERSHIP, The Great Wine Co., Van Zellers and Co., Vinbros and Co., Vinimark Trading Pty Ltd, Vinoquel Vinhos Oscar Quevedo Lda, and Others.
Port Wine Market Dynamics
Port Wine Market Trend: Growing Interest in Specialty and Craft Beverages
One prominent trend in the port wine market is the growing interest in specialty and craft beverages. As consumers seek unique and premium drinking experiences, there has been a resurgence of interest in traditional and artisanal alcoholic beverages such as port wine. Port wine, with its rich history, complex flavors, and distinct production methods, appeals to consumers looking to explore new taste sensations and indulge in luxury experiences. This trend is driven by a desire for authenticity, craftsmanship, and sophistication in beverage choices, as well as a growing appreciation for the cultural and heritage aspects of wine production. As a result, port wine is gaining popularity among wine enthusiasts, connoisseurs, and millennials seeking memorable and distinctive drinking experiences.
Market Driver: Increasing Demand for Premium and Luxury Wines
A key driver propelling the port wine market is the increasing demand for premium and luxury wines. With rising disposable incomes and changing consumer preferences, there is a growing appetite for high-quality and exclusive wine offerings that signify status, refinement, and prestige. Port wine, known for its complex flavors, aging potential, and association with elegance and sophistication, appeals to affluent consumers and wine aficionados seeking indulgent and memorable drinking experiences. This driver is reinforced by the influence of wine critics, sommeliers, and influencers who promote port wine as a symbol of luxury and connoisseurship. As demand for premium wines continues to rise globally, port wine stands to benefit from its association with exclusivity and timeless appeal.
Market Opportunity: Market Expansion through Education and Experiential Marketing
An opportunity for market expansion in the port wine segment lies in education and experiential marketing initiatives. Manufacturers and producers can capitalize on consumer curiosity and interest in wine culture by offering educational experiences such as tastings, tours, and workshops that highlight the unique characteristics and production techniques of port wine. By educating consumers about the history, varieties, and food pairing possibilities of port wine, producers can cultivate a deeper appreciation and understanding of the product, driving increased consumption and loyalty. Additionally, there is an opportunity to leverage experiential marketing strategies such as pop-up events, immersive tastings, and digital platforms to engage with consumers and create memorable brand experiences. By providing opportunities for consumers to engage with the brand in meaningful ways, producers can enhance brand awareness, loyalty, and market penetration in the competitive wine industry.
Port Wine Market Share Analysis: Red Port Wine held the dominant market share in 2024
In the Port Wine Market, the Red segment is the largest, propelled by several key factors deeply entrenched in consumer preferences and market dynamics. Red port wine, characterized by its rich flavors, deep color, and velvety texture, holds a timeless appeal among wine enthusiasts worldwide. The robust and complex taste profile of red port wine, often featuring notes of dark fruits, spices, and oak, resonates with connoisseurs seeking a sensory experience that is both indulgent and satisfying. Further, red port wine's versatility in pairing with a wide range of foods, from cheeses to chocolates, further enhances its allure as a beverage for various occasions and culinary adventures. Additionally, the historical significance and cultural heritage associated with red port wine, particularly in regions such as the Douro Valley of Portugal, contribute to its enduring popularity and market dominance. Furthermore, the consistent quality and craftsmanship exhibited by renowned producers and wineries in crafting red port wines underscore their status as preferred choices among discerning consumers. As a result, the Red Port Wine segment stands as the largest in the market, driven by its timeless appeal, culinary versatility, and rich cultural heritage.
Port Wine Market Share Analysis: Ruby Port Wine market is poised to register the fastest growth rae over the forecast period to 2032
Within the Port Wine Market, the Ruby segment is experiencing the most rapid growth, propelled by several key factors indicative of evolving consumer preferences and market trends. Ruby port wine, characterized by its vibrant red color and fruity flavors, appeals to a younger demographic of wine enthusiasts seeking accessible and approachable options. The bold and lively taste profile of ruby port wine, featuring notes of red berries, cherries, and spices, resonates with consumers seeking refreshing and flavorful drinking experiences. Further, ruby port wine's versatility in pairing with a variety of foods, from casual to fine dining, further enhances its appeal among modern consumers looking for versatile beverage options. Additionally, the rise of mixology and cocktail culture has spurred interest in ruby port wine as a key ingredient in innovative and creative cocktails, expanding its reach beyond traditional consumption settings. Furthermore, the affordability and accessibility of ruby port wine compared to other types, such as vintage port, contribute to its growing popularity and market penetration. As a result, the Ruby Port Wine segment stands as the fastest-growing in the market, driven by its vibrant flavors, versatility, and appeal to a dynamic consumer base.
Port Wine Market Share Analysis: Offline Distribution Channel held the dominant market share in 2024
In the Port Wine Market, the Offline Distribution Channel segment is the largest, driven by several key factors intrinsic to consumer behavior and market dynamics. Offline channels, including specialty wine shops, supermarkets, liquor stores, and wine cellars, have long been the traditional avenues for purchasing port wine. These brick-and-mortar establishments offer a tangible and immersive shopping experience, allowing consumers to browse through a curated selection of wines, including port, while engaging with knowledgeable staff for recommendations and guidance. Further, offline distribution channels provide a sense of trust and reliability, with consumers often preferring to physically inspect and select their preferred bottles of port wine. Additionally, the social aspect of wine shopping, such as attending tastings or events at wine stores, contributes to the allure of offline channels. Furthermore, the personal touch and customer service offered by offline retailers foster strong brand loyalty and repeat business, further solidifying the dominance of this segment in the Port Wine Market. As a result, the Offline Distribution Channel segment remains the largest, supported by its established presence, personalized shopping experiences, and enduring appeal to wine enthusiasts.
Port Wine Market Segmentation
By Nature
Red
White
By Type
Ruby
Tawny
Vintage
By Distribution Channel
Online
Offline
Countries Analyzed
North America (US, Canada, Mexico)
Europe (Germany, UK, France, Spain, Italy, Russia, Rest of Europe)
Asia Pacific (China, India, Japan, South Korea, Australia, South East Asia, Rest of Asia)
South America (Brazil, Argentina, Rest of South America)
Middle East and Africa (Saudi Arabia, UAE, Rest of Middle East, South Africa, Egypt, Rest of Africa)
Port Wine Companies Profiled in the Study
Calabria Family Wines
Davy and Co. Ltd
DOWS Port
Fonseca Port Wine
Mazurans Vineyards Ltd
Precept Wine
Quinta do Crasto SA
Ramos Pinto
SOGEVINUS FINE WINES SA
Sogrape SGPS SA
Sula Vineyards
Symington Family Estates Vinhos S.A.
Taylors Port
THE FLADGATE PARTNERSHIP
The Great Wine Co.
Van Zellers and Co.
Vinbros and Co.
Vinimark Trading Pty Ltd
Vinoquel Vinhos Oscar Quevedo Lda
*- List Not Exhaustive
Chapter 1. TABLE OF CONTENTS
Chapter 2. Introduction to Port Wine Market
2.1. Market Overview
2.2. Key Statistics and Report Highlights
2.3. Scope of the Comprehensive Study
2.3.1. Market Definition
2.3.2 Countries and Regions Covered
2.3.3 Research Objective
2.3.4 Units, Currency, and Conversions
2.3.5 Industry Value Chain
2.4. Key Market Segments
2.5. Key Companies
2.6. Study Period
Chapter 3. Strategic Analysis Review
3.1. Port Wine Pricing Analysis and Forecast
3.2. Porter’s Five Forces
3.3. Market Ecosystem
3.4. SWOT Analysis
3.5. Regulatory Scenario
3.3. Effects of Inflation, Russia-Ukraine War, moderating economic growth, and other macroeconomic factors
Chapter 4. Competitive Landscape
4.1. Market Share Analysis
4.1.1. Global Port Wine Market Share by Company, 2023
4.1.2. Product Offerings of Leading Port Wine Companies
4.2. Market Entropy
4.2.1. New Product Launches in the Industry
4.2.2. Mergers, Acquisitions, Joint ventures, and Partnerships
4.3. Key Strategies and Best Practices
Chapter 5. Global Market Projections: Best, Reference, and Low Case Scenarios
5.1. Growth Analysis- Case Scenario Definitions
5.2. Low Growth Case Scenario Forecasts
5.3. Reference Growth Case Scenario Forecasts
5.4. High Growth Case Scenario Forecasts
Chapter 6. Market Dynamics
6.1. Port Wine Market Drivers
6.2. Port Wine Market Challenges
6.6. Port Wine Market Opportunities
6.4. Port Wine Market Trends
Chapter 7. Global Port Wine Market Outlook Trends
7.1. Global Port Wine Revenue (USD Million) and CAGR (%) by Type (2021-2032)
7.2. Global Port Wine Revenue (USD Million) and CAGR (%) by Application (2021-2032)
7.3. Global Port Wine Revenue (USD Million) and CAGR (%) by Product (2021-2032)
By Nature
Red
White
By Type
Ruby
Tawny
Vintage
By Distribution Channel
Online
Offline
Chapter 8. Global Port Wine Regional Analysis and Outlook
8.1. Global Port Wine Revenue (USD Million) By Regions (2021- 2032)
8.2. North America Port Wine Revenue (USD Million) by Country (2021-2032)
8.2.1. United States Port Wine Regional Analysis and Outlook
8.2.2. Canada Port Wine Regional Analysis and Outlook
8.2.3. Mexico Port Wine Regional Analysis and Outlook
8.3. Europe Port Wine Revenue (USD Million), by Country (2021-2032)
8.3.1. Germany Port Wine Regional Analysis and Outlook
8.3.2. France Port Wine Regional Analysis and Outlook
8.3.3. United Kingdom Port Wine Regional Analysis and Outlook
8.3.4. Spain Port Wine Regional Analysis and Outlook
8.3.5. Italy Port Wine Regional Analysis and Outlook
8.3.6. Russia Port Wine Regional Analysis and Outlook
8.3.7. Rest of Europe Port Wine Regional Analysis and Outlook
8.4. Asia Pacific Port Wine Revenue (USD Million) by Country (2021-2032)
8.4.1. China Port Wine Regional Analysis and Outlook
8.4.2. Japan Port Wine Regional Analysis and Outlook
8.4.3. India Port Wine Regional Analysis and Outlook
8.4.4. South Korea Port Wine Regional Analysis and Outlook
8.4.5. Australia Port Wine Regional Analysis and Outlook
8.4.6. South East Asia Port Wine Regional Analysis and Outlook
8.4.7. Rest of Asia Pacific Port Wine Regional Analysis and Outlook
8.5. South America Port Wine Revenue (USD Million), by Country (2021-2032)
8.5.1. Brazil Port Wine Regional Analysis and Outlook
8.5.2. Argentina Port Wine Regional Analysis and Outlook
8.5.3. Rest of South America Port Wine Regional Analysis and Outlook
8.6. Middle East and Africa Port Wine Revenue (USD Million) by Country (2021-2032)
8.6.1. Middle East Port Wine Regional Analysis and Outlook
8.6.2. Africa Port Wine Regional Analysis and Outlook
Chapter 9. North America Port Wine Analysis and Outlook
9.1. North America Port Wine Revenue (USD Million) by Segments (2021-2032)
9.1.1. North America Port Wine Revenue (USD Million) by Type (2021-2032)
9.1.2. North America Port Wine Revenue (USD Million) by Application (2021-2032)
9.1.3. North America Port Wine Revenue (USD Million) by Product (2021-2032)
By Nature
Red
White
By Type
Ruby
Tawny
Vintage
By Distribution Channel
Online
Offline
Chapter 10. Europe Port Wine Analysis and Outlook
10.1. Europe Port Wine Revenue (USD Million), by Segments (USD Million) (2021-2032)
10.1.1. Europe Port Wine Revenue (USD Million) by Type (2021-2032)
10.1.2. Europe Port Wine Revenue (USD Million) by Application (2021-2032)
10.1.3. Europe Port Wine Revenue (USD Million) by Product (2021-2032)
By Nature
Red
White
By Type
Ruby
Tawny
Vintage
By Distribution Channel
Online
Offline
Chapter 11. Asia Pacific Port Wine Analysis and Outlook
11.1. Asia Pacific Port Wine Revenue (USD Million), and Revenue (USD Million) by Segments (2021-2032)
11.1.1. Asia Pacific Port Wine Revenue (USD Million) by Type (2021-2032)
11.1.2. Asia Pacific Port Wine Revenue (USD Million) by Application (2021-2032)
11.1.3. Asia Pacific Port Wine Revenue (USD Million) by Product (2021-2032)
By Nature
Red
White
By Type
Ruby
Tawny
Vintage
By Distribution Channel
Online
Offline
Chapter 12. South America Port Wine Analysis and Outlook
12.1. South America Port Wine Revenue (USD Million), by Segments (2021-2032)
12.1.1. South America Port Wine Revenue (USD Million) by Type (2021-2032)
12.1.2. South America Port Wine Revenue (USD Million) by Application (2021-2032)
12.1.3. South America Port Wine Revenue (USD Million) by Product (2021-2032)
By Nature
Red
White
By Type
Ruby
Tawny
Vintage
By Distribution Channel
Online
Offline
Chapter 13. Middle East and Africa Port Wine Analysis and Outlook
13.1. Middle East and Africa Port Wine Revenue (USD Million), by Segments (2021-2032)
13.1.1. Middle East and Africa Port Wine Revenue (USD Million) by Type (2021-2032)
13.1.2. Middle East and Africa Port Wine Revenue (USD Million) by Application (2021-2032)
13.1.3. Middle East and Africa Port Wine Revenue (USD Million) by Product (2021-2032)
By Nature
Red
White
By Type
Ruby
Tawny
Vintage
By Distribution Channel
Online
Offline
Chapter 14. Port Wine Company Profiles
14.1 Business Overview
14.2 Product Profiles
14.3 SWOT Profiles
14.5 Recent Developments
14.6 Financial Profile
List of Companies
Calabria Family Wines
Davy and Co. Ltd
DOWS Port
Fonseca Port Wine
Mazurans Vineyards Ltd
Precept Wine
Quinta do Crasto SA
Ramos Pinto
SOGEVINUS FINE WINES SA
Sogrape SGPS SA
Sula Vineyards
Symington Family Estates Vinhos S.A.
Taylors Port
THE FLADGATE PARTNERSHIP
The Great Wine Co.
Van Zellers and Co.
Vinbros and Co.
Vinimark Trading Pty Ltd
Vinoquel Vinhos Oscar Quevedo Lda
15. Methodology and Data Sources
15.1 Customization Offerings
15.2 Subscription Services
15.3 Related Reports
15.4 Publisher Expertise
LIST OF TABLES
Table 1 Market Segmentation Analysis
Table 2 Global Port Wine Market Share of Leading Companies, 2023
Table 3 Product Offerings of Leading Companies
Table 4 Low Growth Scenario Forecasts
Table 5 Reference Case Growth Scenario
Table 6 High Growth Case Scenario
Table 7 Global Port Wine Revenue (USD Million) And CAGR (%) By Type (2021-2032)
Table 8 Global Port Wine Revenue (USD Million) And CAGR (%) By Application (2021-2032)
Table 9 Global Port Wine Revenue (USD Million) And CAGR (%) By Product (2021-2032)
Table 10 Global Port Wine Market Revenue (USD Million) By Regions (2021-2032)
Table 11 Global Port Wine Market Share (%) By Regions (2021-2032)
Table 12 North America Port Wine Revenue (USD Million) By Country (2021-2032)
Table 13 Europe Port Wine Revenue (USD Million) By Country (2021-2032)
Table 14 Asia Pacific Port Wine Revenue (USD Million) By Country (2021-2032)
Table 15 South America Port Wine Revenue (USD Million) By Country (2021-2032)
Table 16 Middle East and Africa Port Wine Revenue (USD Million) By Region (2021-2032)
Table 17 North America Port Wine Revenue (USD Million) By Type (2021-2032)
Table 18 North America Port Wine Revenue (USD Million) By Application (2021-2032)
Table 19 North America Port Wine Revenue (USD Million) By Product (2021-2032)
Table 20 Europe Port Wine Revenue (USD Million) By Type (2021-2032)
Table 21 Europe Port Wine Revenue (USD Million) By Application (2021-2032)
Table 22 Europe Port Wine Revenue (USD Million) By Product (2021-2032)
Table 23 Asia Pacific Port Wine Revenue (USD Million) By Type (2021-2032)
Table 24 Asia Pacific Port Wine Revenue (USD Million) By Application (2021-2032)
Table 25 Asia Pacific Port Wine Revenue (USD Million) By Product (2021-2032)
Table 26 South America Port Wine Revenue (USD Million) By Type (2021-2032)
Table 27 South America Port Wine Revenue (USD Million) By Application (2021-2032)
Table 28 South America Port Wine Revenue (USD Million) By Product (2021-2032)
Table 29 Middle East and Africa Port Wine Revenue (USD Million) By Type (2021-2032)
Table 30 Middle East and Africa Port Wine Revenue (USD Million) By Application (2021-2032)
Table 31 Middle East and Africa Port Wine Revenue (USD Million) By Product (2021-2032)
LIST OF FIGURES
Figure 1. Market Scope
Figure 2. Pricing Forecasts Per Unit, 2023- 2032
Figure 3. Porter’s Five Forces
Figure 4. Global Port Wine Market Revenue (USD Million) By Regions (2021-2032)
Figure 5. Global Port Wine Market Share (%) By Regions (2023)
Figure 6. North America Port Wine Revenue (USD Million) By Country (2021-2032)
Figure 7. United States Port Wine Revenue (USD Million) By Country (2021-2032)
Figure 8. Canada Port Wine Revenue (USD Million) By Country (2021-2032)
Figure 9. Mexico Port Wine Revenue (USD Million) By Country (2021-2032)
Figure 10. Europe Port Wine Revenue (USD Million) By Country (2021-2032)
Figure 11. Germany Port Wine Revenue (USD Million) By Country (2021-2032)
Figure 12. France Port Wine Revenue (USD Million) By Country (2021-2032)
Figure 13. United Kingdom Port Wine Revenue (USD Million) By Country (2021-2032)
Figure 14. Spain Port Wine Revenue (USD Million) By Country (2021-2032)
Figure 15. Italy Port Wine Revenue (USD Million) By Country (2021-2032)
Figure 16. Russia Port Wine Revenue (USD Million) By Country (2021-2032)
Figure 17. Rest of Europe Port Wine Revenue (USD Million) By Country (2021-2032)
Figure 11. Asia Pacific Port Wine Revenue (USD Million) By Country (2021-2032)
Figure 12. China Port Wine Revenue (USD Million) By Country (2021-2032)
Figure 13. Japan Port Wine Revenue (USD Million) By Country (2021-2032)
Figure 14. India Port Wine Revenue (USD Million) By Country (2021-2032)
Figure 15. South Korea Port Wine Revenue (USD Million) By Country (2021-2032)
Figure 16. Australia Port Wine Revenue (USD Million) By Country (2021-2032)
Figure 17. South East Asia Port Wine Revenue (USD Million) By Country (2021-2032)
Figure 18. South America Port Wine Revenue (USD Million) By Country (2021-2032)
Figure 19. Brazil Port Wine Revenue (USD Million) By Country (2021-2032)
Figure 20. Argentina Port Wine Revenue (USD Million) By Country (2021-2032)
Figure 21. Rest of Asia Pacific Port Wine Revenue (USD Million) By Country (2021-2032)
Figure 22. Middle East and Africa Port Wine Revenue (USD Million) By Region (2021-2032)
Figure 23. Saudi Arabia Port Wine Revenue (USD Million) By Region (2021-2032)
Figure 24. The UAE Port Wine Revenue (USD Million) By Region (2021-2032)
Figure 25. Rest of Middle East Port Wine Revenue (USD Million) By Region (2021-2032)
Figure 26. South Africa Port Wine Revenue (USD Million) By Region (2021-2032)
Figure 27. Africa Port Wine Revenue (USD Million) By Region (2021-2032)
Figure 28. North America Port Wine Revenue (USD Million) By Type (2021-2032)
Figure 29. North America Port Wine Revenue (USD Million) By Application (2021-2032)
Figure 30. North America Port Wine Revenue (USD Million) By Product (2021-2032)
Figure 31. Europe Port Wine Revenue (USD Million) By Type (2021-2032)
Figure 32. Europe Port Wine Revenue (USD Million) By Application (2021-2032)
Figure 33. Europe Port Wine Revenue (USD Million) By Product (2021-2032)
Figure 34. Asia Pacific Port Wine Revenue (USD Million) By Type (2021-2032)
Figure 35. Asia Pacific Port Wine Revenue (USD Million) By Application (2021-2032)
Figure 36. Asia Pacific Port Wine Revenue (USD Million) By Product (2021-2032)
Figure 37. South America Port Wine Revenue (USD Million) By Type (2021-2032)
Figure 38. South America Port Wine Revenue (USD Million) By Application (2021-2032)
Figure 39. South America Port Wine Revenue (USD Million) By Product (2021-2032)
Figure 40. Middle East and Africa Port Wine Revenue (USD Million) By Type (2021-2032)
Figure 41. Middle East and Africa Port Wine Revenue (USD Million) By Application (2021-2032)
Figure 42. Middle East and Africa Port Wine Revenue (USD Million) By Product (2021-2032)
By Nature
Red
White
By Type
Ruby
Tawny
Vintage
By Distribution Channel
Online
Offline
Countries Analyzed
North America (US, Canada, Mexico)
Europe (Germany, UK, France, Spain, Italy, Russia, Rest of Europe)
Asia Pacific (China, India, Japan, South Korea, Australia, South East Asia, Rest of Asia)
South America (Brazil, Argentina, Rest of South America)
Middle East and Africa (Saudi Arabia, UAE, Rest of Middle East, South Africa, Egypt, Rest of Africa)
