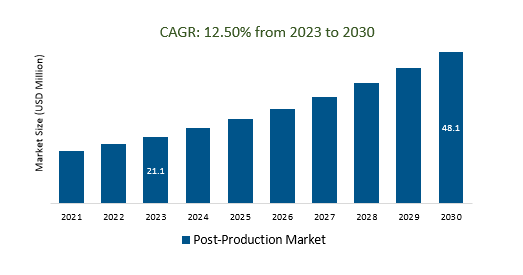
The Global Post-Production Market Size is estimated to be US 28.1 Billion in 2025 and is poised to register 12.5% growth over the forecast period from 2025 to 2034 to reach US $ 48.1 billion in 2034.
The market growth is driven by the increasing amount of digital content, there is a growing concern for data security and intellectual property protection. Post-production companies must invest in robust security measures. Leading companies that are focused on Immersive Technologies, 5G Connectivity, AI and Automation, Cloud-Based Workflow, Sustainability Initiatives, Remote Production and Post-Production, Cross-Platform Content, and others to boost market shares in the industry.
Market Overview
The post-production market is a dynamic segment of the media and entertainment industry, encompassing activities like video and audio editing, VFX, and sound design. It serves the growing demand for high-quality content driven by streaming services, globalization, and technological advancements. Key trends include remote workflows, sustainability, personalization, and the influence of emerging technologies like AR, VR, and AI. This competitive market requires professionals and studios to stay updated, adapt to evolving regulations, and invest in cutting-edge tools and skills to meet the diverse needs of content creators and audiences worldwide.
Market Dynamics
Market Trends - Content in high dynamic range (HDR) and 4K/8K resolution
The production and post-production markets have witnessed a significant demand for content in high dynamic range (HDR) and 4K/8K resolution formats. This trend reflects the growing appetite for immersive and visually stunning content among audiences. HDR technology enhances the contrast and color range, providing a more lifelike and vibrant viewing experience, while 4K and 8K resolutions offer exceptional clarity and detail. Post-production companies must invest in the necessary infrastructure, software, and expertise to handle these formats effectively, ensuring that content is not only visually appealing but also optimized for a range of distribution platforms, including traditional television, streaming services, and theatrical release.
Market Driver- HDR and 4K/8K Content Demand Post-Production Market
The post-production market is witnessing a growing demand for HDR (High Dynamic Range) and 4K/8K content due to the increasing preference for immersive and visually impressive viewing experiences. HDR technology enhances contrast and color range, while 4K and 8K resolutions offer exceptional clarity and detail. This demand is driven by the desire to create content that stands out and provides a superior visual experience for audiences, requiring post-production facilities to invest in the necessary technology and expertise to handle these formats effectively and meet the expectations of modern viewers.
Market Opportunity-Introduction of Monetization Models
Monetization models for the post-production market encompass a range of strategies, including service fees based on hourly rates or package deals, subscription services with tiered pricing, pay-per-use billing for content processing, royalties through revenue sharing or licensing, software sales and plugin licensing, content distribution via CDNs or hosting platforms, educational offerings like online courses and workshops, consulting services for workflow optimization and technical support, customization of post-production solutions, data analytics and insights, branding and marketing collaborations, and partnerships to tap into synergies with other industry players.
Market Share Analysis- VFX Post-Production Market will register the fastest growth
The Global Post-Production Market is analyzed across VFX, Audio processing, 2D-3D conversion, Editing, Others, and others. VFX is poised to register the fastest growth. In the VFX for the post-production market, monetization strategies revolve around providing a range of visual effects services, software, and assets to enhance digital content. Revenue generation methods include charging clients for VFX services through hourly rates or project-based fees, offering subscription-based access to VFX software, licensing VFX assets and earning royalties, collaborating on VFX-heavy projects with revenue-sharing arrangements, selling stock VFX elements, conducting training and workshops, developing proprietary VFX software, promoting services through advertising, exploring international partnerships, and providing data-driven insights.
Market Share Analysis- Commercials held a significant market share in 2025
The Global Post-Production Market is analyzed across various applications including Movies, Television, Commercials, Online videos, and others. Of these, Commercials held a significant market share in 2025. In the commercials post-production market, monetization strategies encompass a range of services and approaches tailored to advertising content. Revenue is generated through service fees based on hourly rates or package deals, subscriptions offering ongoing access to post-production tools, licensing and royalties for music and visual elements, collaborative projects with advertising agencies, operating full-service production studios, specialized offerings like VFX and animation services, customization for different markets, data-driven insights, distribution partnerships, branding and marketing services, and the development of advertising technology tools.
Post-Production Market Segmentation
By Technique
- VFX
- Audio processing
- 2D-3D conversion
- Editing
- Others
By Application
- Movies
- Television
- Commercials
- Online videos
By Region
- North America (United States, Canada, Mexico)
- Europe (Germany, France, United Kingdom, Spain, Italy, Others)
- Asia Pacific (China, India, Japan, South Korea, Australia, Others)
- Latin America (Brazil, Argentina, Others)
- Middle East and Africa (Saudi Arabia, UAE, Kuwait, Other Middle East, South Africa, Nigeria, Other Africa)
Post-Production Market companies
- Eros Media World plc
- Comcast Corp
- Amazon.com Inc
- AT and T Inc
- Framestore Ltd
- Deluxe Media Inc
- Lantern Entertainment
- Storyteller Distribution Co LLC
- Netflix Inc
- Paramount Global
- Prime Focus Ltd
- Red Chillies Entertainments Pvt. Ltd
- Sony Group Corp
- STUDIO GHIBLI Inc
- Streamland Media Inc
- The Walt Disney Co
- Weta Digital Ltd
- Pixel Digital Studios
- Lions Gate Entertainment Corp
*List not exhaustive
Post Production Market Outlook 2025
1 Market Overview
1.1 Introduction to the Post Production Market
1.2 Scope of the Study
1.3 Research Objective
1.3.1 Key Market Scope and Segments
1.3.2 Players Covered
1.3.3 Years Considered
2 Executive Summary
2.1 2023 Post Production Industry- Market Statistics
3 Market Dynamics
3.1 Market Drivers
3.2 Market Challenges
3.3 Market Opportunities
3.4 Market Trends
4 Market Factor Analysis
4.1 Porter’s Five Forces
4.2 Market Entropy
4.2.1 Global Post Production Market Companies with Area Served
4.2.2 Products Offerings Global Post Production Market
5 COVID-19 Impact Analysis and Outlook Scenarios
5.1.1 Covid-19 Impact Analysis
5.1.2 Post-COVID-19 Scenario- Low Growth Case
5.1.3 Post-COVID-19 Scenario- Reference Growth Case
5.1.4 Post-COVID-19 Scenario- Low Growth Case
6 Global Post Production Market Trends
6.1 Global Post Production Revenue (USD Million) and CAGR (%) by Type (2019-2032)
6.2 Global Post Production Revenue (USD Million) and CAGR (%) by Applications (2019-2032)
6.3 Global Post Production Revenue (USD Million) and CAGR (%) by Regions (2019-2032)
7 Global Post Production Market Revenue (USD Million) by Type, and Applications (2019-2024)
7.1 Global Post Production Revenue (USD Million) by Type (2019-2024)
7.1.1 Global Post Production Revenue (USD Million), Market Share (%) by Type (2019-2024)
7.2 Global Post Production Revenue (USD Million) by Applications (2019-2024)
7.2.1 Global Post Production Revenue (USD Million), Market Share (%) by Applications (2019-2024)
8 Global Post Production Development Regional Status and Outlook
8.1 Global Post Production Revenue (USD Million) By Regions (2019-2024)
8.2 North America Post Production Revenue (USD Million) by Type, and Application (2019-2024)
8.2.1 North America Post Production Revenue (USD Million) by Country (2019-2024)
8.2.2 North America Post Production Revenue (USD Million) by Type (2019-2024)
8.2.3 North America Post Production Revenue (USD Million) by Applications (2019-2024)
8.3 Europe Post Production Revenue (USD Million), by Type, and Applications (USD Million) (2019-2024)
8.3.1 Europe Post Production Revenue (USD Million), by Country (2019-2024)
8.3.2 Europe Post Production Revenue (USD Million) by Type (2019-2024)
8.3.3 Europe Post Production Revenue (USD Million) by Applications (2019-2024)
8.4 Asia Pacific Post Production Revenue (USD Million), and Revenue (USD Million) by Type, and Applications (2019-2024)
8.4.1 Asia Pacific Post Production Revenue (USD Million) by Country (2019-2024)
8.4.2 Asia Pacific Post Production Revenue (USD Million) by Type (2019-2024)
8.4.3 Asia Pacific Post Production Revenue (USD Million) by Applications (2019-2024)
8.5 South America Post Production Revenue (USD Million), by Type, and Applications (2019-2024)
8.5.1 South America Post Production Revenue (USD Million), by Country (2019-2024)
8.5.2 South America Post Production Revenue (USD Million) by Type (2019-2024)
8.5.3 South America Post Production Revenue (USD Million) by Applications (2019-2024)
8.6 Middle East and Africa Post Production Revenue (USD Million), by Type, Technology, Application, Thickness (2019-2024)
8.6.1 Middle East and Africa Post Production Revenue (USD Million) by Country (2019-2024)
8.6.2 Middle East and Africa Post Production Revenue (USD Million) by Type (2019-2024)
8.6.3 Middle East and Africa Post Production Revenue (USD Million) by Applications (2019-2024)
9 Company Profiles
10 Global Post Production Market Revenue (USD Million), by Type, and Applications (2025-2034)
10.1 Global Post Production Revenue (USD Million) and Market Share (%) by Type (2025-2034)
10.1.1 Global Post Production Revenue (USD Million), and Market Share (%) by Type (2025-2034)
10.2 Global Post Production Revenue (USD Million) and Market Share (%) by Applications (2025-2034)
10.2.1 Global Post Production Revenue (USD Million), and Market Share (%) by Applications (2025-2034)
11 Global Post Production Development Regional Status and Outlook Forecast
11.1 Global Post Production Revenue (USD Million) By Regions (2025-2034)
11.2 North America Post Production Revenue (USD Million) by Type, and Applications (2025-2034)
11.2.1 North America Post Production Revenue (USD) Million by Country (2025-2034)
11.2.2 North America Post Production Revenue (USD Million), by Type (2025-2034)
11.2.3 North America Post Production Revenue (USD Million), Market Share (%) by Applications (2025-2034)
11.3 Europe Post Production Revenue (USD Million), by Type, and Applications (2025-2034)
11.3.1 Europe Post Production Revenue (USD Million), by Country (2025-2034)
11.3.2 Europe Post Production Revenue (USD Million), by Type (2025-2034)
11.3.3 Europe Post Production Revenue (USD Million), by Applications (2025-2034)
11.4 Asia Pacific Post Production Revenue (USD Million) by Type, and Applications (2025-2034)
11.4.1 Asia Pacific Post Production Revenue (USD Million), by Country (2025-2034)
11.4.2 Asia Pacific Post Production Revenue (USD Million), by Type (2025-2034)
11.4.3 Asia Pacific Post Production Revenue (USD Million), by Applications (2025-2034)
11.5 South America Post Production Revenue (USD Million), by Type, and Applications (2025-2034)
11.5.1 South America Post Production Revenue (USD Million), by Country (2025-2034)
11.5.2 South America Post Production Revenue (USD Million), by Type (2025-2034)
11.5.3 South America Post Production Revenue (USD Million), by Applications (2025-2034)
11.6 Middle East and Africa Post Production Revenue (USD Million), by Type, and Applications (2025-2034)
11.6.1 Middle East and Africa Post Production Revenue (USD Million), by Region (2025-2034)
11.6.2 Middle East and Africa Post Production Revenue (USD Million), by Type (2025-2034)
11.6.3 Middle East and Africa Post Production Revenue (USD Million), by Applications (2025-2034)
12 Methodology and Data Sources
12.1 Methodology/Research Approach
12.1.1 Research Programs/Design
12.1.2 Market Size Estimation
12.1.3 Market Breakdown and Data Triangulation
12.2 Data Sources
12.2.1 Secondary Sources
12.2.2 Primary Sources
12.3 Disclaimer
List of Tables
Table 1 Market Segmentation Analysis
Table 2 Global Post Production Market Companies with Areas Served
Table 3 Products Offerings Global Post Production Market
Table 4 Low Growth Scenario Forecasts
Table 5 Reference Case Growth Scenario
Table 6 High Growth Case Scenario
Table 7 Global Post Production Revenue (USD Million) And CAGR (%) By Type (2019-2032)
Table 8 Global Post Production Revenue (USD Million) And CAGR (%) By Applications (2019-2032)
Table 9 Global Post Production Revenue (USD Million) And CAGR (%) By Regions (2019-2032)
Table 10 Global Post Production Revenue (USD Million) By Type (2019-2024)
Table 11 Global Post Production Revenue Market Share (%) By Type (2019-2024)
Table 12 Global Post Production Revenue (USD Million) By Applications (2019-2024)
Table 13 Global Post Production Revenue Market Share (%) By Applications (2019-2024)
Table 14 Global Post Production Market Revenue (USD Million) By Regions (2019-2024)
Table 15 Global Post Production Market Share (%) By Regions (2019-2024)
Table 16 North America Post Production Revenue (USD Million) By Country (2019-2024)
Table 17 North America Post Production Revenue (USD Million) By Type (2019-2024)
Table 18 North America Post Production Revenue (USD Million) By Applications (2019-2024)
Table 19 Europe Post Production Revenue (USD Million) By Country (2019-2024)
Table 20 Europe Post Production Revenue (USD Million) By Type (2019-2024)
Table 21 Europe Post Production Revenue (USD Million) By Applications (2019-2024)
Table 22 Asia Pacific Post Production Revenue (USD Million) By Country (2019-2024)
Table 23 Asia Pacific Post Production Revenue (USD Million) By Type (2019-2024)
Table 24 Asia Pacific Post Production Revenue (USD Million) By Applications (2019-2024)
Table 25 South America Post Production Revenue (USD Million) By Country (2019-2024)
Table 26 South America Post Production Revenue (USD Million) By Type (2019-2024)
Table 27 South America Post Production Revenue (USD Million) By Applications (2019-2024)
Table 28 Middle East and Africa Post Production Revenue (USD Million) By Region (2019-2024)
Table 29 Middle East and Africa Post Production Revenue (USD Million) By Type (2019-2024)
Table 30 Middle East and Africa Post Production Revenue (USD Million) By Applications (2019-2024)
Table 31 Financial Analysis
Table 32 Global Post Production Revenue (USD Million) By Type (2025-2034)
Table 33 Global Post Production Revenue Market Share (%) By Type (2025-2034)
Table 34 Global Post Production Revenue (USD Million) By Applications (2025-2034)
Table 35 Global Post Production Revenue Market Share (%) By Applications (2025-2034)
Table 36 Global Post Production Market Revenue (USD Million), And Revenue (USD Million) By Regions (2025-2034)
Table 37 North America Post Production Revenue (USD)By Country (2025-2034)
Table 38 North America Post Production Revenue (USD Million) By Type (2025-2034)
Table 39 North America Post Production Revenue (USD Million) By Applications (2025-2034)
Table 40 Europe Post Production Revenue (USD Million) By Country (2025-2034)
Table 41 Europe Post Production Revenue (USD Million) By Type (2025-2034)
Table 42 Europe Post Production Revenue (USD Million) By Applications (2025-2034)
Table 43 Asia Pacific Post Production Revenue (USD Million) By Country (2025-2034)
Table 44 Asia Pacific Post Production Revenue (USD Million) By Type (2025-2034)
Table 45 Asia Pacific Post Production Revenue (USD Million) By Applications (2025-2034)
Table 46 South America Post Production Revenue (USD Million) By Country (2025-2034)
Table 47 South America Post Production Revenue (USD Million) By Type (2025-2034)
Table 48 South America Post Production Revenue (USD Million) By Applications (2025-2034)
Table 49 Middle East and Africa Post Production Revenue (USD Million) By Region (2025-2034)
Table 50 Middle East and Africa Post Production Revenue (USD Million) By Region (2025-2034)
Table 51 Middle East and Africa Post Production Revenue (USD Million) By Type (2025-2034)
Table 52 Middle East and Africa Post Production Revenue (USD Million) By Applications (2025-2034)
Table 53 Research Programs/Design for This Report
Table 54 Key Data Information from Secondary Sources
Table 55 Key Data Information from Primary Sources
List of Figures
Figure 1 Market Scope
Figure 2 Porter’s Five Forces
Figure 3 Global Post Production Revenue (USD Million) By Type (2019-2024)
Figure 4 Global Post Production Revenue Market Share (%) By Type (2022)
Figure 5 Global Post Production Revenue (USD Million) By Applications (2019-2024)
Figure 6 Global Post Production Revenue Market Share (%) By Applications (2022)
Figure 7 Global Post Production Market Revenue (USD Million) By Regions (2019-2024)
Figure 8 Global Post Production Market Share (%) By Regions (2022)
Figure 9 North America Post Production Revenue (USD Million) By Country (2019-2024)
Figure 10 North America Post Production Revenue (USD Million) By Type (2019-2024)
Figure 11 North America Post Production Revenue (USD Million) By Applications (2019-2024)
Figure 12 Europe Post Production Revenue (USD Million) By Country (2019-2024)
Figure 13 Europe Post Production Revenue (USD Million) By Type (2019-2024)
Figure 14 Europe Post Production Revenue (USD Million) By Applications (2019-2024)
Figure 15 Asia Pacific Post Production Revenue (USD Million) By Country (2019-2024)
Figure 16 Asia Pacific Post Production Revenue (USD Million) By Type (2019-2024)
Figure 17 Asia Pacific Post Production Revenue (USD Million) By Applications (2019-2024)
Figure 18 South America Post Production Revenue (USD Million) By Country (2019-2024)
Figure 19 South America Post Production Revenue (USD Million) By Type (2019-2024)
Figure 20 South America Post Production Revenue (USD Million) By Applications (2019-2024)
Figure 21 Middle East and Africa Post Production Revenue (USD Million) By Region (2019-2024)
Figure 22 Middle East and Africa Post Production Revenue (USD Million) By Type (2019-2024)
Figure 23 Middle East and Africa Post Production Revenue (USD Million) By Applications (2019-2024)
Figure 24 Global Post Production Revenue (USD Million) By Type (2025-2034)
Figure 25 Global Post Production Revenue Market Share (%) By Type (2030)
Figure 26 Global Post Production Revenue (USD Million) By Applications (2025-2034)
Figure 27 Global Post Production Revenue Market Share (%) By Applications (2030)
Figure 28 Global Post Production Market Revenue (USD Million) By Regions (2025-2034)
Figure 29 North America Post Production Revenue (USD Million) By Country (2025-2034)
Figure 30 North America Post Production Revenue (USD Million) By Type (2025-2034)
Figure 31 North America Post Production Revenue (USD Million) By Applications (2025-2034)
Figure 32 Europe Post Production Revenue (USD Million) By Country (2025-2034)
Figure 33 Europe Post Production Revenue (USD Million) By Type (2025-2034)
Figure 34 Europe Post Production Revenue (USD Million) By Applications (2025-2034)
Figure 35 Asia Pacific Post Production Revenue (USD Million) By Country (2025-2034)
Figure 36 Asia Pacific Post Production Revenue (USD Million) By Type (2025-2034)
Figure 37 Asia Pacific Post Production Revenue (USD Million) By Applications (2025-2034)
Figure 38 South America Post Production Revenue (USD Million) By Country (2025-2034)
Figure 39 South America Post Production Revenue (USD Million) By Type (2025-2034)
Figure 40 South America Post Production Revenue (USD Million) By Applications (2025-2034)
Figure 41 Middle East and Africa Post Production Revenue (USD Million) By Region (2025-2034)
Figure 42 Middle East and Africa Post Production Revenue (USD Million) By Region (2025-2034)
Figure 43 Middle East and Africa Post Production Revenue (USD Million) By Type (2025-2034)
Figure 44 Middle East and Africa Post Production Revenue (USD Million) By Applications (2025-2034)
Figure 45 Bottom-Up and Top-Down Approaches For This Report
Figure 46 Data Triangulation
