The Global Potash Fertilizer Market is estimated to be US$ 28.2 Billion in 2023. It is poised to register 4.5% growth over the forecast period from 2023 to 2030 to reach US $ 38.4 billion 2030.
The market growth is driven by the Increasing Innovations in potash production, such as improved mining and processing techniques, which are helping to reduce costs and increase supply. Leading companies are focusing on Balanced Fertilization Practices, Organic and Specialty Crop Farming, Climate Change Mitigation, Alternative Sources, and others to boost market shares in the industry.
Market Overview
The Potash Fertilizer Market is a vital segment of the global fertilizer industry, driven by the need to enhance agricultural productivity to meet the demands of a growing population. It offers various types of potash fertilizers, including potassium chloride (MOP) and potassium sulfate (SOP), used in diverse applications across field crops, horticulture, and landscaping. Major players like Nutrien, Mosaic, and Uralkali dominate the market. Key trends include a shift towards balanced fertilization, sustainability concerns, and technological advancements. Challenges encompass price volatility and environmental issues.
Market Dynamics
Market Trends- Companies are launching Global Population Growth to attract a consumer base
Global population growth is a key driver of the Potash Fertilizer Market. The increasing world population necessitates higher food production, and potash fertilizers, rich in essential potassium, are vital for enhancing crop yields and agricultural productivity. This demand is expected to persist as more arable land is needed to support the growing population, making potash fertilizers crucial for global food security and sustainable agriculture.
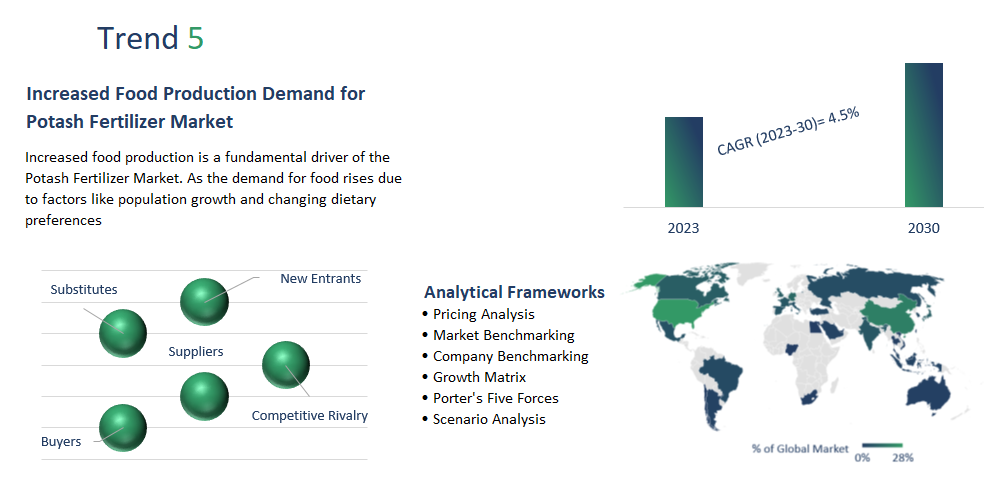
Market Driver- Increased Food Production Demand for Potash Fertilizer Market
Increased food production is a fundamental driver of the Potash Fertilizer Market. As the demand for food rises due to factors like population growth and changing dietary preferences, there is a greater need to boost agricultural yields and crop quality. Potash fertilizers, containing essential potassium, play a pivotal role in achieving these objectives by enhancing plant growth, root development, and disease resistance. Consequently, the Potash Fertilizer Market is closely tied to efforts to meet the global food demand, ensuring higher agricultural productivity and food security.
Market Opportunity-Introduction of Technological Advancements
Technological advancements are pivotal in the Potash Fertilizer Market, driving efficiency, cost reduction, and sustainability. Innovations in mining, processing, and precision agriculture optimize resource utilization, reduce environmental impact, and ensure precise nutrient application for crop growth, enhancing yields and minimizing waste. These ongoing advancements are key to the industry's future competitiveness and sustainability.
Market Share Analysis- The cereals and grains Potash Fertilizer Market will register the fastest growth
The Global Potash Fertilizer Market is analyzed across Cereals, Oil seeds and Pulses, grains, Fruits and Vegetables, and others. Of these, Cereals and grains will register the fastest growth. Cereals and grains are key components of the Potash Fertilizer Market, as potash fertilizers rich in potassium are essential for enhancing the yield, quality, and disease resistance of staple crops like wheat, rice, corn, and barley.
Market Share Analysis- Fertigation held a significant market share in 2023
The Global Potash Fertilizer Market is analyzed across various applications including Fertigation, Foliar, Broadcasting, and others. Of these, Fertigation held a significant market share in 2023. Fertigation, the precise application of potash fertilizers through irrigation systems, is a significant practice in the Potash Fertilizer Market. It enhances crop yields, optimizes nutrient delivery, and conserves water resources, making it increasingly popular in modern agriculture.
Potash Fertilizer Market Segmentation
By Type
- Cereals and grains
- Oil seeds and Pulses
- Fruits and Vegetables
- Others
By Application
- Broadcasting
- Foliar
- Fertigation
By Type
- Potassium Chloride
- Potassium Nitrate
- Sulfate of Potash
- Others
By Form
By Region
- North America (United States, Canada, Mexico)
- Europe (Germany, France, United Kingdom, Spain, Italy, Others)
- Asia Pacific (China, India, Japan, South Korea, Australia, Others)
- Latin America (Brazil, Argentina, Others)
- Middle East and Africa (Saudi Arabia, UAE, Kuwait, Other Middle East, South Africa, Nigeria, Other Africa)
Potash Fertilizer Market Companies
- Yara International ASA
- Agrium Inc
- The Mosaic Company
- Potash Corporation of Saskatchewan Inc
- Eurochem Group AG
- Sociedad Química Y Minera De Chile S.A.
- JSC Belaruskali
- HELM AG
- Israel Chemicals Ltd
- Uralkali, ICL Ltd
- Sinofert Holdings Ltd
- Borealis AG
- K+S Aktiengesellschaft
- CF Industries
* List not exhaustive
Potash Fertilizer Market Outlook 2023
1 Market Overview
1.1 Introduction to the Potash Fertilizer Market
1.2 Scope of the Study
1.3 Research Objective
1.3.1 Key Market Scope and Segments
1.3.2 Players Covered
1.3.3 Years Considered
2 Executive Summary
2.1 2023 Potash Fertilizer Industry- Market Statistics
3 Market Dynamics
3.1 Market Drivers
3.2 Market Challenges
3.3 Market Opportunities
3.4 Market Trends
4 Market Factor Analysis
4.1 Porter’s Five Forces
4.2 Market Entropy
4.2.1 Global Potash Fertilizer Market Companies with Area Served
4.2.2 Products Offerings Global Potash Fertilizer Market
5 COVID-19 Impact Analysis and Outlook Scenarios
5.1.1 Covid-19 Impact Analysis
5.1.2 Post-COVID-19 Scenario- Low Growth Case
5.1.3 Post-COVID-19 Scenario- Reference Growth Case
5.1.4 Post-COVID-19 Scenario- Low Growth Case
6 Global Potash Fertilizer Market Trends
6.1 Global Potash Fertilizer Revenue (USD Million) and CAGR (%) by Type (2018-2030)
6.2 Global Potash Fertilizer Revenue (USD Million) and CAGR (%) by Applications (2018-2030)
6.3 Global Potash Fertilizer Revenue (USD Million) and CAGR (%) by Regions (2018-2030)
7 Global Potash Fertilizer Market Revenue (USD Million) by Type, and Applications (2018-2022)
7.1 Global Potash Fertilizer Revenue (USD Million) by Type (2018-2022)
7.1.1 Global Potash Fertilizer Revenue (USD Million), Market Share (%) by Type (2018-2022)
7.2 Global Potash Fertilizer Revenue (USD Million) by Applications (2018-2022)
7.2.1 Global Potash Fertilizer Revenue (USD Million), Market Share (%) by Applications (2018-2022)
8 Global Potash Fertilizer Development Regional Status and Outlook
8.1 Global Potash Fertilizer Revenue (USD Million) By Regions (2018-2022)
8.2 North America Potash Fertilizer Revenue (USD Million) by Type, and Application (2018-2022)
8.2.1 North America Potash Fertilizer Revenue (USD Million) by Country (2018-2022)
8.2.2 North America Potash Fertilizer Revenue (USD Million) by Type (2018-2022)
8.2.3 North America Potash Fertilizer Revenue (USD Million) by Applications (2018-2022)
8.3 Europe Potash Fertilizer Revenue (USD Million), by Type, and Applications (USD Million) (2018-2022)
8.3.1 Europe Potash Fertilizer Revenue (USD Million), by Country (2018-2022)
8.3.2 Europe Potash Fertilizer Revenue (USD Million) by Type (2018-2022)
8.3.3 Europe Potash Fertilizer Revenue (USD Million) by Applications (2018-2022)
8.4 Asia Pacific Potash Fertilizer Revenue (USD Million), and Revenue (USD Million) by Type, and Applications (2018-2022)
8.4.1 Asia Pacific Potash Fertilizer Revenue (USD Million) by Country (2018-2022)
8.4.2 Asia Pacific Potash Fertilizer Revenue (USD Million) by Type (2018-2022)
8.4.3 Asia Pacific Potash Fertilizer Revenue (USD Million) by Applications (2018-2022)
8.5 South America Potash Fertilizer Revenue (USD Million), by Type, and Applications (2018-2022)
8.5.1 South America Potash Fertilizer Revenue (USD Million), by Country (2018-2022)
8.5.2 South America Potash Fertilizer Revenue (USD Million) by Type (2018-2022)
8.5.3 South America Potash Fertilizer Revenue (USD Million) by Applications (2018-2022)
8.6 Middle East and Africa Potash Fertilizer Revenue (USD Million), by Type, Technology, Application, Thickness (2018-2022)
8.6.1 Middle East and Africa Potash Fertilizer Revenue (USD Million) by Country (2018-2022)
8.6.2 Middle East and Africa Potash Fertilizer Revenue (USD Million) by Type (2018-2022)
8.6.3 Middle East and Africa Potash Fertilizer Revenue (USD Million) by Applications (2018-2022)
9 Company Profiles
10 Global Potash Fertilizer Market Revenue (USD Million), by Type, and Applications (2023-2030)
10.1 Global Potash Fertilizer Revenue (USD Million) and Market Share (%) by Type (2023-2030)
10.1.1 Global Potash Fertilizer Revenue (USD Million), and Market Share (%) by Type (2023-2030)
10.2 Global Potash Fertilizer Revenue (USD Million) and Market Share (%) by Applications (2023-2030)
10.2.1 Global Potash Fertilizer Revenue (USD Million), and Market Share (%) by Applications (2023-2030)
11 Global Potash Fertilizer Development Regional Status and Outlook Forecast
11.1 Global Potash Fertilizer Revenue (USD Million) By Regions (2023-2030)
11.2 North America Potash Fertilizer Revenue (USD Million) by Type, and Applications (2023-2030)
11.2.1 North America Potash Fertilizer Revenue (USD) Million by Country (2023-2030)
11.2.2 North America Potash Fertilizer Revenue (USD Million), by Type (2023-2030)
11.2.3 North America Potash Fertilizer Revenue (USD Million), Market Share (%) by Applications (2023-2030)
11.3 Europe Potash Fertilizer Revenue (USD Million), by Type, and Applications (2023-2030)
11.3.1 Europe Potash Fertilizer Revenue (USD Million), by Country (2023-2030)
11.3.2 Europe Potash Fertilizer Revenue (USD Million), by Type (2023-2030)
11.3.3 Europe Potash Fertilizer Revenue (USD Million), by Applications (2023-2030)
11.4 Asia Pacific Potash Fertilizer Revenue (USD Million) by Type, and Applications (2023-2030)
11.4.1 Asia Pacific Potash Fertilizer Revenue (USD Million), by Country (2023-2030)
11.4.2 Asia Pacific Potash Fertilizer Revenue (USD Million), by Type (2023-2030)
11.4.3 Asia Pacific Potash Fertilizer Revenue (USD Million), by Applications (2023-2030)
11.5 South America Potash Fertilizer Revenue (USD Million), by Type, and Applications (2023-2030)
11.5.1 South America Potash Fertilizer Revenue (USD Million), by Country (2023-2030)
11.5.2 South America Potash Fertilizer Revenue (USD Million), by Type (2023-2030)
11.5.3 South America Potash Fertilizer Revenue (USD Million), by Applications (2023-2030)
11.6 Middle East and Africa Potash Fertilizer Revenue (USD Million), by Type, and Applications (2023-2030)
11.6.1 Middle East and Africa Potash Fertilizer Revenue (USD Million), by Region (2023-2030)
11.6.2 Middle East and Africa Potash Fertilizer Revenue (USD Million), by Type (2023-2030)
11.6.3 Middle East and Africa Potash Fertilizer Revenue (USD Million), by Applications (2023-2030)
12 Methodology and Data Sources
12.1 Methodology/Research Approach
12.1.1 Research Programs/Design
12.1.2 Market Size Estimation
12.1.3 Market Breakdown and Data Triangulation
12.2 Data Sources
12.2.1 Secondary Sources
12.2.2 Primary Sources
12.3 Disclaimer
List of Tables
Table 1 Market Segmentation Analysis
Table 2 Global Potash Fertilizer Market Companies with Areas Served
Table 3 Products Offerings Global Potash Fertilizer Market
Table 4 Low Growth Scenario Forecasts
Table 5 Reference Case Growth Scenario
Table 6 High Growth Case Scenario
Table 7 Global Potash Fertilizer Revenue (USD Million) And CAGR (%) By Type (2018-2030)
Table 8 Global Potash Fertilizer Revenue (USD Million) And CAGR (%) By Applications (2018-2030)
Table 9 Global Potash Fertilizer Revenue (USD Million) And CAGR (%) By Regions (2018-2030)
Table 10 Global Potash Fertilizer Revenue (USD Million) By Type (2018-2022)
Table 11 Global Potash Fertilizer Revenue Market Share (%) By Type (2018-2022)
Table 12 Global Potash Fertilizer Revenue (USD Million) By Applications (2018-2022)
Table 13 Global Potash Fertilizer Revenue Market Share (%) By Applications (2018-2022)
Table 14 Global Potash Fertilizer Market Revenue (USD Million) By Regions (2018-2022)
Table 15 Global Potash Fertilizer Market Share (%) By Regions (2018-2022)
Table 16 North America Potash Fertilizer Revenue (USD Million) By Country (2018-2022)
Table 17 North America Potash Fertilizer Revenue (USD Million) By Type (2018-2022)
Table 18 North America Potash Fertilizer Revenue (USD Million) By Applications (2018-2022)
Table 19 Europe Potash Fertilizer Revenue (USD Million) By Country (2018-2022)
Table 20 Europe Potash Fertilizer Revenue (USD Million) By Type (2018-2022)
Table 21 Europe Potash Fertilizer Revenue (USD Million) By Applications (2018-2022)
Table 22 Asia Pacific Potash Fertilizer Revenue (USD Million) By Country (2018-2022)
Table 23 Asia Pacific Potash Fertilizer Revenue (USD Million) By Type (2018-2022)
Table 24 Asia Pacific Potash Fertilizer Revenue (USD Million) By Applications (2018-2022)
Table 25 South America Potash Fertilizer Revenue (USD Million) By Country (2018-2022)
Table 26 South America Potash Fertilizer Revenue (USD Million) By Type (2018-2022)
Table 27 South America Potash Fertilizer Revenue (USD Million) By Applications (2018-2022)
Table 28 Middle East and Africa Potash Fertilizer Revenue (USD Million) By Region (2018-2022)
Table 29 Middle East and Africa Potash Fertilizer Revenue (USD Million) By Type (2018-2022)
Table 30 Middle East and Africa Potash Fertilizer Revenue (USD Million) By Applications (2018-2022)
Table 31 Financial Analysis
Table 32 Global Potash Fertilizer Revenue (USD Million) By Type (2023-2030)
Table 33 Global Potash Fertilizer Revenue Market Share (%) By Type (2023-2030)
Table 34 Global Potash Fertilizer Revenue (USD Million) By Applications (2023-2030)
Table 35 Global Potash Fertilizer Revenue Market Share (%) By Applications (2023-2030)
Table 36 Global Potash Fertilizer Market Revenue (USD Million), And Revenue (USD Million) By Regions (2023-2030)
Table 37 North America Potash Fertilizer Revenue (USD)By Country (2023-2030)
Table 38 North America Potash Fertilizer Revenue (USD Million) By Type (2023-2030)
Table 39 North America Potash Fertilizer Revenue (USD Million) By Applications (2023-2030)
Table 40 Europe Potash Fertilizer Revenue (USD Million) By Country (2023-2030)
Table 41 Europe Potash Fertilizer Revenue (USD Million) By Type (2023-2030)
Table 42 Europe Potash Fertilizer Revenue (USD Million) By Applications (2023-2030)
Table 43 Asia Pacific Potash Fertilizer Revenue (USD Million) By Country (2023-2030)
Table 44 Asia Pacific Potash Fertilizer Revenue (USD Million) By Type (2023-2030)
Table 45 Asia Pacific Potash Fertilizer Revenue (USD Million) By Applications (2023-2030)
Table 46 South America Potash Fertilizer Revenue (USD Million) By Country (2023-2030)
Table 47 South America Potash Fertilizer Revenue (USD Million) By Type (2023-2030)
Table 48 South America Potash Fertilizer Revenue (USD Million) By Applications (2023-2030)
Table 49 Middle East and Africa Potash Fertilizer Revenue (USD Million) By Region (2023-2030)
Table 50 Middle East and Africa Potash Fertilizer Revenue (USD Million) By Region (2023-2030)
Table 51 Middle East and Africa Potash Fertilizer Revenue (USD Million) By Type (2023-2030)
Table 52 Middle East and Africa Potash Fertilizer Revenue (USD Million) By Applications (2023-2030)
Table 53 Research Programs/Design for This Report
Table 54 Key Data Information from Secondary Sources
Table 55 Key Data Information from Primary Sources
List of Figures
Figure 1 Market Scope
Figure 2 Porter’s Five Forces
Figure 3 Global Potash Fertilizer Revenue (USD Million) By Type (2018-2022)
Figure 4 Global Potash Fertilizer Revenue Market Share (%) By Type (2022)
Figure 5 Global Potash Fertilizer Revenue (USD Million) By Applications (2018-2022)
Figure 6 Global Potash Fertilizer Revenue Market Share (%) By Applications (2022)
Figure 7 Global Potash Fertilizer Market Revenue (USD Million) By Regions (2018-2022)
Figure 8 Global Potash Fertilizer Market Share (%) By Regions (2022)
Figure 9 North America Potash Fertilizer Revenue (USD Million) By Country (2018-2022)
Figure 10 North America Potash Fertilizer Revenue (USD Million) By Type (2018-2022)
Figure 11 North America Potash Fertilizer Revenue (USD Million) By Applications (2018-2022)
Figure 12 Europe Potash Fertilizer Revenue (USD Million) By Country (2018-2022)
Figure 13 Europe Potash Fertilizer Revenue (USD Million) By Type (2018-2022)
Figure 14 Europe Potash Fertilizer Revenue (USD Million) By Applications (2018-2022)
Figure 15 Asia Pacific Potash Fertilizer Revenue (USD Million) By Country (2018-2022)
Figure 16 Asia Pacific Potash Fertilizer Revenue (USD Million) By Type (2018-2022)
Figure 17 Asia Pacific Potash Fertilizer Revenue (USD Million) By Applications (2018-2022)
Figure 18 South America Potash Fertilizer Revenue (USD Million) By Country (2018-2022)
Figure 19 South America Potash Fertilizer Revenue (USD Million) By Type (2018-2022)
Figure 20 South America Potash Fertilizer Revenue (USD Million) By Applications (2018-2022)
Figure 21 Middle East and Africa Potash Fertilizer Revenue (USD Million) By Region (2018-2022)
Figure 22 Middle East and Africa Potash Fertilizer Revenue (USD Million) By Type (2018-2022)
Figure 23 Middle East and Africa Potash Fertilizer Revenue (USD Million) By Applications (2018-2022)
Figure 24 Global Potash Fertilizer Revenue (USD Million) By Type (2023-2030)
Figure 25 Global Potash Fertilizer Revenue Market Share (%) By Type (2030)
Figure 26 Global Potash Fertilizer Revenue (USD Million) By Applications (2023-2030)
Figure 27 Global Potash Fertilizer Revenue Market Share (%) By Applications (2030)
Figure 28 Global Potash Fertilizer Market Revenue (USD Million) By Regions (2023-2030)
Figure 29 North America Potash Fertilizer Revenue (USD Million) By Country (2023-2030)
Figure 30 North America Potash Fertilizer Revenue (USD Million) By Type (2023-2030)
Figure 31 North America Potash Fertilizer Revenue (USD Million) By Applications (2023-2030)
Figure 32 Europe Potash Fertilizer Revenue (USD Million) By Country (2023-2030)
Figure 33 Europe Potash Fertilizer Revenue (USD Million) By Type (2023-2030)
Figure 34 Europe Potash Fertilizer Revenue (USD Million) By Applications (2023-2030)
Figure 35 Asia Pacific Potash Fertilizer Revenue (USD Million) By Country (2023-2030)
Figure 36 Asia Pacific Potash Fertilizer Revenue (USD Million) By Type (2023-2030)
Figure 37 Asia Pacific Potash Fertilizer Revenue (USD Million) By Applications (2023-2030)
Figure 38 South America Potash Fertilizer Revenue (USD Million) By Country (2023-2030)
Figure 39 South America Potash Fertilizer Revenue (USD Million) By Type (2023-2030)
Figure 40 South America Potash Fertilizer Revenue (USD Million) By Applications (2023-2030)
Figure 41 Middle East and Africa Potash Fertilizer Revenue (USD Million) By Region (2023-2030)
Figure 42 Middle East and Africa Potash Fertilizer Revenue (USD Million) By Region (2023-2030)
Figure 43 Middle East and Africa Potash Fertilizer Revenue (USD Million) By Type (2023-2030)
Figure 44 Middle East and Africa Potash Fertilizer Revenue (USD Million) By Applications (2023-2030)
Figure 45 Bottom-Up and Top-Down Approaches For This Report
Figure 46 Data Triangulation
