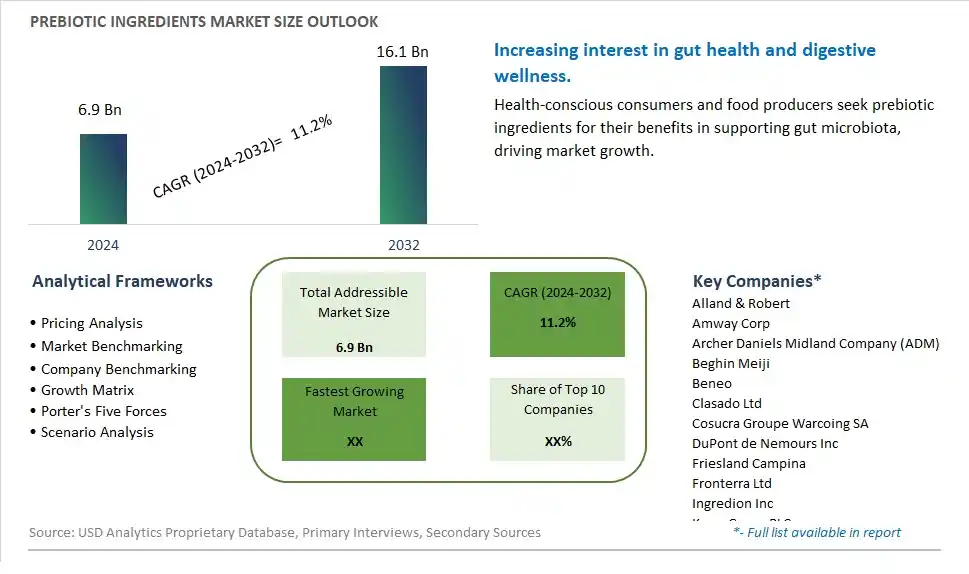
Global Prebiotic Ingredients Market Size is valued at $6.9 Billion in 2024 and is forecast to register a growth rate (CAGR) of 11.2% to reach $16.1 Billion by 2032.
The global Prebiotic Ingredients Market Comprehensive Study analyzes and forecasts the market size across 6 regions and 24 countries for diverse segments -By Type (Oligosaccharide, Inulin, Polydextrose, Others), By Application (Food & Beverage, Dietary Supplements, Animal Feed), By Source (Roots, Grains, Vegetables, Others)
An Introduction to Prebiotic Ingredients Market
The prebiotic ingredients market in 2024 is experiencing exponential growth, fueled by increasing consumer awareness of gut health, rising prevalence of digestive disorders, and advancements in nutritional science. Prebiotic ingredients, such as inulin, oligosaccharides, and resistant starches, serve as dietary fibers that selectively stimulate the growth and activity of beneficial gut bacteria, known as probiotics. With growing interest in maintaining a healthy microbiome and preventing gastrointestinal ailments, consumers are seeking foods and supplements fortified with prebiotic ingredients. Manufacturers are responding to this demand by incorporating prebiotic fibers into a wide range of functional foods, beverages, and dietary supplements, including yogurt, cereal bars, and infant formula. Moreover, innovations in ingredient sourcing, extraction techniques, and formulation technologies are enhancing the stability, solubility, and sensory properties of prebiotic ingredients, further driving market growth. Additionally, strategic partnerships between prebiotic ingredient suppliers, food manufacturers, and healthcare professionals are fostering product innovation, market expansion, and consumer education initiatives. Furthermore, scientific research highlighting the health benefits of prebiotic ingredients, such as improved digestion, immune function, and metabolic health, is driving consumer adoption and market acceptance. Overall, the prebiotic ingredients market is poised for continued expansion as consumers increasingly prioritize digestive wellness and functional foods in their dietary choices.
Prebiotic Ingredients Competitive Landscape
The market report analyses the leading companies in the industry including Alland & Robert, Amway Corp, Archer Daniels Midland Company (ADM), Beghin Meiji, Beneo, Clasado Ltd, Cosucra Groupe Warcoing SA, DuPont de Nemours Inc, Friesland Campina, Fronterra Ltd, Ingredion Inc, Kerry Group PLC, Nexira SAS, Prenexus Health, Roquette Frères, Royal Cosun, Samyang Corp, Taiyo International Inc, Tate & Lyle PLC, Vitalus Nutrition Inc, Yakult, and Others.
Prebiotic Ingredients Market Dynamics
Prebiotic Ingredients Market Trend: Growing Consumer Awareness and Demand for Gut Health Products
One prominent trend in the prebiotic ingredients market is the growing consumer awareness and demand for gut health products. With increasing emphasis on preventive healthcare and holistic wellness, consumers are seeking products that support digestive health and promote a balanced gut microbiome. Prebiotic ingredients, such as inulin, fructooligosaccharides (FOS), and resistant starches, are gaining popularity due to their ability to selectively nourish beneficial gut bacteria. This trend is driving the incorporation of prebiotic ingredients into a wide range of food and beverage products, including yogurt, cereal bars, and functional beverages, as consumers seek convenient ways to improve their digestive health.
Market Driver: Rise in Functional Food and Nutraceutical Market Segments
A key driver in the prebiotic ingredients market is the rise in functional food and nutraceutical market segments. As consumers become more proactive about their health and seek dietary solutions to address specific health concerns, there's a growing demand for functional foods and supplements enriched with bioactive ingredients, including prebiotics. Manufacturers are responding to this demand by incorporating prebiotic ingredients into a variety of product formulations, capitalizing on their potential to promote gut health, enhance immune function, and support overall well-being. This driver is fueling market growth as companies innovate and introduce new prebiotic-based products to meet the evolving needs of health-conscious consumers.
Market Opportunity: Expansion into Personal Care and Beauty Products
An emerging opportunity in the prebiotic ingredients market is the expansion into personal care and beauty products. Research has shown that the health of the gut microbiome can influence various aspects of skin health and appearance, leading to increased interest in the connection between gut health and skincare. Prebiotic ingredients, with their ability to support a healthy gut microbiome, are being explored for their potential applications in skincare formulations. By incorporating prebiotic ingredients into products such as facial cleansers, moisturizers, and hair care products, companies can offer innovative solutions that promote skin and scalp health from within, tapping into the growing market for natural and microbiome-friendly skincare solutions.
Prebiotic Ingredients Market Share Analysis: Inulin held the dominant market share in 2024
In the Prebiotic Ingredients Market, the Inulin segment stands out as the largest, driven by its extensive health benefits and versatility in food applications. Inulin, a naturally occurring polysaccharide found in various plants, is highly valued for its ability to stimulate the growth of beneficial gut bacteria, improve digestive health, and enhance calcium absorption. Its multifunctional properties make it a popular ingredient in a wide range of food and beverage products, including dairy, baked goods, and dietary supplements. The rising consumer awareness about gut health and the increasing demand for functional foods that offer added health benefits significantly boost the market for inulin. Additionally, inulin's ability to act as a fat replacer and its compatibility with various dietary trends, such as low-sugar and high-fiber diets, further drive its adoption. These factors collectively position inulin as the dominant segment in the Prebiotic Ingredients Market.
Prebiotic Ingredients Market Share Analysis: Dietary Supplements market is poised to register the fastest growth rae over the forecast period to 2032
In the Prebiotic Ingredients Market, the Dietary Supplements segment is the fastest growing, driven by the rising consumer focus on health and wellness. As people become more aware of the benefits of maintaining a healthy gut microbiome, there is an increasing demand for dietary supplements that support digestive health, enhance immunity, and improve overall well-being. Prebiotic ingredients are highly sought after in the dietary supplements sector for their ability to promote the growth of beneficial gut bacteria and improve nutrient absorption. The convenience and targeted health benefits of dietary supplements make them an attractive option for health-conscious consumers looking to address specific health concerns. Additionally, the expansion of the nutraceutical industry and the growing trend of preventive healthcare further propel the demand for prebiotic-based dietary supplements, establishing this segment as the fastest-growing application in the Prebiotic Ingredients Market.
Prebiotic Ingredients Market Share Analysis: Roots market is poised to register the fastest growth rae over the forecast period to 2032
In the Prebiotic Ingredients Market, the Roots segment is the largest, driven by its abundant availability and high content of naturally occurring prebiotics like inulin and fructooligosaccharides (FOS). Roots such as chicory root, Jerusalem artichoke, and dandelion root are rich sources of these prebiotics, which are known for their efficacy in promoting gut health by fostering the growth of beneficial bacteria. The extraction of prebiotic ingredients from roots is not only cost-effective but also aligns with the growing consumer preference for natural and plant-based products. The widespread use of root-derived prebiotics in various food and beverage applications, dietary supplements, and even animal feed contributes significantly to this segment's dominance. Furthermore, the increasing awareness of the health benefits associated with prebiotic consumption, coupled with the rising demand for functional foods, continues to drive the growth of the Roots segment in the Prebiotic Ingredients Market.
Prebiotic Ingredients Market Segmentation
By Type
Oligosaccharide
Inulin
Polydextrose
Others
By Application
Food & Beverage
Dietary Supplements
Animal Feed
By Source
Roots
Grains
Vegetables
Others
Countries Analyzed
North America (US, Canada, Mexico)
Europe (Germany, UK, France, Spain, Italy, Russia, Rest of Europe)
Asia Pacific (China, India, Japan, South Korea, Australia, South East Asia, Rest of Asia)
South America (Brazil, Argentina, Rest of South America)
Middle East and Africa (Saudi Arabia, UAE, Rest of Middle East, South Africa, Egypt, Rest of Africa)
Prebiotic Ingredients Companies Profiled in the Study
Alland & Robert
Amway Corp
Archer Daniels Midland Company (ADM)
Beghin Meiji
Beneo
Clasado Ltd
Cosucra Groupe Warcoing SA
DuPont de Nemours Inc
Friesland Campina
Fronterra Ltd
Ingredion Inc
Kerry Group PLC
Nexira SAS
Prenexus Health
Roquette Frères
Royal Cosun
Samyang Corp
Taiyo International Inc
Tate & Lyle PLC
Vitalus Nutrition Inc
Yakult
*- List Not Exhaustive
Chapter 1. TABLE OF CONTENTS
Chapter 2. Introduction to Prebiotic Ingredients Market
2.1. Market Overview
2.2. Key Statistics and Report Highlights
2.3. Scope of the Comprehensive Study
2.3.1. Market Definition
2.3.2 Countries and Regions Covered
2.3.3 Research Objective
2.3.4 Units, Currency, and Conversions
2.3.5 Industry Value Chain
2.4. Key Market Segments
2.5. Key Companies
2.6. Study Period
Chapter 3. Strategic Analysis Review
3.1. Prebiotic Ingredients Pricing Analysis and Forecast
3.2. Porter’s Five Forces
3.3. Market Ecosystem
3.4. SWOT Analysis
3.5. Regulatory Scenario
3.3. Effects of Inflation, Russia-Ukraine War, moderating economic growth, and other macroeconomic factors
Chapter 4. Competitive Landscape
4.1. Market Share Analysis
4.1.1. Global Prebiotic Ingredients Market Share by Company, 2023
4.1.2. Product Offerings of Leading Prebiotic Ingredients Companies
4.2. Market Entropy
4.2.1. New Product Launches in the Industry
4.2.2. Mergers, Acquisitions, Joint ventures, and Partnerships
4.3. Key Strategies and Best Practices
Chapter 5. Global Market Projections: Best, Reference, and Low Case Scenarios
5.1. Growth Analysis- Case Scenario Definitions
5.2. Low Growth Case Scenario Forecasts
5.3. Reference Growth Case Scenario Forecasts
5.4. High Growth Case Scenario Forecasts
Chapter 6. Market Dynamics
6.1. Prebiotic Ingredients Market Drivers
6.2. Prebiotic Ingredients Market Challenges
6.6. Prebiotic Ingredients Market Opportunities
6.4. Prebiotic Ingredients Market Trends
Chapter 7. Global Prebiotic Ingredients Market Outlook Trends
7.1. Global Prebiotic Ingredients Revenue (USD Million) and CAGR (%) by Type (2021-2032)
7.2. Global Prebiotic Ingredients Revenue (USD Million) and CAGR (%) by Application (2021-2032)
7.3. Global Prebiotic Ingredients Revenue (USD Million) and CAGR (%) by Product (2021-2032)
By Type
Oligosaccharide
Inulin
Polydextrose
Others
By Application
Food & Beverage
Dietary Supplements
Animal Feed
By Source
Roots
Grains
Vegetables
Others
Chapter 8. Global Prebiotic Ingredients Regional Analysis and Outlook
8.1. Global Prebiotic Ingredients Revenue (USD Million) By Regions (2021- 2032)
8.2. North America Prebiotic Ingredients Revenue (USD Million) by Country (2021-2032)
8.2.1. United States Prebiotic Ingredients Regional Analysis and Outlook
8.2.2. Canada Prebiotic Ingredients Regional Analysis and Outlook
8.2.3. Mexico Prebiotic Ingredients Regional Analysis and Outlook
8.3. Europe Prebiotic Ingredients Revenue (USD Million), by Country (2021-2032)
8.3.1. Germany Prebiotic Ingredients Regional Analysis and Outlook
8.3.2. France Prebiotic Ingredients Regional Analysis and Outlook
8.3.3. United Kingdom Prebiotic Ingredients Regional Analysis and Outlook
8.3.4. Spain Prebiotic Ingredients Regional Analysis and Outlook
8.3.5. Italy Prebiotic Ingredients Regional Analysis and Outlook
8.3.6. Russia Prebiotic Ingredients Regional Analysis and Outlook
8.3.7. Rest of Europe Prebiotic Ingredients Regional Analysis and Outlook
8.4. Asia Pacific Prebiotic Ingredients Revenue (USD Million) by Country (2021-2032)
8.4.1. China Prebiotic Ingredients Regional Analysis and Outlook
8.4.2. Japan Prebiotic Ingredients Regional Analysis and Outlook
8.4.3. India Prebiotic Ingredients Regional Analysis and Outlook
8.4.4. South Korea Prebiotic Ingredients Regional Analysis and Outlook
8.4.5. Australia Prebiotic Ingredients Regional Analysis and Outlook
8.4.6. South East Asia Prebiotic Ingredients Regional Analysis and Outlook
8.4.7. Rest of Asia Pacific Prebiotic Ingredients Regional Analysis and Outlook
8.5. South America Prebiotic Ingredients Revenue (USD Million), by Country (2021-2032)
8.5.1. Brazil Prebiotic Ingredients Regional Analysis and Outlook
8.5.2. Argentina Prebiotic Ingredients Regional Analysis and Outlook
8.5.3. Rest of South America Prebiotic Ingredients Regional Analysis and Outlook
8.6. Middle East and Africa Prebiotic Ingredients Revenue (USD Million) by Country (2021-2032)
8.6.1. Middle East Prebiotic Ingredients Regional Analysis and Outlook
8.6.2. Africa Prebiotic Ingredients Regional Analysis and Outlook
Chapter 9. North America Prebiotic Ingredients Analysis and Outlook
9.1. North America Prebiotic Ingredients Revenue (USD Million) by Segments (2021-2032)
9.1.1. North America Prebiotic Ingredients Revenue (USD Million) by Type (2021-2032)
9.1.2. North America Prebiotic Ingredients Revenue (USD Million) by Application (2021-2032)
9.1.3. North America Prebiotic Ingredients Revenue (USD Million) by Product (2021-2032)
By Type
Oligosaccharide
Inulin
Polydextrose
Others
By Application
Food & Beverage
Dietary Supplements
Animal Feed
By Source
Roots
Grains
Vegetables
Others
Chapter 10. Europe Prebiotic Ingredients Analysis and Outlook
10.1. Europe Prebiotic Ingredients Revenue (USD Million), by Segments (USD Million) (2021-2032)
10.1.1. Europe Prebiotic Ingredients Revenue (USD Million) by Type (2021-2032)
10.1.2. Europe Prebiotic Ingredients Revenue (USD Million) by Application (2021-2032)
10.1.3. Europe Prebiotic Ingredients Revenue (USD Million) by Product (2021-2032)
By Type
Oligosaccharide
Inulin
Polydextrose
Others
By Application
Food & Beverage
Dietary Supplements
Animal Feed
By Source
Roots
Grains
Vegetables
Others
Chapter 11. Asia Pacific Prebiotic Ingredients Analysis and Outlook
11.1. Asia Pacific Prebiotic Ingredients Revenue (USD Million), and Revenue (USD Million) by Segments (2021-2032)
11.1.1. Asia Pacific Prebiotic Ingredients Revenue (USD Million) by Type (2021-2032)
11.1.2. Asia Pacific Prebiotic Ingredients Revenue (USD Million) by Application (2021-2032)
11.1.3. Asia Pacific Prebiotic Ingredients Revenue (USD Million) by Product (2021-2032)
By Type
Oligosaccharide
Inulin
Polydextrose
Others
By Application
Food & Beverage
Dietary Supplements
Animal Feed
By Source
Roots
Grains
Vegetables
Others
Chapter 12. South America Prebiotic Ingredients Analysis and Outlook
12.1. South America Prebiotic Ingredients Revenue (USD Million), by Segments (2021-2032)
12.1.1. South America Prebiotic Ingredients Revenue (USD Million) by Type (2021-2032)
12.1.2. South America Prebiotic Ingredients Revenue (USD Million) by Application (2021-2032)
12.1.3. South America Prebiotic Ingredients Revenue (USD Million) by Product (2021-2032)
By Type
Oligosaccharide
Inulin
Polydextrose
Others
By Application
Food & Beverage
Dietary Supplements
Animal Feed
By Source
Roots
Grains
Vegetables
Others
Chapter 13. Middle East and Africa Prebiotic Ingredients Analysis and Outlook
13.1. Middle East and Africa Prebiotic Ingredients Revenue (USD Million), by Segments (2021-2032)
13.1.1. Middle East and Africa Prebiotic Ingredients Revenue (USD Million) by Type (2021-2032)
13.1.2. Middle East and Africa Prebiotic Ingredients Revenue (USD Million) by Application (2021-2032)
13.1.3. Middle East and Africa Prebiotic Ingredients Revenue (USD Million) by Product (2021-2032)
By Type
Oligosaccharide
Inulin
Polydextrose
Others
By Application
Food & Beverage
Dietary Supplements
Animal Feed
By Source
Roots
Grains
Vegetables
Others
Chapter 14. Prebiotic Ingredients Company Profiles
14.1 Business Overview
14.2 Product Profiles
14.3 SWOT Profiles
14.5 Recent Developments
14.6 Financial Profile
List of Companies
Alland & Robert
Amway Corp
Archer Daniels Midland Company (ADM)
Beghin Meiji
Beneo
Clasado Ltd
Cosucra Groupe Warcoing SA
DuPont de Nemours Inc
Friesland Campina
Fronterra Ltd
Ingredion Inc
Kerry Group PLC
Nexira SAS
Prenexus Health
Roquette Frères
Royal Cosun
Samyang Corp
Taiyo International Inc
Tate & Lyle PLC
Vitalus Nutrition Inc
Yakult
15. Methodology and Data Sources
15.1 Customization Offerings
15.2 Subscription Services
15.3 Related Reports
15.4 Publisher Expertise
LIST OF TABLES
Table 1 Market Segmentation Analysis
Table 2 Global Prebiotic Ingredients Market Share of Leading Companies, 2023
Table 3 Product Offerings of Leading Companies
Table 4 Low Growth Scenario Forecasts
Table 5 Reference Case Growth Scenario
Table 6 High Growth Case Scenario
Table 7 Global Prebiotic Ingredients Revenue (USD Million) And CAGR (%) By Type (2021-2032)
Table 8 Global Prebiotic Ingredients Revenue (USD Million) And CAGR (%) By Application (2021-2032)
Table 9 Global Prebiotic Ingredients Revenue (USD Million) And CAGR (%) By Product (2021-2032)
Table 10 Global Prebiotic Ingredients Market Revenue (USD Million) By Regions (2021-2032)
Table 11 Global Prebiotic Ingredients Market Share (%) By Regions (2021-2032)
Table 12 North America Prebiotic Ingredients Revenue (USD Million) By Country (2021-2032)
Table 13 Europe Prebiotic Ingredients Revenue (USD Million) By Country (2021-2032)
Table 14 Asia Pacific Prebiotic Ingredients Revenue (USD Million) By Country (2021-2032)
Table 15 South America Prebiotic Ingredients Revenue (USD Million) By Country (2021-2032)
Table 16 Middle East and Africa Prebiotic Ingredients Revenue (USD Million) By Region (2021-2032)
Table 17 North America Prebiotic Ingredients Revenue (USD Million) By Type (2021-2032)
Table 18 North America Prebiotic Ingredients Revenue (USD Million) By Application (2021-2032)
Table 19 North America Prebiotic Ingredients Revenue (USD Million) By Product (2021-2032)
Table 20 Europe Prebiotic Ingredients Revenue (USD Million) By Type (2021-2032)
Table 21 Europe Prebiotic Ingredients Revenue (USD Million) By Application (2021-2032)
Table 22 Europe Prebiotic Ingredients Revenue (USD Million) By Product (2021-2032)
Table 23 Asia Pacific Prebiotic Ingredients Revenue (USD Million) By Type (2021-2032)
Table 24 Asia Pacific Prebiotic Ingredients Revenue (USD Million) By Application (2021-2032)
Table 25 Asia Pacific Prebiotic Ingredients Revenue (USD Million) By Product (2021-2032)
Table 26 South America Prebiotic Ingredients Revenue (USD Million) By Type (2021-2032)
Table 27 South America Prebiotic Ingredients Revenue (USD Million) By Application (2021-2032)
Table 28 South America Prebiotic Ingredients Revenue (USD Million) By Product (2021-2032)
Table 29 Middle East and Africa Prebiotic Ingredients Revenue (USD Million) By Type (2021-2032)
Table 30 Middle East and Africa Prebiotic Ingredients Revenue (USD Million) By Application (2021-2032)
Table 31 Middle East and Africa Prebiotic Ingredients Revenue (USD Million) By Product (2021-2032)
LIST OF FIGURES
Figure 1. Market Scope
Figure 2. Pricing Forecasts Per Unit, 2023- 2032
Figure 3. Porter’s Five Forces
Figure 4. Global Prebiotic Ingredients Market Revenue (USD Million) By Regions (2021-2032)
Figure 5. Global Prebiotic Ingredients Market Share (%) By Regions (2023)
Figure 6. North America Prebiotic Ingredients Revenue (USD Million) By Country (2021-2032)
Figure 7. United States Prebiotic Ingredients Revenue (USD Million) By Country (2021-2032)
Figure 8. Canada Prebiotic Ingredients Revenue (USD Million) By Country (2021-2032)
Figure 9. Mexico Prebiotic Ingredients Revenue (USD Million) By Country (2021-2032)
Figure 10. Europe Prebiotic Ingredients Revenue (USD Million) By Country (2021-2032)
Figure 11. Germany Prebiotic Ingredients Revenue (USD Million) By Country (2021-2032)
Figure 12. France Prebiotic Ingredients Revenue (USD Million) By Country (2021-2032)
Figure 13. United Kingdom Prebiotic Ingredients Revenue (USD Million) By Country (2021-2032)
Figure 14. Spain Prebiotic Ingredients Revenue (USD Million) By Country (2021-2032)
Figure 15. Italy Prebiotic Ingredients Revenue (USD Million) By Country (2021-2032)
Figure 16. Russia Prebiotic Ingredients Revenue (USD Million) By Country (2021-2032)
Figure 17. Rest of Europe Prebiotic Ingredients Revenue (USD Million) By Country (2021-2032)
Figure 11. Asia Pacific Prebiotic Ingredients Revenue (USD Million) By Country (2021-2032)
Figure 12. China Prebiotic Ingredients Revenue (USD Million) By Country (2021-2032)
Figure 13. Japan Prebiotic Ingredients Revenue (USD Million) By Country (2021-2032)
Figure 14. India Prebiotic Ingredients Revenue (USD Million) By Country (2021-2032)
Figure 15. South Korea Prebiotic Ingredients Revenue (USD Million) By Country (2021-2032)
Figure 16. Australia Prebiotic Ingredients Revenue (USD Million) By Country (2021-2032)
Figure 17. South East Asia Prebiotic Ingredients Revenue (USD Million) By Country (2021-2032)
Figure 18. South America Prebiotic Ingredients Revenue (USD Million) By Country (2021-2032)
Figure 19. Brazil Prebiotic Ingredients Revenue (USD Million) By Country (2021-2032)
Figure 20. Argentina Prebiotic Ingredients Revenue (USD Million) By Country (2021-2032)
Figure 21. Rest of Asia Pacific Prebiotic Ingredients Revenue (USD Million) By Country (2021-2032)
Figure 22. Middle East and Africa Prebiotic Ingredients Revenue (USD Million) By Region (2021-2032)
Figure 23. Saudi Arabia Prebiotic Ingredients Revenue (USD Million) By Region (2021-2032)
Figure 24. The UAE Prebiotic Ingredients Revenue (USD Million) By Region (2021-2032)
Figure 25. Rest of Middle East Prebiotic Ingredients Revenue (USD Million) By Region (2021-2032)
Figure 26. South Africa Prebiotic Ingredients Revenue (USD Million) By Region (2021-2032)
Figure 27. Africa Prebiotic Ingredients Revenue (USD Million) By Region (2021-2032)
Figure 28. North America Prebiotic Ingredients Revenue (USD Million) By Type (2021-2032)
Figure 29. North America Prebiotic Ingredients Revenue (USD Million) By Application (2021-2032)
Figure 30. North America Prebiotic Ingredients Revenue (USD Million) By Product (2021-2032)
Figure 31. Europe Prebiotic Ingredients Revenue (USD Million) By Type (2021-2032)
Figure 32. Europe Prebiotic Ingredients Revenue (USD Million) By Application (2021-2032)
Figure 33. Europe Prebiotic Ingredients Revenue (USD Million) By Product (2021-2032)
Figure 34. Asia Pacific Prebiotic Ingredients Revenue (USD Million) By Type (2021-2032)
Figure 35. Asia Pacific Prebiotic Ingredients Revenue (USD Million) By Application (2021-2032)
Figure 36. Asia Pacific Prebiotic Ingredients Revenue (USD Million) By Product (2021-2032)
Figure 37. South America Prebiotic Ingredients Revenue (USD Million) By Type (2021-2032)
Figure 38. South America Prebiotic Ingredients Revenue (USD Million) By Application (2021-2032)
Figure 39. South America Prebiotic Ingredients Revenue (USD Million) By Product (2021-2032)
Figure 40. Middle East and Africa Prebiotic Ingredients Revenue (USD Million) By Type (2021-2032)
Figure 41. Middle East and Africa Prebiotic Ingredients Revenue (USD Million) By Application (2021-2032)
Figure 42. Middle East and Africa Prebiotic Ingredients Revenue (USD Million) By Product (2021-2032)
By Type
Oligosaccharide
Inulin
Polydextrose
Others
By Application
Food & Beverage
Dietary Supplements
Animal Feed
By Source
Roots
Grains
Vegetables
Others
Countries Analyzed
North America (US, Canada, Mexico)
Europe (Germany, UK, France, Spain, Italy, Russia, Rest of Europe)
Asia Pacific (China, India, Japan, South Korea, Australia, South East Asia, Rest of Asia)
South America (Brazil, Argentina, Rest of South America)
Middle East and Africa (Saudi Arabia, UAE, Rest of Middle East, South Africa, Egypt, Rest of Africa)
