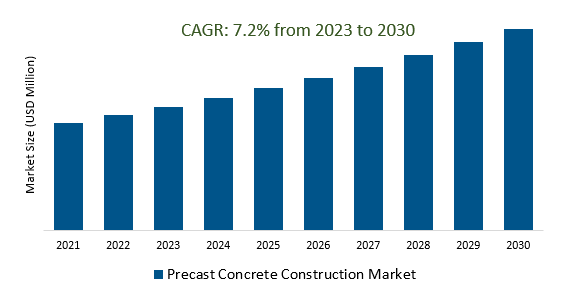
The Global Precast Concrete Construction Market Size is estimated to register 7.2% growth over the forecast period from 2023 to 2030.
The market growth is driven by the increasing awareness of environmental concerns has led to an increased focus on sustainable construction methods. Precast concrete, which can be produced with lower carbon emissions, is gaining popularity. Leading companies that are focused on Sustainable Practices, Advanced Materials and Technologies, Digitalization and Automation, Modular and Prefabricated Construction, Infrastructure Investment, Urbanization and Population Growth, Market Expansion, Customization and Aesthetics, and others to boost market shares in the industry.
Market Overview
The precast concrete construction market involves off-site manufacturing of concrete elements, driven by urbanization, infrastructure investment, and sustainability. It offers advantages like reduced construction time and improved quality control. Market segments include structural and architectural elements across residential, commercial, and infrastructure projects. Technological advancements like automation and digitalization enhance efficiency and design possibilities, but cost barriers and environmental concerns persist. Sustainability initiatives focus on reducing carbon footprint and using recycled materials. Overall, the market thrives due to its adaptability to diverse construction needs, though ongoing innovation is crucial to address challenges and meet evolving demands.
Market Dynamics
Market Trends - Transportation Infrastructure
The transportation infrastructure segment in the precast concrete construction market pertains to using precast concrete components in projects like bridges, highways, and tunnels. Precast concrete is chosen for its durability and quick installation, and it aligns with government investments in infrastructure development. Innovations, such as segmental bridge construction and tunnel segments, enhance project efficiency and quality, making precision engineering and regulatory compliance crucial for companies operating in this sector and contributing to overall industry growth.
Market Driver- Advanced Materials Demand Precast Concrete Construction Market
The precast concrete construction market is experiencing rising demand for advanced materials, particularly high-performance concrete mixes with additives like fibers and nanoparticles. These materials enhance strength, durability, and aesthetics, aligning with sustainability and architectural requirements in modern construction projects.
Market Opportunity-Introduction of Maintenance Benefits
Maintenance benefits are a key advantage in the precast concrete construction market, stemming from the material's durability and resistance to environmental factors. This results in lower long-term maintenance costs and longer service life, making precast concrete a preferred choice for construction projects.
Market Share Analysis- Elemental Construction Precast Concrete Construction Market will register the fastest growth
The Global Precast Concrete Construction Market is analyzed across Elemental Construction, Permanent Modular Buildings, Reloadable Buildings, and others. Of these, Elemental Construction is poised to register the fastest growth. Elemental construction in the precast concrete construction market involves assembling building components using precast concrete elements manufactured off-site. This method offers benefits such as reduced on-site labor, quicker project completion, and enhanced quality control, making it popular in various construction projects, including residential, commercial, and infrastructure.
Market Share Analysis- Commercial held a significant market share in 2023
The Global Precast Concrete Construction Market is analyzed across various applications including Commercial, Residential, Industrial, and others. Of these, Commercial held a significant market share in 2023. In the precast concrete construction market, the commercial sector involves utilizing precast concrete elements in non-residential building projects such as offices, retail spaces, hotels, and warehouses. Precast concrete's efficiency, rapid construction, and versatility in meeting architectural demands make it a preferred choice, enabling faster project completion and durable, aesthetically pleasing commercial structures.
Precast Concrete Construction Market Segmentation
By Type
- Permanent Modular Buildings
- Elemental Construction
- Reloadable Buildings
By Application
- Residential
- Commercial
- Industrial
- Others
By Region
- North America (United States, Canada, Mexico)
- Europe (Germany, France, United Kingdom, Spain, Italy, Others)
- Asia Pacific (China, India, Japan, South Korea, Australia, Others)
- Latin America (Brazil, Argentina, Others)
- Middle East and Africa (Saudi Arabia, UAE, Kuwait, Other Middle East, South Africa, Nigeria, Other Africa)
Precast Concrete Construction Market Companies
- High Concrete Group LLC
- ICL Construction
- KEF Infra
- Gulf Precast
- PRECA
- Atlanta Structural Concrete (ASC)
- Vollert
- Ashtabula Concrete & Construction (AC&C)
- Simon Contractors
- Atlas Concrete
- WAMA AB
- Binghamton Precast & Supply Corp
- Schuster Concrete Construction
- Barfoote Construction
- Pekso Precast
- ARMADO
- Western Precast Structures Inc
- Amrapali
- Westkon Precast
*List not exhaustive
Precast Concrete Construction Market Outlook 2023
1 Market Overview
1.1 Introduction to the Precast Concrete Construction Market
1.2 Scope of the Study
1.3 Research Objective
1.3.1 Key Market Scope and Segments
1.3.2 Players Covered
1.3.3 Years Considered
2 Executive Summary
2.1 2023 Precast Concrete Construction Industry- Market Statistics
3 Market Dynamics
3.1 Market Drivers
3.2 Market Challenges
3.3 Market Opportunities
3.4 Market Trends
4 Market Factor Analysis
4.1 Porter’s Five Forces
4.2 Market Entropy
4.2.1 Global Precast Concrete Construction Market Companies with Area Served
4.2.2 Products Offerings Global Precast Concrete Construction Market
5 COVID-19 Impact Analysis and Outlook Scenarios
5.1.1 Covid-19 Impact Analysis
5.1.2 post-COVID-19 Scenario- Low Growth Case
5.1.3 post-COVID-19 Scenario- Reference Growth Case
5.1.4 post-COVID-19 Scenario- Low Growth Case
6 Global Precast Concrete Construction Market Trends
6.1 Global Precast Concrete Construction Revenue (USD Million) and CAGR (%) by Type (2018-2030)
6.2 Global Precast Concrete Construction Revenue (USD Million) and CAGR (%) by Applications (2018-2030)
6.3 Global Precast Concrete Construction Revenue (USD Million) and CAGR (%) by regions (2018-2030)
7 Global Precast Concrete Construction Market Revenue (USD Million) by Type, and Applications (2018-2022)
7.1 Global Precast Concrete Construction Revenue (USD Million) by Type (2018-2022)
7.1.1 Global Precast Concrete Construction Revenue (USD Million), Market Share (%) by Type (2018-2022)
7.2 Global Precast Concrete Construction Revenue (USD Million) by Applications (2018-2022)
7.2.1 Global Precast Concrete Construction Revenue (USD Million), Market Share (%) by Applications (2018-2022)
8 Global Precast Concrete Construction Development Regional Status and Outlook
8.1 Global Precast Concrete Construction Revenue (USD Million) By Regions (2018-2022)
8.2 North America Precast Concrete Construction Revenue (USD Million) by Type, and Application (2018-2022)
8.2.1 North America Precast Concrete Construction Revenue (USD Million) by Country (2018-2022)
8.2.2 North America Precast Concrete Construction Revenue (USD Million) by Type (2018-2022)
8.2.3 North America Precast Concrete Construction Revenue (USD Million) by Applications (2018-2022)
8.3 Europe Precast Concrete Construction Revenue (USD Million), by Type, and Applications (USD Million) (2018-2022)
8.3.1 Europe Precast Concrete Construction Revenue (USD Million), by Country (2018-2022)
8.3.2 Europe Precast Concrete Construction Revenue (USD Million) by Type (2018-2022)
8.3.3 Europe Precast Concrete Construction Revenue (USD Million) by Applications (2018-2022)
8.4 Asia Pacific Precast Concrete Construction Revenue (USD Million), and Revenue (USD Million) by Type, and Applications (2018-2022)
8.4.1 Asia Pacific Precast Concrete Construction Revenue (USD Million) by Country (2018-2022)
8.4.2 Asia Pacific Precast Concrete Construction Revenue (USD Million) by Type (2018-2022)
8.4.3 Asia Pacific Precast Concrete Construction Revenue (USD Million) by Applications (2018-2022)
8.5 South America Precast Concrete Construction Revenue (USD Million), by Type, and Applications (2018-2022)
8.5.1 South America Precast Concrete Construction Revenue (USD Million), by Country (2018-2022)
8.5.2 South America Precast Concrete Construction Revenue (USD Million) by Type (2018-2022)
8.5.3 South America Precast Concrete Construction Revenue (USD Million) by Applications (2018-2022)
8.6 Middle East and Africa Precast Concrete Construction Revenue (USD Million), by Type, Technology, Application, Thickness (2018-2022)
8.6.1 Middle East and Africa Precast Concrete Construction Revenue (USD Million) by Country (2018-2022)
8.6.2 Middle East and Africa Precast Concrete Construction Revenue (USD Million) by Type (2018-2022)
8.6.3 Middle East and Africa Precast Concrete Construction Revenue (USD Million) by Applications (2018-2022)
9 Company Profiles
10 Global Precast Concrete Construction Market Revenue (USD Million), by Type, and Applications (2023-2030)
10.1 Global Precast Concrete Construction Revenue (USD Million) and Market Share (%) by Type (2023-2030)
10.1.1 Global Precast Concrete Construction Revenue (USD Million), and Market Share (%) by Type (2023-2030)
10.2 Global Precast Concrete Construction Revenue (USD Million) and Market Share (%) by Applications (2023-2030)
10.2.1 Global Precast Concrete Construction Revenue (USD Million), and Market Share (%) by Applications (2023-2030)
11 Global Precast Concrete Construction Development Regional Status and Outlook Forecast
11.1 Global Precast Concrete Construction Revenue (USD Million) By Regions (2023-2030)
11.2 North America Precast Concrete Construction Revenue (USD Million) by Type, and Applications (2023-2030)
11.2.1 North America Precast Concrete Construction Revenue (USD) Million by Country (2023-2030)
11.2.2 North America Precast Concrete Construction Revenue (USD Million), by Type (2023-2030)
11.2.3 North America Precast Concrete Construction Revenue (USD Million), Market Share (%) by Applications (2023-2030)
11.3 Europe Precast Concrete Construction Revenue (USD Million), by Type, and Applications (2023-2030)
11.3.1 Europe Precast Concrete Construction Revenue (USD Million), by Country (2023-2030)
11.3.2 Europe Precast Concrete Construction Revenue (USD Million), by Type (2023-2030)
11.3.3 Europe Precast Concrete Construction Revenue (USD Million), by Applications (2023-2030)
11.4 Asia Pacific Precast Concrete Construction Revenue (USD Million) by Type, and Applications (2023-2030)
11.4.1 Asia Pacific Precast Concrete Construction Revenue (USD Million), by Country (2023-2030)
11.4.2 Asia Pacific Precast Concrete Construction Revenue (USD Million), by Type (2023-2030)
11.4.3 Asia Pacific Precast Concrete Construction Revenue (USD Million), by Applications (2023-2030)
11.5 South America Precast Concrete Construction Revenue (USD Million), by Type, and Applications (2023-2030)
11.5.1 South America Precast Concrete Construction Revenue (USD Million), by Country (2023-2030)
11.5.2 South America Precast Concrete Construction Revenue (USD Million), by Type (2023-2030)
11.5.3 South America Precast Concrete Construction Revenue (USD Million), by Applications (2023-2030)
11.6 Middle East and Africa Precast Concrete Construction Revenue (USD Million), by Type, and Applications (2023-2030)
11.6.1 Middle East and Africa Precast Concrete Construction Revenue (USD Million), by region (2023-2030)
11.6.2 Middle East and Africa Precast Concrete Construction Revenue (USD Million), by Type (2023-2030)
11.6.3 Middle East and Africa Precast Concrete Construction Revenue (USD Million), by Applications (2023-2030)
12 Methodology and Data Sources
12.1 Methodology/Research Approach
12.1.1 Research Programs/Design
12.1.2 Market Size Estimation
12.1.3 Market Breakdown and Data Triangulation
12.2 Data Sources
12.2.1 Secondary Sources
12.2.2 Primary Sources
12.3 Disclaimer
List of Tables
Table 1 Market Segmentation Analysis
Table 2 Global Precast Concrete Construction Market Companies with Areas Served
Table 3 Products Offerings Global Precast Concrete Construction Market
Table 4 Low Growth Scenario Forecasts
Table 5 Reference Case Growth Scenario
Table 6 High Growth Case Scenario
Table 7 Global Precast Concrete Construction Revenue (USD Million) And CAGR (%) By Type (2018-2030)
Table 8 Global Precast Concrete Construction Revenue (USD Million) And CAGR (%) By Applications (2018-2030)
Table 9 Global Precast Concrete Construction Revenue (USD Million) And CAGR (%) By Regions (2018-2030)
Table 10 Global Precast Concrete Construction Revenue (USD Million) By Type (2018-2022)
Table 11 Global Precast Concrete Construction Revenue Market Share (%) By Type (2018-2022)
Table 12 Global Precast Concrete Construction Revenue (USD Million) By Applications (2018-2022)
Table 13 Global Precast Concrete Construction Revenue Market Share (%) By Applications (2018-2022)
Table 14 Global Precast Concrete Construction Market Revenue (USD Million) By Regions (2018-2022)
Table 15 Global Precast Concrete Construction Market Share (%) By Regions (2018-2022)
Table 16 North America Precast Concrete Construction Revenue (USD Million) By Country (2018-2022)
Table 17 North America Precast Concrete Construction Revenue (USD Million) By Type (2018-2022)
Table 18 North America Precast Concrete Construction Revenue (USD Million) By Applications (2018-2022)
Table 19 Europe Precast Concrete Construction Revenue (USD Million) By Country (2018-2022)
Table 20 Europe Precast Concrete Construction Revenue (USD Million) By Type (2018-2022)
Table 21 Europe Precast Concrete Construction Revenue (USD Million) By Applications (2018-2022)
Table 22 Asia Pacific Precast Concrete Construction Revenue (USD Million) By Country (2018-2022)
Table 23 Asia Pacific Precast Concrete Construction Revenue (USD Million) By Type (2018-2022)
Table 24 Asia Pacific Precast Concrete Construction Revenue (USD Million) By Applications (2018-2022)
Table 25 South America Precast Concrete Construction Revenue (USD Million) By Country (2018-2022)
Table 26 South America Precast Concrete Construction Revenue (USD Million) By Type (2018-2022)
Table 27 South America Precast Concrete Construction Revenue (USD Million) By Applications (2018-2022)
Table 28 Middle East and Africa Precast Concrete Construction Revenue (USD Million) By Region (2018-2022)
Table 29 Middle East and Africa Precast Concrete Construction Revenue (USD Million) By Type (2018-2022)
Table 30 Middle East and Africa Precast Concrete Construction Revenue (USD Million) By Applications (2018-2022)
Table 31 Financial Analysis
Table 32 Global Precast Concrete Construction Revenue (USD Million) By Type (2023-2030)
Table 33 Global Precast Concrete Construction Revenue Market Share (%) By Type (2023-2030)
Table 34 Global Precast Concrete Construction Revenue (USD Million) By Applications (2023-2030)
Table 35 Global Precast Concrete Construction Revenue Market Share (%) By Applications (2023-2030)
Table 36 Global Precast Concrete Construction Market Revenue (USD Million), And Revenue (USD Million) By Regions (2023-2030)
Table 37 North America Precast Concrete Construction Revenue (USD)By Country (2023-2030)
Table 38 North America Precast Concrete Construction Revenue (USD Million) By Type (2023-2030)
Table 39 North America Precast Concrete Construction Revenue (USD Million) By Applications (2023-2030)
Table 40 Europe Precast Concrete Construction Revenue (USD Million) By Country (2023-2030)
Table 41 Europe Precast Concrete Construction Revenue (USD Million) By Type (2023-2030)
Table 42 Europe Precast Concrete Construction Revenue (USD Million) By Applications (2023-2030)
Table 43 Asia Pacific Precast Concrete Construction Revenue (USD Million) By Country (2023-2030)
Table 44 Asia Pacific Precast Concrete Construction Revenue (USD Million) By Type (2023-2030)
Table 45 Asia Pacific Precast Concrete Construction Revenue (USD Million) By Applications (2023-2030)
Table 46 South America Precast Concrete Construction Revenue (USD Million) By Country (2023-2030)
Table 47 South America Precast Concrete Construction Revenue (USD Million) By Type (2023-2030)
Table 48 South America Precast Concrete Construction Revenue (USD Million) By Applications (2023-2030)
Table 49 Middle East and Africa Precast Concrete Construction Revenue (USD Million) By Region (2023-2030)
Table 50 Middle East and Africa Precast Concrete Construction Revenue (USD Million) By Region (2023-2030)
Table 51 Middle East and Africa Precast Concrete Construction Revenue (USD Million) By Type (2023-2030)
Table 52 Middle East and Africa Precast Concrete Construction Revenue (USD Million) By Applications (2023-2030)
Table 53 Research Programs/Design for This Report
Table 54 Key Data Information from Secondary Sources
Table 55 Key Data Information from Primary Sources
List of Figures
Figure 1 Market Scope
Figure 2 Porter’s Five Forces
Figure 3 Global Precast Concrete Construction Revenue (USD Million) By Type (2018-2022)
Figure 4 Global Precast Concrete Construction Revenue Market Share (%) By Type (2022)
Figure 5 Global Precast Concrete Construction Revenue (USD Million) By Applications (2018-2022)
Figure 6 Global Precast Concrete Construction Revenue Market Share (%) By Applications (2022)
Figure 7 Global Precast Concrete Construction Market Revenue (USD Million) By Regions (2018-2022)
Figure 8 Global Precast Concrete Construction Market Share (%) By Regions (2022)
Figure 9 North America Precast Concrete Construction Revenue (USD Million) By Country (2018-2022)
Figure 10 North America Precast Concrete Construction Revenue (USD Million) By Type (2018-2022)
Figure 11 North America Precast Concrete Construction Revenue (USD Million) By Applications (2018-2022)
Figure 12 Europe Precast Concrete Construction Revenue (USD Million) By Country (2018-2022)
Figure 13 Europe Precast Concrete Construction Revenue (USD Million) By Type (2018-2022)
Figure 14 Europe Precast Concrete Construction Revenue (USD Million) By Applications (2018-2022)
Figure 15 Asia Pacific Precast Concrete Construction Revenue (USD Million) By Country (2018-2022)
Figure 16 Asia Pacific Precast Concrete Construction Revenue (USD Million) By Type (2018-2022)
Figure 17 Asia Pacific Precast Concrete Construction Revenue (USD Million) By Applications (2018-2022)
Figure 18 South America Precast Concrete Construction Revenue (USD Million) By Country (2018-2022)
Figure 19 South America Precast Concrete Construction Revenue (USD Million) By Type (2018-2022)
Figure 20 South America Precast Concrete Construction Revenue (USD Million) By Applications (2018-2022)
Figure 21 Middle East and Africa Precast Concrete Construction Revenue (USD Million) By Region (2018-2022)
Figure 22 Middle East and Africa Precast Concrete Construction Revenue (USD Million) By Type (2018-2022)
Figure 23 Middle East and Africa Precast Concrete Construction Revenue (USD Million) By Applications (2018-2022)
Figure 24 Global Precast Concrete Construction Revenue (USD Million) By Type (2023-2030)
Figure 25 Global Precast Concrete Construction Revenue Market Share (%) By Type (2030)
Figure 26 Global Precast Concrete Construction Revenue (USD Million) By Applications (2023-2030)
Figure 27 Global Precast Concrete Construction Revenue Market Share (%) By Applications (2030)
Figure 28 Global Precast Concrete Construction Market Revenue (USD Million) By Regions (2023-2030)
Figure 29 North America Precast Concrete Construction Revenue (USD Million) By Country (2023-2030)
Figure 30 North America Precast Concrete Construction Revenue (USD Million) By Type (2023-2030)
Figure 31 North America Precast Concrete Construction Revenue (USD Million) By Applications (2023-2030)
Figure 32 Europe Precast Concrete Construction Revenue (USD Million) By Country (2023-2030)
Figure 33 Europe Precast Concrete Construction Revenue (USD Million) By Type (2023-2030)
Figure 34 Europe Precast Concrete Construction Revenue (USD Million) By Applications (2023-2030)
Figure 35 Asia Pacific Precast Concrete Construction Revenue (USD Million) By Country (2023-2030)
Figure 36 Asia Pacific Precast Concrete Construction Revenue (USD Million) By Type (2023-2030)
Figure 37 Asia Pacific Precast Concrete Construction Revenue (USD Million) By Applications (2023-2030)
Figure 38 South America Precast Concrete Construction Revenue (USD Million) By Country (2023-2030)
Figure 39 South America Precast Concrete Construction Revenue (USD Million) By Type (2023-2030)
Figure 40 South America Precast Concrete Construction Revenue (USD Million) By Applications (2023-2030)
Figure 41 Middle East and Africa Precast Concrete Construction Revenue (USD Million) By Region (2023-2030)
Figure 42 Middle East and Africa Precast Concrete Construction Revenue (USD Million) By Region (2023-2030)
Figure 43 Middle East and Africa Precast Concrete Construction Revenue (USD Million) By Type (2023-2030)
Figure 44 Middle East and Africa Precast Concrete Construction Revenue (USD Million) By Applications (2023-2030)
Figure 45 Bottom-Up and Top-Down Approaches for This Report
Figure 46 Data Triangulation
