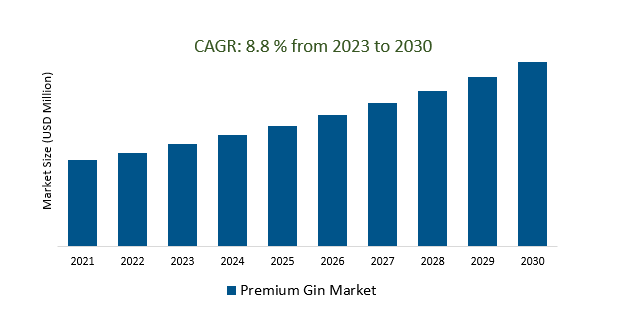
The Global Premium Gin Market Size is estimated to register 8.8% growth over the forecast period from 2023 to 2030.
The market growth is driven by an increasing Consumers who are increasingly looking for unique and handcrafted spirits. Premium gin brands often emphasize their artisanal production methods and high-quality ingredients to appeal to this trend. Leading Companies focusing on Global Expansion, Innovation in Botanicals and Flavors, Cocktail Culture and Mixology, Health and Wellness Trends, Government Regulations and Trade Agreements, and others to boost market shares in the industry.
Market Overview
The premium gin market was experiencing robust growth, driven by consumer demand for handcrafted, distinctive gins with unique botanical profiles. Key trends included the craft and artisanal movement, botanical innovation, gin tourism, cocktail culture, and an increasing focus on sustainability. Premium gin brands were expanding globally, with e-commerce gaining importance as a distribution channel. However, the market also faced challenges related to competition and brand differentiation, driving the need for ongoing innovation and brand storytelling to maintain a premium image. The market's future outlook appeared promising, with continued growth expected as consumers sought high-quality gin experiences, but it's important to refer to more recent data for the latest developments in the premium gin market.
Market Dynamics
Market Trends- Celebrity and influencer endorsements drive demand for premium gin
Celebrity and influencer endorsements play a pivotal role in driving demand for premium gin in today's market. When well-known figures align themselves with specific premium gin brands, they not only enhance brand visibility but also create a connection with a wider and often younger audience. These endorsements provide social proof, lending an air of sophistication and desirability to the products. Consumers are increasingly influenced by the lifestyle and choices of their favorite celebrities and social media influencers, making such endorsements a powerful tool for premium gin brands seeking to capture the attention of discerning consumers looking for unique and high-quality spirits.
Market Driver- Rising demand for low- and no-alcohol variants boosts the premium gin market.
he rising demand for low- and no-alcohol variants is making a notable impact on the premium gin market. As health-conscious consumers seek lighter and more responsible drinking options, premium gin brands are increasingly introducing low- and no-alcohol gin alternatives to cater to this growing trend. These variants allow consumers to enjoy the botanical complexity and flavors associated with premium gin without the alcoholic content, making them an attractive choice for those looking to savor the essence of gin in their cocktails or as standalone beverages.
Market Opportunity- Cocktail culture drives demand for premium gin, as bartenders experiment with new and innovative recipes
Cocktail culture is a significant driver of demand for premium gin, with bartenders continually exploring new and innovative recipes that showcase the versatility and distinct flavors of these high-quality spirits. As consumers increasingly seek sophisticated and unique cocktail experiences, premium gin's adaptability in classic and creative drinks positions it as a preferred base spirit. This trend not only boosts sales but also enhances the premium image of gin brands, making them integral players in the thriving cocktail scene and contributing to the continued growth of the premium gin market.
Market Share Analysis- New Western Dry Gin Premium Gin Market will register the fastest growth
The Global Premium Gin Market is analyzed across Distilled gin, Redistilled gin, Compound gin, London Dry gin, Plymouth gin, Old Tom gin, New Western Dry gin, and others. New Western Dry gin is poised to register the fastest growth. New Western Dry Gin, a subcategory of premium gin, stands out in the market for its departure from traditional styles and emphasis on unique botanicals and flavors, appealing to consumers seeking innovative gin experiences, and contributing to the evolving premium gin landscape.
Market Share Analysis- E-commerce held a significant market share in 2023
The Global Premium Gin Market is analyzed across various Organizations including Retail Stores, supermarkets/hypermarkets, E-commerce, and others. Of these, E-commerce held a significant market share in 2023. E-commerce is a pivotal distribution channel in the premium gin market, capitalizing on consumers' online shopping preferences and enabling premium gin brands to expand their reach, adapt to changing market dynamics, and enhance convenience in purchasing and delivery.
Premium Gin Market Segmentation
By Type
- Distilled gin
- Redistilled gin
- Compound gin
- London Dry gin
- Plymouth gin
- Old Tom gin
- New Western Dry gin
By Application
- Retail Stores
- Supermarket/Hypermarket
- E-commerce
By Region
- North America (United States, Canada, Mexico)
- Europe (Germany, France, United Kingdom, Spain, Italy, Others)
- Asia Pacific (China, India, Japan, South Korea, Australia, Others)
- Latin America (Brazil, Argentina, Others)
- Middle East and Africa (Saudi Arabia, UAE, Kuwait, Other Middle East, South Africa, Nigeria, Other Africa)
Premium Gin Market Companies
- Plymouth (United Kingdom)
- Beefeater (United Kingdom)
- Bombay Sapphire (United Kingdom)
- Tanqueray (United Kingdom)
- Gordon’s (United States)
- Stadaconé Noir (Canada)
- Hendrick’s Neptunia (United States)
- Ginarte (United States)
- Fundy Gin (Canada)
- Scapegrace Black (New Zealand)
*List not exhaustive
Premium Gin Market Outlook 2023
1 Market Overview
1.1 Introduction to the Premium Gin Market
1.2 Scope of the Study
1.3 Research Objective
1.3.1 Key Market Scope and Segments
1.3.2 Players Covered
1.3.3 Years Considered
2 Executive Summary
2.1 2023 Premium Gin Industry- Market Statistics
3 Market Dynamics
3.1 Market Drivers
3.2 Market Challenges
3.3 Market Opportunities
3.4 Market Trends
4 Market Factor Analysis
4.1 Porter’s Five Forces
4.2 Market Entropy
4.2.1 Global Premium Gin Market Companies with Area Served
4.2.2 Products Offerings Global Premium Gin Market
5 COVID-19 Impact Analysis and Outlook Scenarios
5.1.1 Covid-19 Impact Analysis
5.1.2 post-COVID-19 Scenario- Low Growth Case
5.1.3 post-COVID-19 Scenario- Reference Growth Case
5.1.4 post-COVID-19 Scenario- Low Growth Case
6 Global Premium Gin Market Trends
6.1 Global Premium Gin Revenue (USD Million) and CAGR (%) by Type (2018-2030)
6.2 Global Premium Gin Revenue (USD Million) and CAGR (%) by Applications (2018-2030)
6.3 Global Premium Gin Revenue (USD Million) and CAGR (%) by regions (2018-2030)
7 Global Premium Gin Market Revenue (USD Million) by Type, and Applications (2018-2022)
7.1 Global Premium Gin Revenue (USD Million) by Type (2018-2022)
7.1.1 Global Premium Gin Revenue (USD Million), Market Share (%) by Type (2018-2022)
7.2 Global Premium Gin Revenue (USD Million) by Applications (2018-2022)
7.2.1 Global Premium Gin Revenue (USD Million), Market Share (%) by Applications (2018-2022)
8 Global Premium Gin Development Regional Status and Outlook
8.1 Global Premium Gin Revenue (USD Million) By Regions (2018-2022)
8.2 North America Premium Gin Revenue (USD Million) by Type, and Application (2018-2022)
8.2.1 North America Premium Gin Revenue (USD Million) by Country (2018-2022)
8.2.2 North America Premium Gin Revenue (USD Million) by Type (2018-2022)
8.2.3 North America Premium Gin Revenue (USD Million) by Applications (2018-2022)
8.3 Europe Premium Gin Revenue (USD Million), by Type, and Applications (USD Million) (2018-2022)
8.3.1 Europe Premium Gin Revenue (USD Million), by Country (2018-2022)
8.3.2 Europe Premium Gin Revenue (USD Million) by Type (2018-2022)
8.3.3 Europe Premium Gin Revenue (USD Million) by Applications (2018-2022)
8.4 Asia Pacific Premium Gin Revenue (USD Million), and Revenue (USD Million) by Type, and Applications (2018-2022)
8.4.1 Asia Pacific Premium Gin Revenue (USD Million) by Country (2018-2022)
8.4.2 Asia Pacific Premium Gin Revenue (USD Million) by Type (2018-2022)
8.4.3 Asia Pacific Premium Gin Revenue (USD Million) by Applications (2018-2022)
8.5 South America Premium Gin Revenue (USD Million), by Type, and Applications (2018-2022)
8.5.1 South America Premium Gin Revenue (USD Million), by Country (2018-2022)
8.5.2 South America Premium Gin Revenue (USD Million) by Type (2018-2022)
8.5.3 South America Premium Gin Revenue (USD Million) by Applications (2018-2022)
8.6 Middle East and Africa Premium Gin Revenue (USD Million), by Type, Technology, Application, Thickness (2018-2022)
8.6.1 Middle East and Africa Premium Gin Revenue (USD Million) by Country (2018-2022)
8.6.2 Middle East and Africa Premium Gin Revenue (USD Million) by Type (2018-2022)
8.6.3 Middle East and Africa Premium Gin Revenue (USD Million) by Applications (2018-2022)
9 Company Profiles
10 Global Premium Gin Market Revenue (USD Million), by Type, and Applications (2023-2030)
10.1 Global Premium Gin Revenue (USD Million) and Market Share (%) by Type (2023-2030)
10.1.1 Global Premium Gin Revenue (USD Million), and Market Share (%) by Type (2023-2030)
10.2 Global Premium Gin Revenue (USD Million) and Market Share (%) by Applications (2023-2030)
10.2.1 Global Premium Gin Revenue (USD Million), and Market Share (%) by Applications (2023-2030)
11 Global Premium Gin Development Regional Status and Outlook Forecast
11.1 Global Premium Gin Revenue (USD Million) By Regions (2023-2030)
11.2 North America Premium Gin Revenue (USD Million) by Type, and Applications (2023-2030)
11.2.1 North America Premium Gin Revenue (USD) Million by Country (2023-2030)
11.2.2 North America Premium Gin Revenue (USD Million), by Type (2023-2030)
11.2.3 North America Premium Gin Revenue (USD Million), Market Share (%) by Applications (2023-2030)
11.3 Europe Premium Gin Revenue (USD Million), by Type, and Applications (2023-2030)
11.3.1 Europe Premium Gin Revenue (USD Million), by Country (2023-2030)
11.3.2 Europe Premium Gin Revenue (USD Million), by Type (2023-2030)
11.3.3 Europe Premium Gin Revenue (USD Million), by Applications (2023-2030)
11.4 Asia Pacific Premium Gin Revenue (USD Million) by Type, and Applications (2023-2030)
11.4.1 Asia Pacific Premium Gin Revenue (USD Million), by Country (2023-2030)
11.4.2 Asia Pacific Premium Gin Revenue (USD Million), by Type (2023-2030)
11.4.3 Asia Pacific Premium Gin Revenue (USD Million), by Applications (2023-2030)
11.5 South America Premium Gin Revenue (USD Million), by Type, and Applications (2023-2030)
11.5.1 South America Premium Gin Revenue (USD Million), by Country (2023-2030)
11.5.2 South America Premium Gin Revenue (USD Million), by Type (2023-2030)
11.5.3 South America Premium Gin Revenue (USD Million), by Applications (2023-2030)
11.6 Middle East and Africa Premium Gin Revenue (USD Million), by Type, and Applications (2023-2030)
11.6.1 Middle East and Africa Premium Gin Revenue (USD Million), by region (2023-2030)
11.6.2 Middle East and Africa Premium Gin Revenue (USD Million), by Type (2023-2030)
11.6.3 Middle East and Africa Premium Gin Revenue (USD Million), by Applications (2023-2030)
12 Methodology and Data Sources
12.1 Methodology/Research Approach
12.1.1 Research Programs/Design
12.1.2 Market Size Estimation
12.1.3 Market Breakdown and Data Triangulation
12.2 Data Sources
12.2.1 Secondary Sources
12.2.2 Primary Sources
12.3 Disclaimer
List of Tables
Table 1 Market Segmentation Analysis
Table 2 Global Premium Gin Market Companies with Areas Served
Table 3 Products Offerings Global Premium Gin Market
Table 4 Low Growth Scenario Forecasts
Table 5 Reference Case Growth Scenario
Table 6 High Growth Case Scenario
Table 7 Global Premium Gin Revenue (USD Million) And CAGR (%) By Type (2018-2030)
Table 8 Global Premium Gin Revenue (USD Million) And CAGR (%) By Applications (2018-2030)
Table 9 Global Premium Gin Revenue (USD Million) And CAGR (%) By Regions (2018-2030)
Table 10 Global Premium Gin Revenue (USD Million) By Type (2018-2022)
Table 11 Global Premium Gin Revenue Market Share (%) By Type (2018-2022)
Table 12 Global Premium Gin Revenue (USD Million) By Applications (2018-2022)
Table 13 Global Premium Gin Revenue Market Share (%) By Applications (2018-2022)
Table 14 Global Premium Gin Market Revenue (USD Million) By Regions (2018-2022)
Table 15 Global Premium Gin Market Share (%) By Regions (2018-2022)
Table 16 North America Premium Gin Revenue (USD Million) By Country (2018-2022)
Table 17 North America Premium Gin Revenue (USD Million) By Type (2018-2022)
Table 18 North America Premium Gin Revenue (USD Million) By Applications (2018-2022)
Table 19 Europe Premium Gin Revenue (USD Million) By Country (2018-2022)
Table 20 Europe Premium Gin Revenue (USD Million) By Type (2018-2022)
Table 21 Europe Premium Gin Revenue (USD Million) By Applications (2018-2022)
Table 22 Asia Pacific Premium Gin Revenue (USD Million) By Country (2018-2022)
Table 23 Asia Pacific Premium Gin Revenue (USD Million) By Type (2018-2022)
Table 24 Asia Pacific Premium Gin Revenue (USD Million) By Applications (2018-2022)
Table 25 South America Premium Gin Revenue (USD Million) By Country (2018-2022)
Table 26 South America Premium Gin Revenue (USD Million) By Type (2018-2022)
Table 27 South America Premium Gin Revenue (USD Million) By Applications (2018-2022)
Table 28 Middle East and Africa Premium Gin Revenue (USD Million) By Region (2018-2022)
Table 29 Middle East and Africa Premium Gin Revenue (USD Million) By Type (2018-2022)
Table 30 Middle East and Africa Premium Gin Revenue (USD Million) By Applications (2018-2022)
Table 31 Financial Analysis
Table 32 Global Premium Gin Revenue (USD Million) By Type (2023-2030)
Table 33 Global Premium Gin Revenue Market Share (%) By Type (2023-2030)
Table 34 Global Premium Gin Revenue (USD Million) By Applications (2023-2030)
Table 35 Global Premium Gin Revenue Market Share (%) By Applications (2023-2030)
Table 36 Global Premium Gin Market Revenue (USD Million), And Revenue (USD Million) By Regions (2023-2030)
Table 37 North America Premium Gin Revenue (USD)By Country (2023-2030)
Table 38 North America Premium Gin Revenue (USD Million) By Type (2023-2030)
Table 39 North America Premium Gin Revenue (USD Million) By Applications (2023-2030)
Table 40 Europe Premium Gin Revenue (USD Million) By Country (2023-2030)
Table 41 Europe Premium Gin Revenue (USD Million) By Type (2023-2030)
Table 42 Europe Premium Gin Revenue (USD Million) By Applications (2023-2030)
Table 43 Asia Pacific Premium Gin Revenue (USD Million) By Country (2023-2030)
Table 44 Asia Pacific Premium Gin Revenue (USD Million) By Type (2023-2030)
Table 45 Asia Pacific Premium Gin Revenue (USD Million) By Applications (2023-2030)
Table 46 South America Premium Gin Revenue (USD Million) By Country (2023-2030)
Table 47 South America Premium Gin Revenue (USD Million) By Type (2023-2030)
Table 48 South America Premium Gin Revenue (USD Million) By Applications (2023-2030)
Table 49 Middle East and Africa Premium Gin Revenue (USD Million) By Region (2023-2030)
Table 50 Middle East and Africa Premium Gin Revenue (USD Million) By Region (2023-2030)
Table 51 Middle East and Africa Premium Gin Revenue (USD Million) By Type (2023-2030)
Table 52 Middle East and Africa Premium Gin Revenue (USD Million) By Applications (2023-2030)
Table 53 Research Programs/Design for This Report
Table 54 Key Data Information from Secondary Sources
Table 55 Key Data Information from Primary Sources
List of Figures
Figure 1 Market Scope
Figure 2 Porter’s Five Forces
Figure 3 Global Premium Gin Revenue (USD Million) By Type (2018-2022)
Figure 4 Global Premium Gin Revenue Market Share (%) By Type (2022)
Figure 5 Global Premium Gin Revenue (USD Million) By Applications (2018-2022)
Figure 6 Global Premium Gin Revenue Market Share (%) By Applications (2022)
Figure 7 Global Premium Gin Market Revenue (USD Million) By Regions (2018-2022)
Figure 8 Global Premium Gin Market Share (%) By Regions (2022)
Figure 9 North America Premium Gin Revenue (USD Million) By Country (2018-2022)
Figure 10 North America Premium Gin Revenue (USD Million) By Type (2018-2022)
Figure 11 North America Premium Gin Revenue (USD Million) By Applications (2018-2022)
Figure 12 Europe Premium Gin Revenue (USD Million) By Country (2018-2022)
Figure 13 Europe Premium Gin Revenue (USD Million) By Type (2018-2022)
Figure 14 Europe Premium Gin Revenue (USD Million) By Applications (2018-2022)
Figure 15 Asia Pacific Premium Gin Revenue (USD Million) By Country (2018-2022)
Figure 16 Asia Pacific Premium Gin Revenue (USD Million) By Type (2018-2022)
Figure 17 Asia Pacific Premium Gin Revenue (USD Million) By Applications (2018-2022)
Figure 18 South America Premium Gin Revenue (USD Million) By Country (2018-2022)
Figure 19 South America Premium Gin Revenue (USD Million) By Type (2018-2022)
Figure 20 South America Premium Gin Revenue (USD Million) By Applications (2018-2022)
Figure 21 Middle East and Africa Premium Gin Revenue (USD Million) By Region (2018-2022)
Figure 22 Middle East and Africa Premium Gin Revenue (USD Million) By Type (2018-2022)
Figure 23 Middle East and Africa Premium Gin Revenue (USD Million) By Applications (2018-2022)
Figure 24 Global Premium Gin Revenue (USD Million) By Type (2023-2030)
Figure 25 Global Premium Gin Revenue Market Share (%) By Type (2030)
Figure 26 Global Premium Gin Revenue (USD Million) By Applications (2023-2030)
Figure 27 Global Premium Gin Revenue Market Share (%) By Applications (2030)
Figure 28 Global Premium Gin Market Revenue (USD Million) By Regions (2023-2030)
Figure 29 North America Premium Gin Revenue (USD Million) By Country (2023-2030)
Figure 30 North America Premium Gin Revenue (USD Million) By Type (2023-2030)
Figure 31 North America Premium Gin Revenue (USD Million) By Applications (2023-2030)
Figure 32 Europe Premium Gin Revenue (USD Million) By Country (2023-2030)
Figure 33 Europe Premium Gin Revenue (USD Million) By Type (2023-2030)
Figure 34 Europe Premium Gin Revenue (USD Million) By Applications (2023-2030)
Figure 35 Asia Pacific Premium Gin Revenue (USD Million) By Country (2023-2030)
Figure 36 Asia Pacific Premium Gin Revenue (USD Million) By Type (2023-2030)
Figure 37 Asia Pacific Premium Gin Revenue (USD Million) By Applications (2023-2030)
Figure 38 South America Premium Gin Revenue (USD Million) By Country (2023-2030)
Figure 39 South America Premium Gin Revenue (USD Million) By Type (2023-2030)
Figure 40 South America Premium Gin Revenue (USD Million) By Applications (2023-2030)
Figure 41 Middle East and Africa Premium Gin Revenue (USD Million) By Region (2023-2030)
Figure 42 Middle East and Africa Premium Gin Revenue (USD Million) By Region (2023-2030)
Figure 43 Middle East and Africa Premium Gin Revenue (USD Million) By Type (2023-2030)
Figure 44 Middle East and Africa Premium Gin Revenue (USD Million) By Applications (2023-2030)
Figure 45 Bottom-Up and Top-Down Approaches for This Report
Figure 46 Data Triangulation
