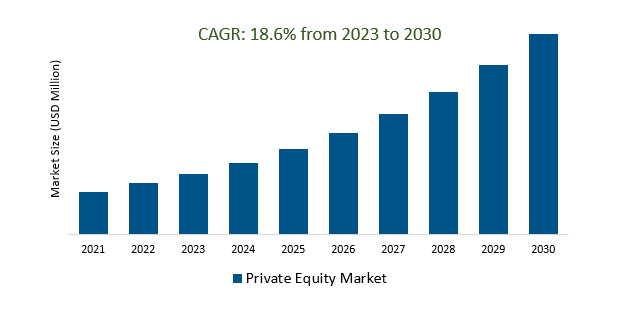
The Global Private Equity Market Size is estimated to register 18.6% growth over the forecast period from 2023 to 2030.
The market growth is driven by increasing Changes in regulations and tax policies that could significantly impact the private equity market, especially in terms of fundraising, compliance, and deal structuring. Leading Companies focusing on Technology and Innovation, ESG Integration, Healthcare and Life Sciences, Emerging Markets, Education and EdTech, Regulatory Changes, and others to boost market shares in the industry.
Market Overview
The private equity market involves investment firms (GPs) raising funds from institutional and individual investors (LPs) to invest in privately held companies. GPs actively work with portfolio companies, aiming to drive growth and operational efficiency. Investments are typically illiquid and require a multi-year holding period. Exit strategies include selling portfolio companies, conducting IPOs, or recapitalization. While it offers higher returns, it carries greater risk and regulatory considerations, with performance dependent on the alignment of interests between GPs and LPs and the economic cycle.
Market Dynamics
Market Trends- Increased fundraising in the private equity market is being driven by a number of factors, including strong investor demand, low-interest rates, and the availability of dry powder.
The private equity market has seen a surge in fundraising, driven by strong investor demand, low interest rates, and the presence of significant dry powder. Investors, in search of higher returns and diversification, are increasingly turning to private equity to achieve potentially superior results. This influx of capital, combined with a growing appetite for alternative assets, has spurred the private equity industry's growth, intensifying competition among firms eager to invest in promising opportunities.
Market Driver- Investors are increasingly demanding that private equity firms integrate environmental, social, and governance (ESG) factors into their investment decisions and portfolio management.
Investors are increasingly pressuring private equity firms to incorporate environmental, social, and governance (ESG) considerations into their investment strategies, reflecting a broader shift toward responsible and sustainable investing. This demands a fundamental transformation in how investments are evaluated and managed in the private equity market, requiring firms to align their actions with principles promoting environmental sustainability, social responsibility, and good governance alongside seeking financial returns.
Market Opportunity- - The private equity market is consolidating, with a small number of large firms increasingly dominating the market.
The private equity market is undergoing a consolidation phase, where a diminishing number of major firms are gaining significant dominance within the industry. This trend points to the increasing concentration of power and resources among a select few private equity players. These large firms are often in a better position to raise substantial amounts of capital, make sizable investments, and leverage their expertise to secure competitive advantages. This consolidation underscores the competitive dynamics in the private equity space, with smaller players finding it challenging to compete with the scale and resources of the industry's leading firms.
Market Share Analysis- The buyout Private Equity Market will register the fastest growth
The Global Private Equity Market is analyzed across Buyout, Venture Capital (VCs), Real Estate, Infrastructure, and Others. The buyout is poised to register the fastest growth. The buyout private equity market specializes in acquiring established companies, often with the goal of improving their operations and eventually selling them at a profit. It includes various transaction types like leveraged buyouts and management buyouts and plays a significant role in corporate finance and value creation across diverse industries.
Market Share Analysis- Technology (software) held a significant market share in 2023
The Global Private Equity Market is analyzed across various Organizations including Technology (Software), Healthcare, Real Estate and Services, Financial Services, Industrials, Consumer and Retail, Energy and power, Media and entertainment, Telecom, and others. Of these, technology (software) held a significant market share in 2023. The technology private equity market, particularly in software companies, involves private equity firms investing in software firms of various sizes to foster growth, innovation, and profitability. This entails providing capital and expertise to help these companies expand their product offerings, enter new markets, and enhance operational efficiency. The sector covers a broad range of software segments, from enterprise software to cybersecurity and fintech, reflecting the ongoing evolution and disruption of technology in various industries.
Private Equity Market Segmentation
By Fund Type
- Buyout
- Venture Capital (VCs)
- Real Estate
- Infrastructure
- Others
By Sector
- Technology (Software)
- Healthcare
- Real Estate and Services
- Financial Services
- Industrials
- Consumer & Retail
- Energy & Power
- Media & Entertainment
- Telecom
- Others
By Investments
- Large Cap
- Upper Middle Market
- Lower Middle Market
- Real Estate
By Region
- North America (United States, Canada, Mexico)
- Europe (Germany, France, United Kingdom, Spain, Italy, Others)
- Asia Pacific (China, India, Japan, South Korea, Australia, Others)
- Latin America (Brazil, Argentina, Others)
- Middle East and Africa (Saudi Arabia, UAE, Kuwait, Other Middle East, South Africa, Nigeria, Other Africa)
Private Equity Market Companies
- Blackstone (United States)
- Carlyle (United States)
- Warburg Pincus (United States)
- CVC Capital Partners (Luxembourg)
- Advent International (United States)
- EnCap Investments (United States)
- KKR (United States)
- Neuberger Berman (United States)
- TPG Capital (United States)
- Apollo Global Management (United States)
*List not exhaustive
Private Equity Market Outlook 2023
1 Market Overview
1.1 Introduction to the Private Equity Market
1.2 Scope of the Study
1.3 Research Objective
1.3.1 Key Market Scope and Segments
1.3.2 Players Covered
1.3.3 Years Considered
2 Executive Summary
2.1 2023 Private Equity Industry- Market Statistics
3 Market Dynamics
3.1 Market Drivers
3.2 Market Challenges
3.3 Market Opportunities
3.4 Market Trends
4 Market Factor Analysis
4.1 Porter’s Five Forces
4.2 Market Entropy
4.2.1 Global Private Equity Market Companies with Area Served
4.2.2 Products Offerings Global Private Equity Market
5 COVID-19 Impact Analysis and Outlook Scenarios
5.1.1 Covid-19 Impact Analysis
5.1.2 Post-COVID-19 Scenario- Low Growth Case
5.1.3 Post-COVID-19 Scenario- Reference Growth Case
5.1.4 Post-COVID-19 Scenario- Low Growth Case
6 Global Private Equity Market Trends
6.1 Global Private Equity Revenue (USD Million) and CAGR (%) by Type (2018-2030)
6.2 Global Private Equity Revenue (USD Million) and CAGR (%) by Applications (2018-2030)
6.3 Global Private Equity Revenue (USD Million) and CAGR (%) by Regions (2018-2030)
7 Global Private Equity Market Revenue (USD Million) by Type, and Applications (2018-2022)
7.1 Global Private Equity Revenue (USD Million) by Type (2018-2022)
7.1.1 Global Private Equity Revenue (USD Million), Market Share (%) by Type (2018-2022)
7.2 Global Private Equity Revenue (USD Million) by Applications (2018-2022)
7.2.1 Global Private Equity Revenue (USD Million), Market Share (%) by Applications (2018-2022)
8 Global Private Equity Development Regional Status and Outlook
8.1 Global Private Equity Revenue (USD Million) By Regions (2018-2022)
8.2 North America Private Equity Revenue (USD Million) by Type, and Application (2018-2022)
8.2.1 North America Private Equity Revenue (USD Million) by Country (2018-2022)
8.2.2 North America Private Equity Revenue (USD Million) by Type (2018-2022)
8.2.3 North America Private Equity Revenue (USD Million) by Applications (2018-2022)
8.3 Europe Private Equity Revenue (USD Million), by Type, and Applications (USD Million) (2018-2022)
8.3.1 Europe Private Equity Revenue (USD Million), by Country (2018-2022)
8.3.2 Europe Private Equity Revenue (USD Million) by Type (2018-2022)
8.3.3 Europe Private Equity Revenue (USD Million) by Applications (2018-2022)
8.4 Asia Pacific Private Equity Revenue (USD Million), and Revenue (USD Million) by Type, and Applications (2018-2022)
8.4.1 Asia Pacific Private Equity Revenue (USD Million) by Country (2018-2022)
8.4.2 Asia Pacific Private Equity Revenue (USD Million) by Type (2018-2022)
8.4.3 Asia Pacific Private Equity Revenue (USD Million) by Applications (2018-2022)
8.5 South America Private Equity Revenue (USD Million), by Type, and Applications (2018-2022)
8.5.1 South America Private Equity Revenue (USD Million), by Country (2018-2022)
8.5.2 South America Private Equity Revenue (USD Million) by Type (2018-2022)
8.5.3 South America Private Equity Revenue (USD Million) by Applications (2018-2022)
8.6 Middle East and Africa Private Equity Revenue (USD Million), by Type, Technology, Application, Thickness (2018-2022)
8.6.1 Middle East and Africa Private Equity Revenue (USD Million) by Country (2018-2022)
8.6.2 Middle East and Africa Private Equity Revenue (USD Million) by Type (2018-2022)
8.6.3 Middle East and Africa Private Equity Revenue (USD Million) by Applications (2018-2022)
9 Company Profiles
10 Global Private Equity Market Revenue (USD Million), by Type, and Applications (2023-2030)
10.1 Global Private Equity Revenue (USD Million) and Market Share (%) by Type (2023-2030)
10.1.1 Global Private Equity Revenue (USD Million), and Market Share (%) by Type (2023-2030)
10.2 Global Private Equity Revenue (USD Million) and Market Share (%) by Applications (2023-2030)
10.2.1 Global Private Equity Revenue (USD Million), and Market Share (%) by Applications (2023-2030)
11 Global Private Equity Development Regional Status and Outlook Forecast
11.1 Global Private Equity Revenue (USD Million) By Regions (2023-2030)
11.2 North America Private Equity Revenue (USD Million) by Type, and Applications (2023-2030)
11.2.1 North America Private Equity Revenue (USD) Million by Country (2023-2030)
11.2.2 North America Private Equity Revenue (USD Million), by Type (2023-2030)
11.2.3 North America Private Equity Revenue (USD Million), Market Share (%) by Applications (2023-2030)
11.3 Europe Private Equity Revenue (USD Million), by Type, and Applications (2023-2030)
11.3.1 Europe Private Equity Revenue (USD Million), by Country (2023-2030)
11.3.2 Europe Private Equity Revenue (USD Million), by Type (2023-2030)
11.3.3 Europe Private Equity Revenue (USD Million), by Applications (2023-2030)
11.4 Asia Pacific Private Equity Revenue (USD Million) by Type, and Applications (2023-2030)
11.4.1 Asia Pacific Private Equity Revenue (USD Million), by Country (2023-2030)
11.4.2 Asia Pacific Private Equity Revenue (USD Million), by Type (2023-2030)
11.4.3 Asia Pacific Private Equity Revenue (USD Million), by Applications (2023-2030)
11.5 South America Private Equity Revenue (USD Million), by Type, and Applications (2023-2030)
11.5.1 South America Private Equity Revenue (USD Million), by Country (2023-2030)
11.5.2 South America Private Equity Revenue (USD Million), by Type (2023-2030)
11.5.3 South America Private Equity Revenue (USD Million), by Applications (2023-2030)
11.6 Middle East and Africa Private Equity Revenue (USD Million), by Type, and Applications (2023-2030)
11.6.1 Middle East and Africa Private Equity Revenue (USD Million), by Region (2023-2030)
11.6.2 Middle East and Africa Private Equity Revenue (USD Million), by Type (2023-2030)
11.6.3 Middle East and Africa Private Equity Revenue (USD Million), by Applications (2023-2030)
12 Methodology and Data Sources
12.1 Methodology/Research Approach
12.1.1 Research Programs/Design
12.1.2 Market Size Estimation
12.1.3 Market Breakdown and Data Triangulation
12.2 Data Sources
12.2.1 Secondary Sources
12.2.2 Primary Sources
12.3 Disclaimer
List of Tables
Table 1 Market Segmentation Analysis
Table 2 Global Private Equity Market Companies with Areas Served
Table 3 Products Offerings Global Private Equity Market
Table 4 Low Growth Scenario Forecasts
Table 5 Reference Case Growth Scenario
Table 6 High Growth Case Scenario
Table 7 Global Private Equity Revenue (USD Million) And CAGR (%) By Type (2018-2030)
Table 8 Global Private Equity Revenue (USD Million) And CAGR (%) By Applications (2018-2030)
Table 9 Global Private Equity Revenue (USD Million) And CAGR (%) By Regions (2018-2030)
Table 10 Global Private Equity Revenue (USD Million) By Type (2018-2022)
Table 11 Global Private Equity Revenue Market Share (%) By Type (2018-2022)
Table 12 Global Private Equity Revenue (USD Million) By Applications (2018-2022)
Table 13 Global Private Equity Revenue Market Share (%) By Applications (2018-2022)
Table 14 Global Private Equity Market Revenue (USD Million) By Regions (2018-2022)
Table 15 Global Private Equity Market Share (%) By Regions (2018-2022)
Table 16 North America Private Equity Revenue (USD Million) By Country (2018-2022)
Table 17 North America Private Equity Revenue (USD Million) By Type (2018-2022)
Table 18 North America Private Equity Revenue (USD Million) By Applications (2018-2022)
Table 19 Europe Private Equity Revenue (USD Million) By Country (2018-2022)
Table 20 Europe Private Equity Revenue (USD Million) By Type (2018-2022)
Table 21 Europe Private Equity Revenue (USD Million) By Applications (2018-2022)
Table 22 Asia Pacific Private Equity Revenue (USD Million) By Country (2018-2022)
Table 23 Asia Pacific Private Equity Revenue (USD Million) By Type (2018-2022)
Table 24 Asia Pacific Private Equity Revenue (USD Million) By Applications (2018-2022)
Table 25 South America Private Equity Revenue (USD Million) By Country (2018-2022)
Table 26 South America Private Equity Revenue (USD Million) By Type (2018-2022)
Table 27 South America Private Equity Revenue (USD Million) By Applications (2018-2022)
Table 28 Middle East and Africa Private Equity Revenue (USD Million) By Region (2018-2022)
Table 29 Middle East and Africa Private Equity Revenue (USD Million) By Type (2018-2022)
Table 30 Middle East and Africa Private Equity Revenue (USD Million) By Applications (2018-2022)
Table 31 Financial Analysis
Table 32 Global Private Equity Revenue (USD Million) By Type (2023-2030)
Table 33 Global Private Equity Revenue Market Share (%) By Type (2023-2030)
Table 34 Global Private Equity Revenue (USD Million) By Applications (2023-2030)
Table 35 Global Private Equity Revenue Market Share (%) By Applications (2023-2030)
Table 36 Global Private Equity Market Revenue (USD Million), And Revenue (USD Million) By Regions (2023-2030)
Table 37 North America Private Equity Revenue (USD)By Country (2023-2030)
Table 38 North America Private Equity Revenue (USD Million) By Type (2023-2030)
Table 39 North America Private Equity Revenue (USD Million) By Applications (2023-2030)
Table 40 Europe Private Equity Revenue (USD Million) By Country (2023-2030)
Table 41 Europe Private Equity Revenue (USD Million) By Type (2023-2030)
Table 42 Europe Private Equity Revenue (USD Million) By Applications (2023-2030)
Table 43 Asia Pacific Private Equity Revenue (USD Million) By Country (2023-2030)
Table 44 Asia Pacific Private Equity Revenue (USD Million) By Type (2023-2030)
Table 45 Asia Pacific Private Equity Revenue (USD Million) By Applications (2023-2030)
Table 46 South America Private Equity Revenue (USD Million) By Country (2023-2030)
Table 47 South America Private Equity Revenue (USD Million) By Type (2023-2030)
Table 48 South America Private Equity Revenue (USD Million) By Applications (2023-2030)
Table 49 Middle East and Africa Private Equity Revenue (USD Million) By Region (2023-2030)
Table 50 Middle East and Africa Private Equity Revenue (USD Million) By Region (2023-2030)
Table 51 Middle East and Africa Private Equity Revenue (USD Million) By Type (2023-2030)
Table 52 Middle East and Africa Private Equity Revenue (USD Million) By Applications (2023-2030)
Table 53 Research Programs/Design for This Report
Table 54 Key Data Information from Secondary Sources
Table 55 Key Data Information from Primary Sources
List of Figures
Figure 1 Market Scope
Figure 2 Porter’s Five Forces
Figure 3 Global Private Equity Revenue (USD Million) By Type (2018-2022)
Figure 4 Global Private Equity Revenue Market Share (%) By Type (2022)
Figure 5 Global Private Equity Revenue (USD Million) By Applications (2018-2022)
Figure 6 Global Private Equity Revenue Market Share (%) By Applications (2022)
Figure 7 Global Private Equity Market Revenue (USD Million) By Regions (2018-2022)
Figure 8 Global Private Equity Market Share (%) By Regions (2022)
Figure 9 North America Private Equity Revenue (USD Million) By Country (2018-2022)
Figure 10 North America Private Equity Revenue (USD Million) By Type (2018-2022)
Figure 11 North America Private Equity Revenue (USD Million) By Applications (2018-2022)
Figure 12 Europe Private Equity Revenue (USD Million) By Country (2018-2022)
Figure 13 Europe Private Equity Revenue (USD Million) By Type (2018-2022)
Figure 14 Europe Private Equity Revenue (USD Million) By Applications (2018-2022)
Figure 15 Asia Pacific Private Equity Revenue (USD Million) By Country (2018-2022)
Figure 16 Asia Pacific Private Equity Revenue (USD Million) By Type (2018-2022)
Figure 17 Asia Pacific Private Equity Revenue (USD Million) By Applications (2018-2022)
Figure 18 South America Private Equity Revenue (USD Million) By Country (2018-2022)
Figure 19 South America Private Equity Revenue (USD Million) By Type (2018-2022)
Figure 20 South America Private Equity Revenue (USD Million) By Applications (2018-2022)
Figure 21 Middle East and Africa Private Equity Revenue (USD Million) By Region (2018-2022)
Figure 22 Middle East and Africa Private Equity Revenue (USD Million) By Type (2018-2022)
Figure 23 Middle East and Africa Private Equity Revenue (USD Million) By Applications (2018-2022)
Figure 24 Global Private Equity Revenue (USD Million) By Type (2023-2030)
Figure 25 Global Private Equity Revenue Market Share (%) By Type (2030)
Figure 26 Global Private Equity Revenue (USD Million) By Applications (2023-2030)
Figure 27 Global Private Equity Revenue Market Share (%) By Applications (2030)
Figure 28 Global Private Equity Market Revenue (USD Million) By Regions (2023-2030)
Figure 29 North America Private Equity Revenue (USD Million) By Country (2023-2030)
Figure 30 North America Private Equity Revenue (USD Million) By Type (2023-2030)
Figure 31 North America Private Equity Revenue (USD Million) By Applications (2023-2030)
Figure 32 Europe Private Equity Revenue (USD Million) By Country (2023-2030)
Figure 33 Europe Private Equity Revenue (USD Million) By Type (2023-2030)
Figure 34 Europe Private Equity Revenue (USD Million) By Applications (2023-2030)
Figure 35 Asia Pacific Private Equity Revenue (USD Million) By Country (2023-2030)
Figure 36 Asia Pacific Private Equity Revenue (USD Million) By Type (2023-2030)
Figure 37 Asia Pacific Private Equity Revenue (USD Million) By Applications (2023-2030)
Figure 38 South America Private Equity Revenue (USD Million) By Country (2023-2030)
Figure 39 South America Private Equity Revenue (USD Million) By Type (2023-2030)
Figure 40 South America Private Equity Revenue (USD Million) By Applications (2023-2030)
Figure 41 Middle East and Africa Private Equity Revenue (USD Million) By Region (2023-2030)
Figure 42 Middle East and Africa Private Equity Revenue (USD Million) By Region (2023-2030)
Figure 43 Middle East and Africa Private Equity Revenue (USD Million) By Type (2023-2030)
Figure 44 Middle East and Africa Private Equity Revenue (USD Million) By Applications (2023-2030)
Figure 45 Bottom-Up and Top-Down Approaches For This Report
Figure 46 Data Triangulation
