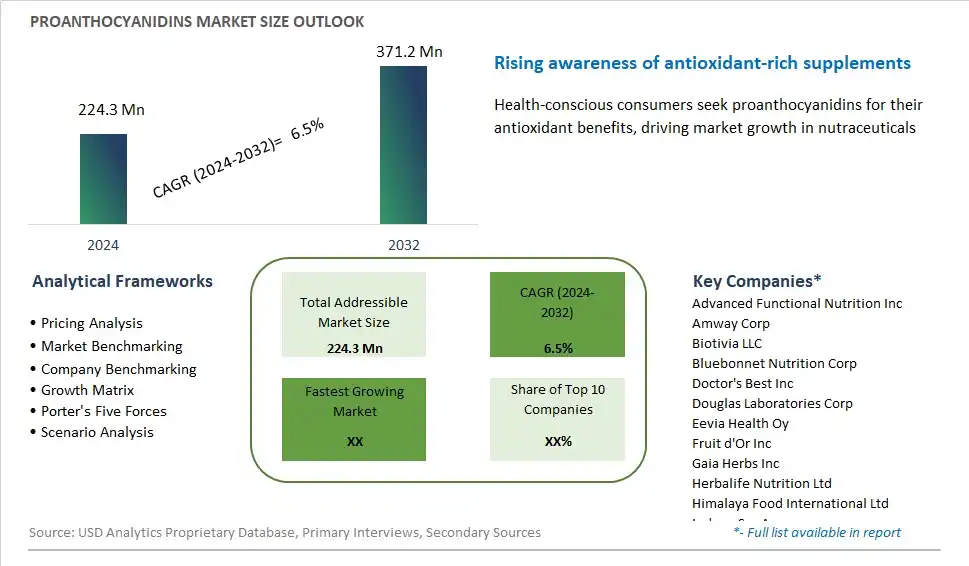
Global Proanthocyanidins Market Size is valued at $224.3 Million in 2024 and is forecast to register a growth rate (CAGR) of 6.5% to reach $371.2 Million by 2032.
The global Proanthocyanidins Market Comprehensive Study analyzes and forecasts the market size across 6 regions and 24 countries for diverse segments -By Source (Cranberry, Grape Seed, Pine Bark, Others), By Application (Pharmaceuticals & Dietary Supplements, Personal Care & Cosmetics, Functional Food & Beverages), By Type (Type A, Type B)
An Introduction to Proanthocyanidins Market
Proanthocyanidins, also known as condensed tannins, are polyphenolic compounds found in various plant-based foods such as grapes, berries, cocoa, and nuts, known for their antioxidant and health-promoting properties in 2024. Proanthocyanidins are composed of flavan-3-ol units linked together through carbon-carbon bonds, giving them strong antioxidant activity and potential health benefits such as cardiovascular protection, anti-inflammatory effects, and cognitive support. These compounds are commonly found in foods such as red wine, dark chocolate, and certain fruits, as well as in dietary supplements derived from grape seed extract or pine bark extract. With increasing consumer interest in natural antioxidants and functional foods, the market for proanthocyanidins is growing, driven by innovations in extraction technology, formulation techniques, and product applications that harness the health benefits of these bioactive compounds to meet consumer demands for natural, clean label ingredients that promote health and wellness.
Proanthocyanidins Competitive Landscape
The market report analyses the leading companies in the industry including Advanced Functional Nutrition Inc, Amway Corp, Biotivia LLC, Bluebonnet Nutrition Corp, Doctor's Best Inc, Douglas Laboratories Corp, Eevia Health Oy, Fruit d'Or Inc, Gaia Herbs Inc, Herbalife Nutrition Ltd, Himalaya Food International Ltd, Indena S.p.A., Jarrow Formulas Inc, Life Extension, Natac Group, Natrol LLC, Nature's Way Ltd, Naturex SA, Nexira SAS, NOW Foods Private Ltd, Nutramax Laboratories Private Ltd, Ocean Spray Cranberries Inc, Puritan's Pride Inc, Reserveage Organics, Skin Actives Scientific LLC, Solgar Vitamin & Herb Company Inc, Source Naturals Inc, Swanson Group, Terry Naturally, Xian Yuensun Biological Technology Co. Ltd, and Others.
Proanthocyanidins Market Dynamics
Proanthocyanidins Market Trend: Growing Demand for Natural Antioxidants and Health Supplements
One prominent market trend in proanthocyanidins is the growing demand for natural antioxidants and health supplements derived from plant-based sources. As consumers become increasingly health-conscious and seek alternatives to synthetic additives and supplements, there's a rising interest in proanthocyanidins due to their potent antioxidant properties and potential health benefits. Proanthocyanidins, found abundantly in fruits, vegetables, nuts, seeds, and other plant sources, have been associated with various health-promoting effects, including cardiovascular health, cognitive function, and skin protection. This trend is driven by the growing awareness of the role of antioxidants in preventing oxidative stress, inflammation, and chronic diseases, as well as the preference for natural, plant-derived ingredients with perceived safety and efficacy.
Market Driver: Research and Scientific Validation of Health Benefits
A key driver propelling the market for proanthocyanidins is the increasing research and scientific validation of their health benefits and therapeutic properties. Over the years, numerous studies have explored the biological activities and potential applications of proanthocyanidins in promoting human health and well-being. Scientific evidence suggests that proanthocyanidins possess antioxidant, anti-inflammatory, anti-cancer, and antimicrobial properties, making them promising candidates for use in dietary supplements, functional foods, and pharmaceutical formulations. Additionally, clinical trials and epidemiological studies have provided insights into the mechanisms of action and physiological effects of proanthocyanidins, further supporting their role in disease prevention and management. As scientific understanding of proanthocyanidins continues to advance, fueled by ongoing research and innovation, the market for proanthocyanidin-based products is expected to expand, driven by the demand for evidence-based solutions for health and wellness.
Market Opportunity: Development of Innovative Formulations and Delivery Systems
An opportunity within the proanthocyanidins market lies in the development of innovative formulations and delivery systems to enhance bioavailability, efficacy, and consumer acceptance of proanthocyanidin-rich products. While proanthocyanidins offer promising health benefits, their bioavailability and absorption can be influenced by factors such as molecular structure, dosage form, and matrix interactions. Manufacturers can capitalize on this opportunity by exploring novel formulation approaches such as nanoencapsulation, microencapsulation, and complexation techniques to improve the stability and bioavailability of proanthocyanidins. Additionally, there's potential to develop targeted delivery systems that enable controlled release and tissue-specific targeting of proanthocyanidins, optimizing their therapeutic effects and minimizing potential side effects. Moreover, there's an opportunity to incorporate proanthocyanidins into innovative product formats such as gummies, beverages, and skincare products to appeal to a wider range of consumers and market segments. By leveraging innovative formulation and delivery technologies, manufacturers can unlock the full potential of proanthocyanidins and create differentiated products that meet the evolving needs and preferences of health-conscious consumers.
Proanthocyanidins Market Share Analysis: Grape Seed held the dominant market share in 2024
Grape seed proanthocyanidins represent the largest segment in the proanthocyanidins market, driven by their extensive health benefits and widespread application across various industries. Grape seed extract is renowned for its potent antioxidant properties, which contribute to cardiovascular health, anti-aging effects, and improved skin health. These benefits have fueled its popularity in the dietary supplements, functional foods, and cosmetics sectors. The high content of oligomeric proanthocyanidins (OPCs) in grape seeds is particularly effective in neutralizing free radicals, reducing inflammation, and enhancing blood circulation. Furthermore, grape seed extract is supported by substantial scientific research, reinforcing its efficacy and safety, which boosts consumer confidence and demand. The wine industry's byproduct utilization for extracting grape seeds has also provided a sustainable and cost-effective source, further driving the segment's growth. As consumers increasingly seek natural and effective health solutions, the demand for grape seed proanthocyanidins is expected to continue its upward trajectory, solidifying its position as the largest and most dynamic segment in the proanthocyanidins market.
Proanthocyanidins Market Share Analysis: Pharmaceuticals & Dietary Supplements market is poised to register the fastest growth rae over the forecast period to 2032
The pharmaceuticals and dietary supplements segment is the fastest-growing application in the proanthocyanidins market. This rapid growth is driven by the increasing consumer awareness of the health benefits associated with proanthocyanidins, particularly their strong antioxidant properties that support cardiovascular health, immune function, and overall wellness. The rising prevalence of chronic diseases and the growing interest in preventive healthcare have led to a surge in demand for natural health supplements. Proanthocyanidins, derived from sources like grape seed and cranberry, are being increasingly incorporated into dietary supplements due to their efficacy in reducing oxidative stress and inflammation. Additionally, the pharmaceutical industry's focus on developing natural and effective treatments has further boosted the segment's growth. The stringent regulatory approvals for proanthocyanidin-based supplements, backed by scientific research and clinical trials, enhance consumer trust and adoption. Furthermore, the aging population's need for nutraceuticals to maintain health and vitality has significantly contributed to the expansion of this segment. With ongoing research and development, new formulations and applications of proanthocyanidins are continually emerging, ensuring sustained growth and innovation in the pharmaceuticals and dietary supplements market.
Proanthocyanidins Market Share Analysis: Type B held the dominant market share in 2024
Type B proanthocyanidins dominate the proanthocyanidins market due to their wide-ranging applications and superior bioavailability. Type B proanthocyanidins are predominantly found in sources such as grape seed and pine bark extract and are known for their potent antioxidant properties, which contribute to cardiovascular health, skin protection, and cognitive function. These proanthocyanidins possess a higher molecular weight compared to Type A, resulting in increased stability and bioavailability in the human body. Their ability to scavenge free radicals and reduce oxidative stress has made them popular ingredients in dietary supplements, functional foods, and personal care products. Additionally, Type B proanthocyanidins exhibit anti-inflammatory and antimicrobial properties, further expanding their utility in pharmaceuticals and topical applications. The well-established efficacy and safety profile of Type B proanthocyanidins, supported by extensive scientific research, have solidified their position as the largest segment in the proanthocyanidins market, driving continuous demand and innovation in product development.
Proanthocyanidins Market Segmentation
By Source
Cranberry
Grape Seed
Pine Bark
Others
By Application
Pharmaceuticals & Dietary Supplements
Personal Care & Cosmetics
Functional Food & Beverages
By Type
Type A
Type B
Countries Analyzed
North America (US, Canada, Mexico)
Europe (Germany, UK, France, Spain, Italy, Russia, Rest of Europe)
Asia Pacific (China, India, Japan, South Korea, Australia, South East Asia, Rest of Asia)
South America (Brazil, Argentina, Rest of South America)
Middle East and Africa (Saudi Arabia, UAE, Rest of Middle East, South Africa, Egypt, Rest of Africa)
Proanthocyanidins Companies Profiled in the Study
Advanced Functional Nutrition Inc
Amway Corp
Biotivia LLC
Bluebonnet Nutrition Corp
Doctor's Best Inc
Douglas Laboratories Corp
Eevia Health Oy
Fruit d'Or Inc
Gaia Herbs Inc
Herbalife Nutrition Ltd
Himalaya Food International Ltd
Indena S.p.A.
Jarrow Formulas Inc
Life Extension
Natac Group
Natrol LLC
Nature's Way Ltd
Naturex SA
Nexira SAS
NOW Foods Private Ltd
Nutramax Laboratories Private Ltd
Ocean Spray Cranberries Inc
Puritan's Pride Inc
Reserveage Organics
Skin Actives Scientific LLC
Solgar Vitamin & Herb Company Inc
Source Naturals Inc
Swanson Group
Terry Naturally
Xian Yuensun Biological Technology Co. Ltd
*- List Not Exhaustive
Chapter 1. TABLE OF CONTENTS
Chapter 2. Introduction to Proanthocyanidins Market
2.1. Market Overview
2.2. Key Statistics and Report Highlights
2.3. Scope of the Comprehensive Study
2.3.1. Market Definition
2.3.2 Countries and Regions Covered
2.3.3 Research Objective
2.3.4 Units, Currency, and Conversions
2.3.5 Industry Value Chain
2.4. Key Market Segments
2.5. Key Companies
2.6. Study Period
Chapter 3. Strategic Analysis Review
3.1. Proanthocyanidins Pricing Analysis and Forecast
3.2. Porter’s Five Forces
3.3. Market Ecosystem
3.4. SWOT Analysis
3.5. Regulatory Scenario
3.3. Effects of Inflation, Russia-Ukraine War, moderating economic growth, and other macroeconomic factors
Chapter 4. Competitive Landscape
4.1. Market Share Analysis
4.1.1. Global Proanthocyanidins Market Share by Company, 2023
4.1.2. Product Offerings of Leading Proanthocyanidins Companies
4.2. Market Entropy
4.2.1. New Product Launches in the Industry
4.2.2. Mergers, Acquisitions, Joint ventures, and Partnerships
4.3. Key Strategies and Best Practices
Chapter 5. Global Market Projections: Best, Reference, and Low Case Scenarios
5.1. Growth Analysis- Case Scenario Definitions
5.2. Low Growth Case Scenario Forecasts
5.3. Reference Growth Case Scenario Forecasts
5.4. High Growth Case Scenario Forecasts
Chapter 6. Market Dynamics
6.1. Proanthocyanidins Market Drivers
6.2. Proanthocyanidins Market Challenges
6.6. Proanthocyanidins Market Opportunities
6.4. Proanthocyanidins Market Trends
Chapter 7. Global Proanthocyanidins Market Outlook Trends
7.1. Global Proanthocyanidins Revenue (USD Million) and CAGR (%) by Type (2021-2032)
7.2. Global Proanthocyanidins Revenue (USD Million) and CAGR (%) by Application (2021-2032)
7.3. Global Proanthocyanidins Revenue (USD Million) and CAGR (%) by Product (2021-2032)
By Source
Cranberry
Grape Seed
Pine Bark
Others
By Application
Pharmaceuticals & Dietary Supplements
Personal Care & Cosmetics
Functional Food & Beverages
By Type
Type A
Type B
Chapter 8. Global Proanthocyanidins Regional Analysis and Outlook
8.1. Global Proanthocyanidins Revenue (USD Million) By Regions (2021- 2032)
8.2. North America Proanthocyanidins Revenue (USD Million) by Country (2021-2032)
8.2.1. United States Proanthocyanidins Regional Analysis and Outlook
8.2.2. Canada Proanthocyanidins Regional Analysis and Outlook
8.2.3. Mexico Proanthocyanidins Regional Analysis and Outlook
8.3. Europe Proanthocyanidins Revenue (USD Million), by Country (2021-2032)
8.3.1. Germany Proanthocyanidins Regional Analysis and Outlook
8.3.2. France Proanthocyanidins Regional Analysis and Outlook
8.3.3. United Kingdom Proanthocyanidins Regional Analysis and Outlook
8.3.4. Spain Proanthocyanidins Regional Analysis and Outlook
8.3.5. Italy Proanthocyanidins Regional Analysis and Outlook
8.3.6. Russia Proanthocyanidins Regional Analysis and Outlook
8.3.7. Rest of Europe Proanthocyanidins Regional Analysis and Outlook
8.4. Asia Pacific Proanthocyanidins Revenue (USD Million) by Country (2021-2032)
8.4.1. China Proanthocyanidins Regional Analysis and Outlook
8.4.2. Japan Proanthocyanidins Regional Analysis and Outlook
8.4.3. India Proanthocyanidins Regional Analysis and Outlook
8.4.4. South Korea Proanthocyanidins Regional Analysis and Outlook
8.4.5. Australia Proanthocyanidins Regional Analysis and Outlook
8.4.6. South East Asia Proanthocyanidins Regional Analysis and Outlook
8.4.7. Rest of Asia Pacific Proanthocyanidins Regional Analysis and Outlook
8.5. South America Proanthocyanidins Revenue (USD Million), by Country (2021-2032)
8.5.1. Brazil Proanthocyanidins Regional Analysis and Outlook
8.5.2. Argentina Proanthocyanidins Regional Analysis and Outlook
8.5.3. Rest of South America Proanthocyanidins Regional Analysis and Outlook
8.6. Middle East and Africa Proanthocyanidins Revenue (USD Million) by Country (2021-2032)
8.6.1. Middle East Proanthocyanidins Regional Analysis and Outlook
8.6.2. Africa Proanthocyanidins Regional Analysis and Outlook
Chapter 9. North America Proanthocyanidins Analysis and Outlook
9.1. North America Proanthocyanidins Revenue (USD Million) by Segments (2021-2032)
9.1.1. North America Proanthocyanidins Revenue (USD Million) by Type (2021-2032)
9.1.2. North America Proanthocyanidins Revenue (USD Million) by Application (2021-2032)
9.1.3. North America Proanthocyanidins Revenue (USD Million) by Product (2021-2032)
By Source
Cranberry
Grape Seed
Pine Bark
Others
By Application
Pharmaceuticals & Dietary Supplements
Personal Care & Cosmetics
Functional Food & Beverages
By Type
Type A
Type B
Chapter 10. Europe Proanthocyanidins Analysis and Outlook
10.1. Europe Proanthocyanidins Revenue (USD Million), by Segments (USD Million) (2021-2032)
10.1.1. Europe Proanthocyanidins Revenue (USD Million) by Type (2021-2032)
10.1.2. Europe Proanthocyanidins Revenue (USD Million) by Application (2021-2032)
10.1.3. Europe Proanthocyanidins Revenue (USD Million) by Product (2021-2032)
By Source
Cranberry
Grape Seed
Pine Bark
Others
By Application
Pharmaceuticals & Dietary Supplements
Personal Care & Cosmetics
Functional Food & Beverages
By Type
Type A
Type B
Chapter 11. Asia Pacific Proanthocyanidins Analysis and Outlook
11.1. Asia Pacific Proanthocyanidins Revenue (USD Million), and Revenue (USD Million) by Segments (2021-2032)
11.1.1. Asia Pacific Proanthocyanidins Revenue (USD Million) by Type (2021-2032)
11.1.2. Asia Pacific Proanthocyanidins Revenue (USD Million) by Application (2021-2032)
11.1.3. Asia Pacific Proanthocyanidins Revenue (USD Million) by Product (2021-2032)
By Source
Cranberry
Grape Seed
Pine Bark
Others
By Application
Pharmaceuticals & Dietary Supplements
Personal Care & Cosmetics
Functional Food & Beverages
By Type
Type A
Type B
Chapter 12. South America Proanthocyanidins Analysis and Outlook
12.1. South America Proanthocyanidins Revenue (USD Million), by Segments (2021-2032)
12.1.1. South America Proanthocyanidins Revenue (USD Million) by Type (2021-2032)
12.1.2. South America Proanthocyanidins Revenue (USD Million) by Application (2021-2032)
12.1.3. South America Proanthocyanidins Revenue (USD Million) by Product (2021-2032)
By Source
Cranberry
Grape Seed
Pine Bark
Others
By Application
Pharmaceuticals & Dietary Supplements
Personal Care & Cosmetics
Functional Food & Beverages
By Type
Type A
Type B
Chapter 13. Middle East and Africa Proanthocyanidins Analysis and Outlook
13.1. Middle East and Africa Proanthocyanidins Revenue (USD Million), by Segments (2021-2032)
13.1.1. Middle East and Africa Proanthocyanidins Revenue (USD Million) by Type (2021-2032)
13.1.2. Middle East and Africa Proanthocyanidins Revenue (USD Million) by Application (2021-2032)
13.1.3. Middle East and Africa Proanthocyanidins Revenue (USD Million) by Product (2021-2032)
By Source
Cranberry
Grape Seed
Pine Bark
Others
By Application
Pharmaceuticals & Dietary Supplements
Personal Care & Cosmetics
Functional Food & Beverages
By Type
Type A
Type B
Chapter 14. Proanthocyanidins Company Profiles
14.1 Business Overview
14.2 Product Profiles
14.3 SWOT Profiles
14.5 Recent Developments
14.6 Financial Profile
List of Companies
Advanced Functional Nutrition Inc
Amway Corp
Biotivia LLC
Bluebonnet Nutrition Corp
Doctor's Best Inc
Douglas Laboratories Corp
Eevia Health Oy
Fruit d'Or Inc
Gaia Herbs Inc
Herbalife Nutrition Ltd
Himalaya Food International Ltd
Indena S.p.A.
Jarrow Formulas Inc
Life Extension
Natac Group
Natrol LLC
Nature's Way Ltd
Naturex SA
Nexira SAS
NOW Foods Private Ltd
Nutramax Laboratories Private Ltd
Ocean Spray Cranberries Inc
Puritan's Pride Inc
Reserveage Organics
Skin Actives Scientific LLC
Solgar Vitamin & Herb Company Inc
Source Naturals Inc
Swanson Group
Terry Naturally
Xian Yuensun Biological Technology Co. Ltd
15. Methodology and Data Sources
15.1 Customization Offerings
15.2 Subscription Services
15.3 Related Reports
15.4 Publisher Expertise
LIST OF TABLES
Table 1 Market Segmentation Analysis
Table 2 Global Proanthocyanidins Market Share of Leading Companies, 2023
Table 3 Product Offerings of Leading Companies
Table 4 Low Growth Scenario Forecasts
Table 5 Reference Case Growth Scenario
Table 6 High Growth Case Scenario
Table 7 Global Proanthocyanidins Revenue (USD Million) And CAGR (%) By Type (2021-2032)
Table 8 Global Proanthocyanidins Revenue (USD Million) And CAGR (%) By Application (2021-2032)
Table 9 Global Proanthocyanidins Revenue (USD Million) And CAGR (%) By Product (2021-2032)
Table 10 Global Proanthocyanidins Market Revenue (USD Million) By Regions (2021-2032)
Table 11 Global Proanthocyanidins Market Share (%) By Regions (2021-2032)
Table 12 North America Proanthocyanidins Revenue (USD Million) By Country (2021-2032)
Table 13 Europe Proanthocyanidins Revenue (USD Million) By Country (2021-2032)
Table 14 Asia Pacific Proanthocyanidins Revenue (USD Million) By Country (2021-2032)
Table 15 South America Proanthocyanidins Revenue (USD Million) By Country (2021-2032)
Table 16 Middle East and Africa Proanthocyanidins Revenue (USD Million) By Region (2021-2032)
Table 17 North America Proanthocyanidins Revenue (USD Million) By Type (2021-2032)
Table 18 North America Proanthocyanidins Revenue (USD Million) By Application (2021-2032)
Table 19 North America Proanthocyanidins Revenue (USD Million) By Product (2021-2032)
Table 20 Europe Proanthocyanidins Revenue (USD Million) By Type (2021-2032)
Table 21 Europe Proanthocyanidins Revenue (USD Million) By Application (2021-2032)
Table 22 Europe Proanthocyanidins Revenue (USD Million) By Product (2021-2032)
Table 23 Asia Pacific Proanthocyanidins Revenue (USD Million) By Type (2021-2032)
Table 24 Asia Pacific Proanthocyanidins Revenue (USD Million) By Application (2021-2032)
Table 25 Asia Pacific Proanthocyanidins Revenue (USD Million) By Product (2021-2032)
Table 26 South America Proanthocyanidins Revenue (USD Million) By Type (2021-2032)
Table 27 South America Proanthocyanidins Revenue (USD Million) By Application (2021-2032)
Table 28 South America Proanthocyanidins Revenue (USD Million) By Product (2021-2032)
Table 29 Middle East and Africa Proanthocyanidins Revenue (USD Million) By Type (2021-2032)
Table 30 Middle East and Africa Proanthocyanidins Revenue (USD Million) By Application (2021-2032)
Table 31 Middle East and Africa Proanthocyanidins Revenue (USD Million) By Product (2021-2032)
LIST OF FIGURES
Figure 1. Market Scope
Figure 2. Pricing Forecasts Per Unit, 2023- 2032
Figure 3. Porter’s Five Forces
Figure 4. Global Proanthocyanidins Market Revenue (USD Million) By Regions (2021-2032)
Figure 5. Global Proanthocyanidins Market Share (%) By Regions (2023)
Figure 6. North America Proanthocyanidins Revenue (USD Million) By Country (2021-2032)
Figure 7. United States Proanthocyanidins Revenue (USD Million) By Country (2021-2032)
Figure 8. Canada Proanthocyanidins Revenue (USD Million) By Country (2021-2032)
Figure 9. Mexico Proanthocyanidins Revenue (USD Million) By Country (2021-2032)
Figure 10. Europe Proanthocyanidins Revenue (USD Million) By Country (2021-2032)
Figure 11. Germany Proanthocyanidins Revenue (USD Million) By Country (2021-2032)
Figure 12. France Proanthocyanidins Revenue (USD Million) By Country (2021-2032)
Figure 13. United Kingdom Proanthocyanidins Revenue (USD Million) By Country (2021-2032)
Figure 14. Spain Proanthocyanidins Revenue (USD Million) By Country (2021-2032)
Figure 15. Italy Proanthocyanidins Revenue (USD Million) By Country (2021-2032)
Figure 16. Russia Proanthocyanidins Revenue (USD Million) By Country (2021-2032)
Figure 17. Rest of Europe Proanthocyanidins Revenue (USD Million) By Country (2021-2032)
Figure 11. Asia Pacific Proanthocyanidins Revenue (USD Million) By Country (2021-2032)
Figure 12. China Proanthocyanidins Revenue (USD Million) By Country (2021-2032)
Figure 13. Japan Proanthocyanidins Revenue (USD Million) By Country (2021-2032)
Figure 14. India Proanthocyanidins Revenue (USD Million) By Country (2021-2032)
Figure 15. South Korea Proanthocyanidins Revenue (USD Million) By Country (2021-2032)
Figure 16. Australia Proanthocyanidins Revenue (USD Million) By Country (2021-2032)
Figure 17. South East Asia Proanthocyanidins Revenue (USD Million) By Country (2021-2032)
Figure 18. South America Proanthocyanidins Revenue (USD Million) By Country (2021-2032)
Figure 19. Brazil Proanthocyanidins Revenue (USD Million) By Country (2021-2032)
Figure 20. Argentina Proanthocyanidins Revenue (USD Million) By Country (2021-2032)
Figure 21. Rest of Asia Pacific Proanthocyanidins Revenue (USD Million) By Country (2021-2032)
Figure 22. Middle East and Africa Proanthocyanidins Revenue (USD Million) By Region (2021-2032)
Figure 23. Saudi Arabia Proanthocyanidins Revenue (USD Million) By Region (2021-2032)
Figure 24. The UAE Proanthocyanidins Revenue (USD Million) By Region (2021-2032)
Figure 25. Rest of Middle East Proanthocyanidins Revenue (USD Million) By Region (2021-2032)
Figure 26. South Africa Proanthocyanidins Revenue (USD Million) By Region (2021-2032)
Figure 27. Africa Proanthocyanidins Revenue (USD Million) By Region (2021-2032)
Figure 28. North America Proanthocyanidins Revenue (USD Million) By Type (2021-2032)
Figure 29. North America Proanthocyanidins Revenue (USD Million) By Application (2021-2032)
Figure 30. North America Proanthocyanidins Revenue (USD Million) By Product (2021-2032)
Figure 31. Europe Proanthocyanidins Revenue (USD Million) By Type (2021-2032)
Figure 32. Europe Proanthocyanidins Revenue (USD Million) By Application (2021-2032)
Figure 33. Europe Proanthocyanidins Revenue (USD Million) By Product (2021-2032)
Figure 34. Asia Pacific Proanthocyanidins Revenue (USD Million) By Type (2021-2032)
Figure 35. Asia Pacific Proanthocyanidins Revenue (USD Million) By Application (2021-2032)
Figure 36. Asia Pacific Proanthocyanidins Revenue (USD Million) By Product (2021-2032)
Figure 37. South America Proanthocyanidins Revenue (USD Million) By Type (2021-2032)
Figure 38. South America Proanthocyanidins Revenue (USD Million) By Application (2021-2032)
Figure 39. South America Proanthocyanidins Revenue (USD Million) By Product (2021-2032)
Figure 40. Middle East and Africa Proanthocyanidins Revenue (USD Million) By Type (2021-2032)
Figure 41. Middle East and Africa Proanthocyanidins Revenue (USD Million) By Application (2021-2032)
Figure 42. Middle East and Africa Proanthocyanidins Revenue (USD Million) By Product (2021-2032)
By Source
Cranberry
Grape Seed
Pine Bark
Others
By Application
Pharmaceuticals & Dietary Supplements
Personal Care & Cosmetics
Functional Food & Beverages
By Type
Type A
Type B
Countries Analyzed
North America (US, Canada, Mexico)
Europe (Germany, UK, France, Spain, Italy, Russia, Rest of Europe)
Asia Pacific (China, India, Japan, South Korea, Australia, South East Asia, Rest of Asia)
South America (Brazil, Argentina, Rest of South America)
Middle East and Africa (Saudi Arabia, UAE, Rest of Middle East, South Africa, Egypt, Rest of Africa)
