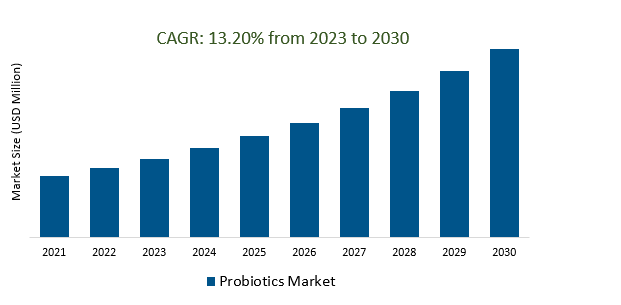
The Global Probiotics Market Size is estimated to register 13.2% growth over the forecast period from 2023 to 2030.
The market growth is driven by the increasing consumer awareness of the importance of gut health and its impact on overall well-being has led to a surge in demand for probiotic products. Leading companies that are focused on Expanding Product Portfolio, Customization and Personalization, Healthcare Integration, Targeted Health Solutions, Global Expansion, Technological Advancements, Applications in Animal Health, and others to boost market shares in the industry.
Market Overview
The global probiotics market was characterized by significant growth, driven by increasing consumer awareness of gut health, holistic well-being trends, ongoing scientific research, and regulatory support. The market included dietary supplements, functional foods, and animal feed categories. Key challenges included regulatory inconsistencies and quality control, while future prospects indicated continued expansion, with a focus on personalized probiotics and broader applications beyond digestive health. Please note that market conditions may have evolved since then, and up-to-date information is recommended for the latest insights.
Market Dynamics
Market Trends - Probiotics can boost performance and recovery in athletes and sports enthusiasts
Probiotics have the potential to enhance athletic performance and recovery by promoting digestive health, supporting the immune system, improving nutrient absorption, reducing inflammation, influencing mood and stress levels, aiding in weight management, facilitating adaptation to training, and reducing the risk of overtraining syndrome. However, individual responses vary, and further research is needed to establish specific probiotic recommendations for athletes. Consulting with healthcare professionals or registered dietitians is advisable for personalized probiotic strategies in sports and fitness.
Market Driver- Wellness and preventive health are driving the probiotics market.
Wellness and preventive health are key drivers of the probiotics market. Increasing consumer awareness of the benefits of probiotics in maintaining overall health and well-being, particularly in areas like gut health and immunity, has fueled the demand for probiotic products. Consumers are seeking natural and holistic approaches to health, making probiotics a popular choice for preventive measures.
Market Opportunity-Introduction of Clean Label Trends
Clean label trends in the probiotics market reflect consumer demand for straightforward and transparent product labeling, emphasizing natural ingredients, minimal processing, and the absence of artificial additives, GMOs, allergens, and synthetic chemicals. This trend also extends to eco-friendly packaging and certifications that provide assurance of product quality and authenticity, aligning with the preferences of health-conscious consumers seeking clean and simple probiotic options.
Market Share Analysis- Bacteria Probiotics Market will register the fastest growth
The Global Probiotics Market is analyzed across Bacteria, Yeast, and others. Bacteria are poised to register the fastest growth. In the probiotics market, bacteria are the key microorganisms used to deliver health benefits to consumers. Predominantly, strains of Lactobacillus and Bifidobacterium are selected for their ability to survive the digestive system and promote gut health, digestion, and immunity. These bacteria are integral to various probiotic products, with specific strains chosen based on intended health benefits and formulations.
Market Share Analysis- Human Probiotics held a significant market share in 2023
The Global Probiotics Market is analyzed across various End Users including Human Probiotics, Animal Probiotics, and others. Of these, Human Probiotics held a significant market share in 2023. Human probiotics are essential in the probiotics market, consisting of beneficial bacteria and yeast strains chosen to support human health, particularly in areas like digestion, immunity, and mental well-being. These probiotics are available in various product forms and are widely consumed by individuals seeking to enhance their overall health, driving innovation and growth in the probiotics market.
Probiotics Market Segmentation
By Type
· Probiotic Food & Beverages
- Dairy Products
- Non-dairy
- Cereals
- Baked Food
- Fermented Meat
- Dry Foods
· Probiotic Dietary Supplements
- Food Supplements
- Nutritional Supplements
- Specialty Supplements
- Infant Formula
- Animal Feed
By Ingredient
By End-User
- Human Probiotics
- Animal Probiotics
By Distribution Channel
- Hypermarkets/Supermarkets
- Pharmacies/ Drugstore
- Specialty Stores
- Online Stores
- Others
By Region
- North America (United States, Canada, Mexico)
- Europe (Germany, France, United Kingdom, Spain, Italy, Others)
- Asia Pacific (China, India, Japan, South Korea, Australia, Others)
- Latin America (Brazil, Argentina, Others)
- Middle East and Africa (Saudi Arabia, UAE, Kuwait, Other Middle East, South Africa, Nigeria, Other Africa)
Probiotics Market companies
- Yakult Honsha Co. Ltd
- DuPont De Nemours, Inc
- Kerry Group plc
- General Mills Inc
- Lifeway Foods Inc
- Arla Foods
- Danone
- Chr. Hansen Holding A/S
- Lallemand Inc
- Nestle S.A.
- BioGaia
- Mother Dairy Fruit & Vegetable Pvt. Ltd
- i-Health, Inc
- Probi AB
*List not exhaustive
Probiotics Market Outlook 2023
1 Market Overview
1.1 Introduction to the Probiotics Market
1.2 Scope of the Study
1.3 Research Objective
1.3.1 Key Market Scope and Segments
1.3.2 Players Covered
1.3.3 Years Considered
2 Executive Summary
2.1 2023 Probiotics Industry- Market Statistics
3 Market Dynamics
3.1 Market Drivers
3.2 Market Challenges
3.3 Market Opportunities
3.4 Market Trends
4 Market Factor Analysis
4.1 Porter’s Five Forces
4.2 Market Entropy
4.2.1 Global Probiotics Market Companies with Area Served
4.2.2 Products Offerings Global Probiotics Market
5 COVID-19 Impact Analysis and Outlook Scenarios
5.1.1 Covid-19 Impact Analysis
5.1.2 Post-COVID-19 Scenario- Low Growth Case
5.1.3 Post-COVID-19 Scenario- Reference Growth Case
5.1.4 Post-COVID-19 Scenario- Low Growth Case
6 Global Probiotics Market Trends
6.1 Global Probiotics Revenue (USD Million) and CAGR (%) by Type (2018-2030)
6.2 Global Probiotics Revenue (USD Million) and CAGR (%) by Applications (2018-2030)
6.3 Global Probiotics Revenue (USD Million) and CAGR (%) by Regions (2018-2030)
7 Global Probiotics Market Revenue (USD Million) by Type, and Applications (2018-2022)
7.1 Global Probiotics Revenue (USD Million) by Type (2018-2022)
7.1.1 Global Probiotics Revenue (USD Million), Market Share (%) by Type (2018-2022)
7.2 Global Probiotics Revenue (USD Million) by Applications (2018-2022)
7.2.1 Global Probiotics Revenue (USD Million), Market Share (%) by Applications (2018-2022)
8 Global Probiotics Development Regional Status and Outlook
8.1 Global Probiotics Revenue (USD Million) By Regions (2018-2022)
8.2 North America Probiotics Revenue (USD Million) by Type, and Application (2018-2022)
8.2.1 North America Probiotics Revenue (USD Million) by Country (2018-2022)
8.2.2 North America Probiotics Revenue (USD Million) by Type (2018-2022)
8.2.3 North America Probiotics Revenue (USD Million) by Applications (2018-2022)
8.3 Europe Probiotics Revenue (USD Million), by Type, and Applications (USD Million) (2018-2022)
8.3.1 Europe Probiotics Revenue (USD Million), by Country (2018-2022)
8.3.2 Europe Probiotics Revenue (USD Million) by Type (2018-2022)
8.3.3 Europe Probiotics Revenue (USD Million) by Applications (2018-2022)
8.4 Asia Pacific Probiotics Revenue (USD Million), and Revenue (USD Million) by Type, and Applications (2018-2022)
8.4.1 Asia Pacific Probiotics Revenue (USD Million) by Country (2018-2022)
8.4.2 Asia Pacific Probiotics Revenue (USD Million) by Type (2018-2022)
8.4.3 Asia Pacific Probiotics Revenue (USD Million) by Applications (2018-2022)
8.5 South America Probiotics Revenue (USD Million), by Type, and Applications (2018-2022)
8.5.1 South America Probiotics Revenue (USD Million), by Country (2018-2022)
8.5.2 South America Probiotics Revenue (USD Million) by Type (2018-2022)
8.5.3 South America Probiotics Revenue (USD Million) by Applications (2018-2022)
8.6 Middle East and Africa Probiotics Revenue (USD Million), by Type, Technology, Application, Thickness (2018-2022)
8.6.1 Middle East and Africa Probiotics Revenue (USD Million) by Country (2018-2022)
8.6.2 Middle East and Africa Probiotics Revenue (USD Million) by Type (2018-2022)
8.6.3 Middle East and Africa Probiotics Revenue (USD Million) by Applications (2018-2022)
9 Company Profiles
10 Global Probiotics Market Revenue (USD Million), by Type, and Applications (2023-2030)
10.1 Global Probiotics Revenue (USD Million) and Market Share (%) by Type (2023-2030)
10.1.1 Global Probiotics Revenue (USD Million), and Market Share (%) by Type (2023-2030)
10.2 Global Probiotics Revenue (USD Million) and Market Share (%) by Applications (2023-2030)
10.2.1 Global Probiotics Revenue (USD Million), and Market Share (%) by Applications (2023-2030)
11 Global Probiotics Development Regional Status and Outlook Forecast
11.1 Global Probiotics Revenue (USD Million) By Regions (2023-2030)
11.2 North America Probiotics Revenue (USD Million) by Type, and Applications (2023-2030)
11.2.1 North America Probiotics Revenue (USD) Million by Country (2023-2030)
11.2.2 North America Probiotics Revenue (USD Million), by Type (2023-2030)
11.2.3 North America Probiotics Revenue (USD Million), Market Share (%) by Applications (2023-2030)
11.3 Europe Probiotics Revenue (USD Million), by Type, and Applications (2023-2030)
11.3.1 Europe Probiotics Revenue (USD Million), by Country (2023-2030)
11.3.2 Europe Probiotics Revenue (USD Million), by Type (2023-2030)
11.3.3 Europe Probiotics Revenue (USD Million), by Applications (2023-2030)
11.4 Asia Pacific Probiotics Revenue (USD Million) by Type, and Applications (2023-2030)
11.4.1 Asia Pacific Probiotics Revenue (USD Million), by Country (2023-2030)
11.4.2 Asia Pacific Probiotics Revenue (USD Million), by Type (2023-2030)
11.4.3 Asia Pacific Probiotics Revenue (USD Million), by Applications (2023-2030)
11.5 South America Probiotics Revenue (USD Million), by Type, and Applications (2023-2030)
11.5.1 South America Probiotics Revenue (USD Million), by Country (2023-2030)
11.5.2 South America Probiotics Revenue (USD Million), by Type (2023-2030)
11.5.3 South America Probiotics Revenue (USD Million), by Applications (2023-2030)
11.6 Middle East and Africa Probiotics Revenue (USD Million), by Type, and Applications (2023-2030)
11.6.1 Middle East and Africa Probiotics Revenue (USD Million), by Region (2023-2030)
11.6.2 Middle East and Africa Probiotics Revenue (USD Million), by Type (2023-2030)
11.6.3 Middle East and Africa Probiotics Revenue (USD Million), by Applications (2023-2030)
12 Methodology and Data Sources
12.1 Methodology/Research Approach
12.1.1 Research Programs/Design
12.1.2 Market Size Estimation
12.1.3 Market Breakdown and Data Triangulation
12.2 Data Sources
12.2.1 Secondary Sources
12.2.2 Primary Sources
12.3 Disclaimer
List of Tables
Table 1 Market Segmentation Analysis
Table 2 Global Probiotics Market Companies with Areas Served
Table 3 Products Offerings Global Probiotics Market
Table 4 Low Growth Scenario Forecasts
Table 5 Reference Case Growth Scenario
Table 6 High Growth Case Scenario
Table 7 Global Probiotics Revenue (USD Million) And CAGR (%) By Type (2018-2030)
Table 8 Global Probiotics Revenue (USD Million) And CAGR (%) By Applications (2018-2030)
Table 9 Global Probiotics Revenue (USD Million) And CAGR (%) By Regions (2018-2030)
Table 10 Global Probiotics Revenue (USD Million) By Type (2018-2022)
Table 11 Global Probiotics Revenue Market Share (%) By Type (2018-2022)
Table 12 Global Probiotics Revenue (USD Million) By Applications (2018-2022)
Table 13 Global Probiotics Revenue Market Share (%) By Applications (2018-2022)
Table 14 Global Probiotics Market Revenue (USD Million) By Regions (2018-2022)
Table 15 Global Probiotics Market Share (%) By Regions (2018-2022)
Table 16 North America Probiotics Revenue (USD Million) By Country (2018-2022)
Table 17 North America Probiotics Revenue (USD Million) By Type (2018-2022)
Table 18 North America Probiotics Revenue (USD Million) By Applications (2018-2022)
Table 19 Europe Probiotics Revenue (USD Million) By Country (2018-2022)
Table 20 Europe Probiotics Revenue (USD Million) By Type (2018-2022)
Table 21 Europe Probiotics Revenue (USD Million) By Applications (2018-2022)
Table 22 Asia Pacific Probiotics Revenue (USD Million) By Country (2018-2022)
Table 23 Asia Pacific Probiotics Revenue (USD Million) By Type (2018-2022)
Table 24 Asia Pacific Probiotics Revenue (USD Million) By Applications (2018-2022)
Table 25 South America Probiotics Revenue (USD Million) By Country (2018-2022)
Table 26 South America Probiotics Revenue (USD Million) By Type (2018-2022)
Table 27 South America Probiotics Revenue (USD Million) By Applications (2018-2022)
Table 28 Middle East and Africa Probiotics Revenue (USD Million) By Region (2018-2022)
Table 29 Middle East and Africa Probiotics Revenue (USD Million) By Type (2018-2022)
Table 30 Middle East and Africa Probiotics Revenue (USD Million) By Applications (2018-2022)
Table 31 Financial Analysis
Table 32 Global Probiotics Revenue (USD Million) By Type (2023-2030)
Table 33 Global Probiotics Revenue Market Share (%) By Type (2023-2030)
Table 34 Global Probiotics Revenue (USD Million) By Applications (2023-2030)
Table 35 Global Probiotics Revenue Market Share (%) By Applications (2023-2030)
Table 36 Global Probiotics Market Revenue (USD Million), And Revenue (USD Million) By Regions (2023-2030)
Table 37 North America Probiotics Revenue (USD)By Country (2023-2030)
Table 38 North America Probiotics Revenue (USD Million) By Type (2023-2030)
Table 39 North America Probiotics Revenue (USD Million) By Applications (2023-2030)
Table 40 Europe Probiotics Revenue (USD Million) By Country (2023-2030)
Table 41 Europe Probiotics Revenue (USD Million) By Type (2023-2030)
Table 42 Europe Probiotics Revenue (USD Million) By Applications (2023-2030)
Table 43 Asia Pacific Probiotics Revenue (USD Million) By Country (2023-2030)
Table 44 Asia Pacific Probiotics Revenue (USD Million) By Type (2023-2030)
Table 45 Asia Pacific Probiotics Revenue (USD Million) By Applications (2023-2030)
Table 46 South America Probiotics Revenue (USD Million) By Country (2023-2030)
Table 47 South America Probiotics Revenue (USD Million) By Type (2023-2030)
Table 48 South America Probiotics Revenue (USD Million) By Applications (2023-2030)
Table 49 Middle East and Africa Probiotics Revenue (USD Million) By Region (2023-2030)
Table 50 Middle East and Africa Probiotics Revenue (USD Million) By Region (2023-2030)
Table 51 Middle East and Africa Probiotics Revenue (USD Million) By Type (2023-2030)
Table 52 Middle East and Africa Probiotics Revenue (USD Million) By Applications (2023-2030)
Table 53 Research Programs/Design for This Report
Table 54 Key Data Information from Secondary Sources
Table 55 Key Data Information from Primary Sources
List of Figures
Figure 1 Market Scope
Figure 2 Porter’s Five Forces
Figure 3 Global Probiotics Revenue (USD Million) By Type (2018-2022)
Figure 4 Global Probiotics Revenue Market Share (%) By Type (2022)
Figure 5 Global Probiotics Revenue (USD Million) By Applications (2018-2022)
Figure 6 Global Probiotics Revenue Market Share (%) By Applications (2022)
Figure 7 Global Probiotics Market Revenue (USD Million) By Regions (2018-2022)
Figure 8 Global Probiotics Market Share (%) By Regions (2022)
Figure 9 North America Probiotics Revenue (USD Million) By Country (2018-2022)
Figure 10 North America Probiotics Revenue (USD Million) By Type (2018-2022)
Figure 11 North America Probiotics Revenue (USD Million) By Applications (2018-2022)
Figure 12 Europe Probiotics Revenue (USD Million) By Country (2018-2022)
Figure 13 Europe Probiotics Revenue (USD Million) By Type (2018-2022)
Figure 14 Europe Probiotics Revenue (USD Million) By Applications (2018-2022)
Figure 15 Asia Pacific Probiotics Revenue (USD Million) By Country (2018-2022)
Figure 16 Asia Pacific Probiotics Revenue (USD Million) By Type (2018-2022)
Figure 17 Asia Pacific Probiotics Revenue (USD Million) By Applications (2018-2022)
Figure 18 South America Probiotics Revenue (USD Million) By Country (2018-2022)
Figure 19 South America Probiotics Revenue (USD Million) By Type (2018-2022)
Figure 20 South America Probiotics Revenue (USD Million) By Applications (2018-2022)
Figure 21 Middle East and Africa Probiotics Revenue (USD Million) By Region (2018-2022)
Figure 22 Middle East and Africa Probiotics Revenue (USD Million) By Type (2018-2022)
Figure 23 Middle East and Africa Probiotics Revenue (USD Million) By Applications (2018-2022)
Figure 24 Global Probiotics Revenue (USD Million) By Type (2023-2030)
Figure 25 Global Probiotics Revenue Market Share (%) By Type (2030)
Figure 26 Global Probiotics Revenue (USD Million) By Applications (2023-2030)
Figure 27 Global Probiotics Revenue Market Share (%) By Applications (2030)
Figure 28 Global Probiotics Market Revenue (USD Million) By Regions (2023-2030)
Figure 29 North America Probiotics Revenue (USD Million) By Country (2023-2030)
Figure 30 North America Probiotics Revenue (USD Million) By Type (2023-2030)
Figure 31 North America Probiotics Revenue (USD Million) By Applications (2023-2030)
Figure 32 Europe Probiotics Revenue (USD Million) By Country (2023-2030)
Figure 33 Europe Probiotics Revenue (USD Million) By Type (2023-2030)
Figure 34 Europe Probiotics Revenue (USD Million) By Applications (2023-2030)
Figure 35 Asia Pacific Probiotics Revenue (USD Million) By Country (2023-2030)
Figure 36 Asia Pacific Probiotics Revenue (USD Million) By Type (2023-2030)
Figure 37 Asia Pacific Probiotics Revenue (USD Million) By Applications (2023-2030)
Figure 38 South America Probiotics Revenue (USD Million) By Country (2023-2030)
Figure 39 South America Probiotics Revenue (USD Million) By Type (2023-2030)
Figure 40 South America Probiotics Revenue (USD Million) By Applications (2023-2030)
Figure 41 Middle East and Africa Probiotics Revenue (USD Million) By Region (2023-2030)
Figure 42 Middle East and Africa Probiotics Revenue (USD Million) By Region (2023-2030)
Figure 43 Middle East and Africa Probiotics Revenue (USD Million) By Type (2023-2030)
Figure 44 Middle East and Africa Probiotics Revenue (USD Million) By Applications (2023-2030)
Figure 45 Bottom-Up and Top-Down Approaches For This Report
Figure 46 Data Triangulation
