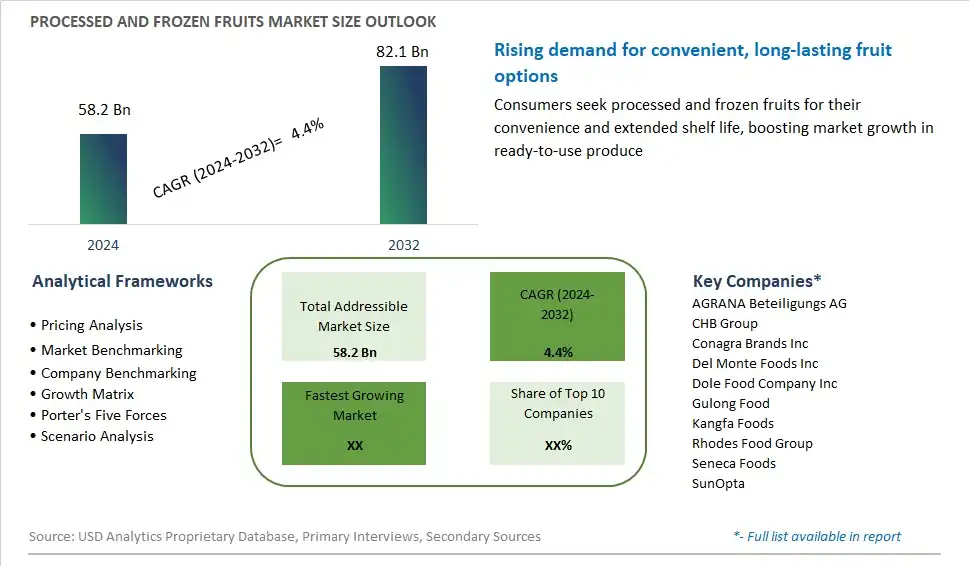
Global Processed and Frozen Fruits Market Size is valued at $58.2 Billion in 2024 and is forecast to register a growth rate (CAGR) of 4.4% to reach $82.1 Billion by 2032.
The global Processed and Frozen Fruits Market Comprehensive Study analyzes and forecasts the market size across 6 regions and 24 countries for diverse segments -By Product (Dried, Canned, Frozen, Convenience), By Distribution Channel (Offline, Online)
An Introduction to Processed and Frozen Fruits Market
In 2024, the processed and frozen fruits market is thriving, driven by increasing consumer demand for convenient, nutritious, and long-lasting fruit options. Processed and frozen fruits, which include a wide range of products such as fruit purees, canned fruits, and frozen fruit mixes, offer a practical solution for busy consumers seeking to incorporate more fruit into their diets. Health-conscious consumers are drawn to these products for their high nutritional value, often rich in vitamins, fiber, and antioxidants, as well as their convenience and extended shelf life. The market is influenced by the trend towards clean eating and natural ingredients, with many consumers seeking products that are free from added sugars, preservatives, and artificial additives. Innovations in processing and freezing technologies have significantly improved the quality and taste of processed and frozen fruits, making them a popular choice for smoothies, desserts, and cooking. As consumers continue to prioritize health and convenience, the processed and frozen fruits market is set for robust growth and diversification.
Processed and Frozen Fruits Competitive Landscape
The market report analyses the leading companies in the industry including AGRANA Beteiligungs AG, CHB Group, Conagra Brands Inc, Del Monte Foods Inc, Dole Food Company Inc, Gulong Food, Kangfa Foods, Rhodes Food Group, Seneca Foods, SunOpta, and Others.
Processed and Frozen Fruits Market Dynamics
Processed and Frozen Fruits Market Trend: Increasing Demand for Convenience and Shelf-Life Extension
The market for processed and frozen fruits is experiencing a prominent trend towards the increasing demand for convenience and shelf-life extension. This trend is driven by changing consumer lifestyles, with busy schedules leading to a preference for ready-to-use ingredients that require minimal preparation. Processed and frozen fruits offer consumers the convenience of year-round availability, extended shelf life, and reduced food waste compared to fresh produce. As consumers seek out convenient options for incorporating fruits into their diets, the market for processed and frozen fruits is witnessing steady growth and innovation to meet their needs.
Market Driver: Expansion of Food Processing Technologies and Distribution Channels
The rapid expansion of the processed and frozen fruits market is primarily driven by advancements in food processing technologies and the expansion of distribution channels. Innovations in freezing techniques, such as flash freezing and individual quick freezing (IQF), preserve the texture, flavor, and nutritional integrity of fruits while extending their shelf life. Additionally, improvements in packaging materials and storage technologies ensure that frozen fruits retain their quality during transportation and storage. Moreover, the proliferation of distribution channels, including supermarkets, convenience stores, online retailers, and foodservice outlets, expands access to processed and frozen fruits, making them more readily available to consumers.
Market Opportunity: Diversification of Product Offerings and Value-Added Options
One significant opportunity within the processed and frozen fruits market lies in diversification of product offerings and value-added options to meet the evolving preferences and dietary needs of consumers. Brands can differentiate themselves by offering a wider range of processed and frozen fruit varieties, including single-fruit options as well as mixed fruit blends. Additionally, exploring value-added options such as pre-cut, pre-packaged fruit medleys, smoothie mixes, and fruit toppings can enhance convenience and appeal to consumers seeking ready-to-use solutions for meal preparation and snacking. Furthermore, leveraging consumer demand for organic, non-GMO, and sustainably sourced fruits can create opportunities for premium and niche product offerings within the processed and frozen fruit category. Collaborations with nutritionists, chefs, and culinary experts can drive product innovation and recipe development, ensuring that processed and frozen fruits remain a versatile and appealing ingredient for consumers seeking convenient and nutritious food options. As the market for processed and frozen fruits continues to evolve, brands that prioritize innovation, quality, and consumer engagement are well-positioned to capitalize on the growing demand for convenient and healthy fruit products.
Processed and Frozen Fruits Market Share Analysis: Frozen Fruits held the dominant market share in 2024
In the segmented landscape of the Processed and Frozen Fruits Market categorized by Product, Frozen Fruits emerge as the largest and most prevalent segment, driven by several key factors. Frozen fruits offer consumers the convenience of year-round availability, extended shelf life, and retention of nutritional value. The freezing process preserves the fruits' freshness, flavor, and nutrients, making them a popular choice among consumers seeking convenient and healthy options. Further, frozen fruits are versatile ingredients used in various culinary applications, including smoothies, desserts, baked goods, and savory dishes, further contributing to their widespread adoption. Additionally, the increasing demand for ready-to-eat and pre-prepared foods, coupled with busy lifestyles, fuels the growth of the Frozen Fruits segment. As consumers prioritize convenience without compromising on quality and nutrition, the dominance of Frozen Fruits in the Processed and Frozen Fruits Market is expected to persist, driving overall market sales and growth.
Processed and Frozen Fruits Market Share Analysis: Online Distribution market is poised to register the fastest growth rae over the forecast period to 2032
In the dynamic landscape of the Processed and Frozen Fruits Market segmented by Distribution Channel, the Online segment is the fastest-growing player, propelled by shifting consumer preferences towards convenience, accessibility, and digitalization. Online distribution channels offer consumers the convenience of purchasing processed and frozen fruits from the comfort of their homes, eliminating the need for physical store visits. Further, the proliferation of e-commerce platforms and digital marketplaces has expanded the reach of processed and frozen fruits to a broader audience, including consumers in remote areas. Additionally, the COVID-19 pandemic has accelerated the adoption of online shopping habits, further propelling the growth of the Online Distribution segment. As consumers continue to prioritize convenience and safety in their purchasing behaviors, the Online Distribution channel is poised to sustain its rapid growth trajectory in the Processed and Frozen Fruits Market.
Processed and Frozen Fruits Market Segmentation
By Product
Dried
Canned
Frozen
Convenience
By Distribution Channel
Offline
Online
Countries Analyzed
North America (US, Canada, Mexico)
Europe (Germany, UK, France, Spain, Italy, Russia, Rest of Europe)
Asia Pacific (China, India, Japan, South Korea, Australia, South East Asia, Rest of Asia)
South America (Brazil, Argentina, Rest of South America)
Middle East and Africa (Saudi Arabia, UAE, Rest of Middle East, South Africa, Egypt, Rest of Africa)
Processed and Frozen Fruits Companies Profiled in the Study
AGRANA Beteiligungs AG
CHB Group
Conagra Brands Inc
Del Monte Foods Inc
Dole Food Company Inc
Gulong Food
Kangfa Foods
Rhodes Food Group
Seneca Foods
SunOpta
*- List Not Exhaustive
Chapter 1. TABLE OF CONTENTS
Chapter 2. Introduction to Processed and Frozen Fruits Market
2.1. Market Overview
2.2. Key Statistics and Report Highlights
2.3. Scope of the Comprehensive Study
2.3.1. Market Definition
2.3.2 Countries and Regions Covered
2.3.3 Research Objective
2.3.4 Units, Currency, and Conversions
2.3.5 Industry Value Chain
2.4. Key Market Segments
2.5. Key Companies
2.6. Study Period
Chapter 3. Strategic Analysis Review
3.1. Processed and Frozen Fruits Pricing Analysis and Forecast
3.2. Porter’s Five Forces
3.3. Market Ecosystem
3.4. SWOT Analysis
3.5. Regulatory Scenario
3.3. Effects of Inflation, Russia-Ukraine War, moderating economic growth, and other macroeconomic factors
Chapter 4. Competitive Landscape
4.1. Market Share Analysis
4.1.1. Global Processed and Frozen Fruits Market Share by Company, 2023
4.1.2. Product Offerings of Leading Processed and Frozen Fruits Companies
4.2. Market Entropy
4.2.1. New Product Launches in the Industry
4.2.2. Mergers, Acquisitions, Joint ventures, and Partnerships
4.3. Key Strategies and Best Practices
Chapter 5. Global Market Projections: Best, Reference, and Low Case Scenarios
5.1. Growth Analysis- Case Scenario Definitions
5.2. Low Growth Case Scenario Forecasts
5.3. Reference Growth Case Scenario Forecasts
5.4. High Growth Case Scenario Forecasts
Chapter 6. Market Dynamics
6.1. Processed and Frozen Fruits Market Drivers
6.2. Processed and Frozen Fruits Market Challenges
6.6. Processed and Frozen Fruits Market Opportunities
6.4. Processed and Frozen Fruits Market Trends
Chapter 7. Global Processed and Frozen Fruits Market Outlook Trends
7.1. Global Processed and Frozen Fruits Revenue (USD Million) and CAGR (%) by Type (2021-2032)
7.2. Global Processed and Frozen Fruits Revenue (USD Million) and CAGR (%) by Application (2021-2032)
7.3. Global Processed and Frozen Fruits Revenue (USD Million) and CAGR (%) by Product (2021-2032)
By Product
Dried
Canned
Frozen
Convenience
By Distribution Channel
Offline
Online
Chapter 8. Global Processed and Frozen Fruits Regional Analysis and Outlook
8.1. Global Processed and Frozen Fruits Revenue (USD Million) By Regions (2021- 2032)
8.2. North America Processed and Frozen Fruits Revenue (USD Million) by Country (2021-2032)
8.2.1. United States Processed and Frozen Fruits Regional Analysis and Outlook
8.2.2. Canada Processed and Frozen Fruits Regional Analysis and Outlook
8.2.3. Mexico Processed and Frozen Fruits Regional Analysis and Outlook
8.3. Europe Processed and Frozen Fruits Revenue (USD Million), by Country (2021-2032)
8.3.1. Germany Processed and Frozen Fruits Regional Analysis and Outlook
8.3.2. France Processed and Frozen Fruits Regional Analysis and Outlook
8.3.3. United Kingdom Processed and Frozen Fruits Regional Analysis and Outlook
8.3.4. Spain Processed and Frozen Fruits Regional Analysis and Outlook
8.3.5. Italy Processed and Frozen Fruits Regional Analysis and Outlook
8.3.6. Russia Processed and Frozen Fruits Regional Analysis and Outlook
8.3.7. Rest of Europe Processed and Frozen Fruits Regional Analysis and Outlook
8.4. Asia Pacific Processed and Frozen Fruits Revenue (USD Million) by Country (2021-2032)
8.4.1. China Processed and Frozen Fruits Regional Analysis and Outlook
8.4.2. Japan Processed and Frozen Fruits Regional Analysis and Outlook
8.4.3. India Processed and Frozen Fruits Regional Analysis and Outlook
8.4.4. South Korea Processed and Frozen Fruits Regional Analysis and Outlook
8.4.5. Australia Processed and Frozen Fruits Regional Analysis and Outlook
8.4.6. South East Asia Processed and Frozen Fruits Regional Analysis and Outlook
8.4.7. Rest of Asia Pacific Processed and Frozen Fruits Regional Analysis and Outlook
8.5. South America Processed and Frozen Fruits Revenue (USD Million), by Country (2021-2032)
8.5.1. Brazil Processed and Frozen Fruits Regional Analysis and Outlook
8.5.2. Argentina Processed and Frozen Fruits Regional Analysis and Outlook
8.5.3. Rest of South America Processed and Frozen Fruits Regional Analysis and Outlook
8.6. Middle East and Africa Processed and Frozen Fruits Revenue (USD Million) by Country (2021-2032)
8.6.1. Middle East Processed and Frozen Fruits Regional Analysis and Outlook
8.6.2. Africa Processed and Frozen Fruits Regional Analysis and Outlook
Chapter 9. North America Processed and Frozen Fruits Analysis and Outlook
9.1. North America Processed and Frozen Fruits Revenue (USD Million) by Segments (2021-2032)
9.1.1. North America Processed and Frozen Fruits Revenue (USD Million) by Type (2021-2032)
9.1.2. North America Processed and Frozen Fruits Revenue (USD Million) by Application (2021-2032)
9.1.3. North America Processed and Frozen Fruits Revenue (USD Million) by Product (2021-2032)
By Product
Dried
Canned
Frozen
Convenience
By Distribution Channel
Offline
Online
Chapter 10. Europe Processed and Frozen Fruits Analysis and Outlook
10.1. Europe Processed and Frozen Fruits Revenue (USD Million), by Segments (USD Million) (2021-2032)
10.1.1. Europe Processed and Frozen Fruits Revenue (USD Million) by Type (2021-2032)
10.1.2. Europe Processed and Frozen Fruits Revenue (USD Million) by Application (2021-2032)
10.1.3. Europe Processed and Frozen Fruits Revenue (USD Million) by Product (2021-2032)
By Product
Dried
Canned
Frozen
Convenience
By Distribution Channel
Offline
Online
Chapter 11. Asia Pacific Processed and Frozen Fruits Analysis and Outlook
11.1. Asia Pacific Processed and Frozen Fruits Revenue (USD Million), and Revenue (USD Million) by Segments (2021-2032)
11.1.1. Asia Pacific Processed and Frozen Fruits Revenue (USD Million) by Type (2021-2032)
11.1.2. Asia Pacific Processed and Frozen Fruits Revenue (USD Million) by Application (2021-2032)
11.1.3. Asia Pacific Processed and Frozen Fruits Revenue (USD Million) by Product (2021-2032)
By Product
Dried
Canned
Frozen
Convenience
By Distribution Channel
Offline
Online
Chapter 12. South America Processed and Frozen Fruits Analysis and Outlook
12.1. South America Processed and Frozen Fruits Revenue (USD Million), by Segments (2021-2032)
12.1.1. South America Processed and Frozen Fruits Revenue (USD Million) by Type (2021-2032)
12.1.2. South America Processed and Frozen Fruits Revenue (USD Million) by Application (2021-2032)
12.1.3. South America Processed and Frozen Fruits Revenue (USD Million) by Product (2021-2032)
By Product
Dried
Canned
Frozen
Convenience
By Distribution Channel
Offline
Online
Chapter 13. Middle East and Africa Processed and Frozen Fruits Analysis and Outlook
13.1. Middle East and Africa Processed and Frozen Fruits Revenue (USD Million), by Segments (2021-2032)
13.1.1. Middle East and Africa Processed and Frozen Fruits Revenue (USD Million) by Type (2021-2032)
13.1.2. Middle East and Africa Processed and Frozen Fruits Revenue (USD Million) by Application (2021-2032)
13.1.3. Middle East and Africa Processed and Frozen Fruits Revenue (USD Million) by Product (2021-2032)
By Product
Dried
Canned
Frozen
Convenience
By Distribution Channel
Offline
Online
Chapter 14. Processed and Frozen Fruits Company Profiles
14.1 Business Overview
14.2 Product Profiles
14.3 SWOT Profiles
14.5 Recent Developments
14.6 Financial Profile
List of Companies
AGRANA Beteiligungs AG
CHB Group
Conagra Brands Inc
Del Monte Foods Inc
Dole Food Company Inc
Gulong Food
Kangfa Foods
Rhodes Food Group
Seneca Foods
SunOpta
15. Methodology and Data Sources
15.1 Customization Offerings
15.2 Subscription Services
15.3 Related Reports
15.4 Publisher Expertise
LIST OF TABLES
Table 1 Market Segmentation Analysis
Table 2 Global Processed and Frozen Fruits Market Share of Leading Companies, 2023
Table 3 Product Offerings of Leading Companies
Table 4 Low Growth Scenario Forecasts
Table 5 Reference Case Growth Scenario
Table 6 High Growth Case Scenario
Table 7 Global Processed and Frozen Fruits Revenue (USD Million) And CAGR (%) By Type (2021-2032)
Table 8 Global Processed and Frozen Fruits Revenue (USD Million) And CAGR (%) By Application (2021-2032)
Table 9 Global Processed and Frozen Fruits Revenue (USD Million) And CAGR (%) By Product (2021-2032)
Table 10 Global Processed and Frozen Fruits Market Revenue (USD Million) By Regions (2021-2032)
Table 11 Global Processed and Frozen Fruits Market Share (%) By Regions (2021-2032)
Table 12 North America Processed and Frozen Fruits Revenue (USD Million) By Country (2021-2032)
Table 13 Europe Processed and Frozen Fruits Revenue (USD Million) By Country (2021-2032)
Table 14 Asia Pacific Processed and Frozen Fruits Revenue (USD Million) By Country (2021-2032)
Table 15 South America Processed and Frozen Fruits Revenue (USD Million) By Country (2021-2032)
Table 16 Middle East and Africa Processed and Frozen Fruits Revenue (USD Million) By Region (2021-2032)
Table 17 North America Processed and Frozen Fruits Revenue (USD Million) By Type (2021-2032)
Table 18 North America Processed and Frozen Fruits Revenue (USD Million) By Application (2021-2032)
Table 19 North America Processed and Frozen Fruits Revenue (USD Million) By Product (2021-2032)
Table 20 Europe Processed and Frozen Fruits Revenue (USD Million) By Type (2021-2032)
Table 21 Europe Processed and Frozen Fruits Revenue (USD Million) By Application (2021-2032)
Table 22 Europe Processed and Frozen Fruits Revenue (USD Million) By Product (2021-2032)
Table 23 Asia Pacific Processed and Frozen Fruits Revenue (USD Million) By Type (2021-2032)
Table 24 Asia Pacific Processed and Frozen Fruits Revenue (USD Million) By Application (2021-2032)
Table 25 Asia Pacific Processed and Frozen Fruits Revenue (USD Million) By Product (2021-2032)
Table 26 South America Processed and Frozen Fruits Revenue (USD Million) By Type (2021-2032)
Table 27 South America Processed and Frozen Fruits Revenue (USD Million) By Application (2021-2032)
Table 28 South America Processed and Frozen Fruits Revenue (USD Million) By Product (2021-2032)
Table 29 Middle East and Africa Processed and Frozen Fruits Revenue (USD Million) By Type (2021-2032)
Table 30 Middle East and Africa Processed and Frozen Fruits Revenue (USD Million) By Application (2021-2032)
Table 31 Middle East and Africa Processed and Frozen Fruits Revenue (USD Million) By Product (2021-2032)
LIST OF FIGURES
Figure 1. Market Scope
Figure 2. Pricing Forecasts Per Unit, 2023- 2032
Figure 3. Porter’s Five Forces
Figure 4. Global Processed and Frozen Fruits Market Revenue (USD Million) By Regions (2021-2032)
Figure 5. Global Processed and Frozen Fruits Market Share (%) By Regions (2023)
Figure 6. North America Processed and Frozen Fruits Revenue (USD Million) By Country (2021-2032)
Figure 7. United States Processed and Frozen Fruits Revenue (USD Million) By Country (2021-2032)
Figure 8. Canada Processed and Frozen Fruits Revenue (USD Million) By Country (2021-2032)
Figure 9. Mexico Processed and Frozen Fruits Revenue (USD Million) By Country (2021-2032)
Figure 10. Europe Processed and Frozen Fruits Revenue (USD Million) By Country (2021-2032)
Figure 11. Germany Processed and Frozen Fruits Revenue (USD Million) By Country (2021-2032)
Figure 12. France Processed and Frozen Fruits Revenue (USD Million) By Country (2021-2032)
Figure 13. United Kingdom Processed and Frozen Fruits Revenue (USD Million) By Country (2021-2032)
Figure 14. Spain Processed and Frozen Fruits Revenue (USD Million) By Country (2021-2032)
Figure 15. Italy Processed and Frozen Fruits Revenue (USD Million) By Country (2021-2032)
Figure 16. Russia Processed and Frozen Fruits Revenue (USD Million) By Country (2021-2032)
Figure 17. Rest of Europe Processed and Frozen Fruits Revenue (USD Million) By Country (2021-2032)
Figure 11. Asia Pacific Processed and Frozen Fruits Revenue (USD Million) By Country (2021-2032)
Figure 12. China Processed and Frozen Fruits Revenue (USD Million) By Country (2021-2032)
Figure 13. Japan Processed and Frozen Fruits Revenue (USD Million) By Country (2021-2032)
Figure 14. India Processed and Frozen Fruits Revenue (USD Million) By Country (2021-2032)
Figure 15. South Korea Processed and Frozen Fruits Revenue (USD Million) By Country (2021-2032)
Figure 16. Australia Processed and Frozen Fruits Revenue (USD Million) By Country (2021-2032)
Figure 17. South East Asia Processed and Frozen Fruits Revenue (USD Million) By Country (2021-2032)
Figure 18. South America Processed and Frozen Fruits Revenue (USD Million) By Country (2021-2032)
Figure 19. Brazil Processed and Frozen Fruits Revenue (USD Million) By Country (2021-2032)
Figure 20. Argentina Processed and Frozen Fruits Revenue (USD Million) By Country (2021-2032)
Figure 21. Rest of Asia Pacific Processed and Frozen Fruits Revenue (USD Million) By Country (2021-2032)
Figure 22. Middle East and Africa Processed and Frozen Fruits Revenue (USD Million) By Region (2021-2032)
Figure 23. Saudi Arabia Processed and Frozen Fruits Revenue (USD Million) By Region (2021-2032)
Figure 24. The UAE Processed and Frozen Fruits Revenue (USD Million) By Region (2021-2032)
Figure 25. Rest of Middle East Processed and Frozen Fruits Revenue (USD Million) By Region (2021-2032)
Figure 26. South Africa Processed and Frozen Fruits Revenue (USD Million) By Region (2021-2032)
Figure 27. Africa Processed and Frozen Fruits Revenue (USD Million) By Region (2021-2032)
Figure 28. North America Processed and Frozen Fruits Revenue (USD Million) By Type (2021-2032)
Figure 29. North America Processed and Frozen Fruits Revenue (USD Million) By Application (2021-2032)
Figure 30. North America Processed and Frozen Fruits Revenue (USD Million) By Product (2021-2032)
Figure 31. Europe Processed and Frozen Fruits Revenue (USD Million) By Type (2021-2032)
Figure 32. Europe Processed and Frozen Fruits Revenue (USD Million) By Application (2021-2032)
Figure 33. Europe Processed and Frozen Fruits Revenue (USD Million) By Product (2021-2032)
Figure 34. Asia Pacific Processed and Frozen Fruits Revenue (USD Million) By Type (2021-2032)
Figure 35. Asia Pacific Processed and Frozen Fruits Revenue (USD Million) By Application (2021-2032)
Figure 36. Asia Pacific Processed and Frozen Fruits Revenue (USD Million) By Product (2021-2032)
Figure 37. South America Processed and Frozen Fruits Revenue (USD Million) By Type (2021-2032)
Figure 38. South America Processed and Frozen Fruits Revenue (USD Million) By Application (2021-2032)
Figure 39. South America Processed and Frozen Fruits Revenue (USD Million) By Product (2021-2032)
Figure 40. Middle East and Africa Processed and Frozen Fruits Revenue (USD Million) By Type (2021-2032)
Figure 41. Middle East and Africa Processed and Frozen Fruits Revenue (USD Million) By Application (2021-2032)
Figure 42. Middle East and Africa Processed and Frozen Fruits Revenue (USD Million) By Product (2021-2032)
By Product
Dried
Canned
Frozen
Convenience
By Distribution Channel
Offline
Online
Countries Analyzed
North America (US, Canada, Mexico)
Europe (Germany, UK, France, Spain, Italy, Russia, Rest of Europe)
Asia Pacific (China, India, Japan, South Korea, Australia, South East Asia, Rest of Asia)
South America (Brazil, Argentina, Rest of South America)
Middle East and Africa (Saudi Arabia, UAE, Rest of Middle East, South Africa, Egypt, Rest of Africa)
