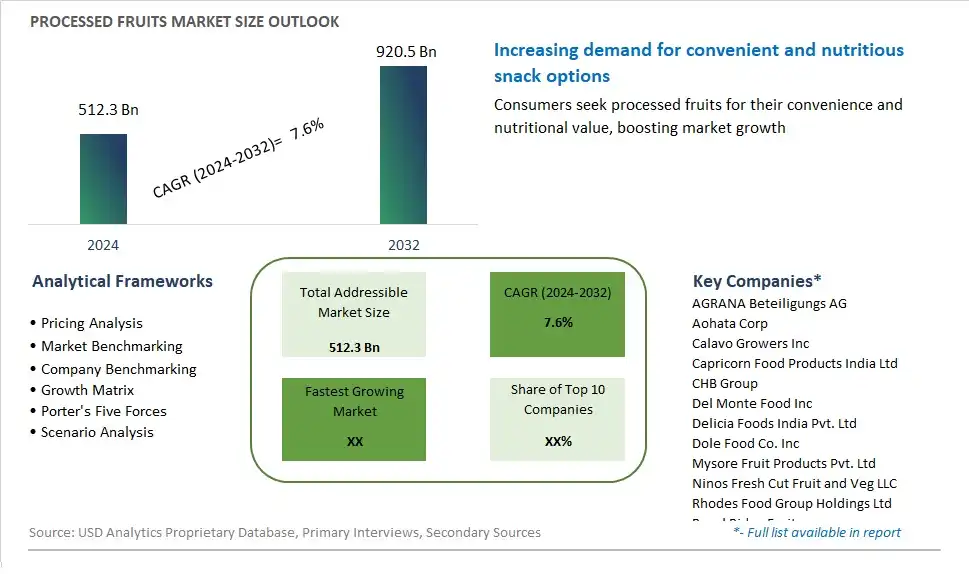
Global Processed Fruits Market Size is valued at $512.3 Billion in 2024 and is forecast to register a growth rate (CAGR) of 7.6% to reach $920.5 Billion by 2032.
The global Processed Fruits Market Comprehensive Study analyzes and forecasts the market size across 6 regions and 24 countries for diverse segments -By Product (Fresh Cut, Canned Fruits, Frozen Fruits), By Distribution Channel (Offline, Online)
An Introduction to Processed Fruits Market
The market for processed fruits in 2024 reflects a growing demand for convenient, shelf-stable fruit products that offer extended shelf life and retain nutritional value. Processed fruits encompass a variety of forms, including canned fruits, frozen fruits, dried fruits, fruit purees, and fruit concentrates, catering to diverse consumer preferences and culinary applications. Processed fruits are valued for their convenience, versatility, and year-round availability, allowing consumers to enjoy their favorite fruits regardless of seasonality or geographical location. Moreover, advancements in processing technologies, such as freeze-drying, vacuum-sealing, and aseptic packaging, are preserving the flavor, texture, and nutrient content of processed fruits, meeting consumer expectations for quality and freshness in packaged foods.
Processed Fruits Competitive Landscape
The market report analyses the leading companies in the industry including AGRANA Beteiligungs AG, Aohata Corp, Calavo Growers Inc, Capricorn Food Products India Ltd, CHB Group, Del Monte Food Inc, Delicia Foods India Pvt. Ltd, Dole Food Co. Inc, Mysore Fruit Products Pvt. Ltd, Ninos Fresh Cut Fruit and Veg LLC, Rhodes Food Group Holdings Ltd, Royal Ridge Fruits, Speyfruit Ltd, Sysco Corp, US Foods Holding Corp, and Others.
Processed Fruits Market Dynamics
Processed Fruits Market Trend: Rising Demand for Convenience Foods
One of the most prominent trends in the processed fruits market is the increasing demand for convenience foods. Modern lifestyles, characterized by busy schedules and limited time for meal preparation, have led consumers to seek ready-to-eat and easy-to-prepare food options. Processed fruits, such as canned, frozen, dried, and packaged fruit snacks, fit perfectly into this demand for convenience. These products offer the advantage of longer shelf life, ease of storage, and year-round availability, making them a popular choice among consumers looking for quick and healthy food options. Additionally, the trend is supported by the growing urban population and the rising number of working professionals who prefer nutritious yet convenient food solutions. This shift towards convenience is also driving innovation in packaging and processing technologies to maintain the nutritional value and taste of processed fruits.
Market Driver: Growing Health Consciousness and Nutritional Awareness
A significant driver for the processed fruits market is the growing health consciousness and nutritional awareness among consumers. As people become more informed about the health benefits of a balanced diet rich in fruits, the demand for processed fruits has increased. Processed fruits provide essential vitamins, minerals, and dietary fiber, making them an attractive option for health-conscious consumers. This driver is further amplified by the increasing prevalence of lifestyle diseases such as obesity, diabetes, and heart disease, prompting consumers to adopt healthier eating habits. The convenience of processed fruits allows consumers to easily incorporate more fruits into their diet without the hassle of preparation and seasonal limitations. Moreover, product innovations such as organic, non-GMO, and preservative-free processed fruits cater to the preferences of health-conscious consumers who are willing to pay a premium for higher quality and safer food products.
Market Opportunity: Expansion in Emerging Markets
The processed fruits market presents a significant growth opportunity in emerging markets. Regions such as Asia-Pacific, Latin America, and Africa are experiencing rapid urbanization, rising disposable incomes, and changing dietary patterns, all of which are contributing to increased demand for processed food products. In these markets, there is a growing middle class with greater purchasing power and a preference for convenient and nutritious food options. Companies can capitalize on this opportunity by expanding their distribution networks, investing in local production facilities, and tailoring their product offerings to meet the taste preferences and cultural dietary habits of consumers in these regions. Additionally, educational marketing campaigns highlighting the health benefits and convenience of processed fruits can help boost consumer acceptance and demand. By strategically entering these emerging markets, companies can tap into a large and growing consumer base, driving significant sales and market share growth.
Processed Fruits Market Share Analysis: Canned Fruits held the dominant market share in 2024
In the Processed Fruits Market, the Canned Fruits segment is the largest due to several key factors influencing consumer preferences and market dynamics. Canned fruits offer convenience, extended shelf life, and year-round availability, making them a popular choice among consumers seeking quick and easy-to-prepare fruit options. The canning process preserves the flavor, nutrients, and texture of fruits, ensuring consistent quality and taste even during off-seasons or in regions where certain fruits are not readily available. Further, canned fruits are versatile ingredients suitable for various culinary applications, including desserts, salads, and smoothies, appealing to consumers' desire for versatility and convenience in meal preparation. Additionally, the affordability and accessibility of canned fruits make them a staple pantry item for households of all income levels. Furthermore, the widespread availability of canned fruits in supermarkets, grocery stores, and online retailers further contributes to the dominance of this segment in the Processed Fruits Market. As a result, the Canned Fruits segment maintains its leadership, driven by its convenience, versatility, and widespread consumer acceptance as a convenient and reliable fruit option.
Processed Fruits Market Share Analysis: Online Distribution market is poised to register the fastest growth rae over the forecast period to 2032
The processed fruits market has witnessed a remarkable surge in recent years, with online distribution emerging as the fastest-growing segment. This trend can be attributed to several key factors. Firstly, the convenience offered by online shopping platforms has revolutionized the way consumers access food products, allowing them to browse and purchase processed fruits from the comfort of their homes. Additionally, the widespread penetration of smartphones and the internet has made online shopping more accessible to a larger consumer base, particularly among urban and tech-savvy demographics. Furthermore, online retailers often provide a wider variety of choices and competitive pricing, attracting consumers seeking diversity and value for their money. Further, the ongoing global pandemic has accelerated the shift towards online shopping as consumers prioritize safety and contactless transactions. As a result, the online distribution channel for processed fruits is experiencing rapid growth, presenting lucrative opportunities for businesses to capitalize on the evolving consumer preferences and market dynamics.
Processed Fruits Market Segmentation
By Product
Fresh Cut
Canned Fruits
Frozen Fruits
By Distribution Channel
Offline
Online
Countries Analyzed
North America (US, Canada, Mexico)
Europe (Germany, UK, France, Spain, Italy, Russia, Rest of Europe)
Asia Pacific (China, India, Japan, South Korea, Australia, South East Asia, Rest of Asia)
South America (Brazil, Argentina, Rest of South America)
Middle East and Africa (Saudi Arabia, UAE, Rest of Middle East, South Africa, Egypt, Rest of Africa)
Processed Fruits Companies Profiled in the Study
AGRANA Beteiligungs AG
Aohata Corp
Calavo Growers Inc
Capricorn Food Products India Ltd
CHB Group
Del Monte Food Inc
Delicia Foods India Pvt. Ltd
Dole Food Co. Inc
Mysore Fruit Products Pvt. Ltd
Ninos Fresh Cut Fruit and Veg LLC
Rhodes Food Group Holdings Ltd
Royal Ridge Fruits
Speyfruit Ltd
Sysco Corp
US Foods Holding Corp
*- List Not Exhaustive
Chapter 1. TABLE OF CONTENTS
Chapter 2. Introduction to Processed Fruits Market
2.1. Market Overview
2.2. Key Statistics and Report Highlights
2.3. Scope of the Comprehensive Study
2.3.1. Market Definition
2.3.2 Countries and Regions Covered
2.3.3 Research Objective
2.3.4 Units, Currency, and Conversions
2.3.5 Industry Value Chain
2.4. Key Market Segments
2.5. Key Companies
2.6. Study Period
Chapter 3. Strategic Analysis Review
3.1. Processed Fruits Pricing Analysis and Forecast
3.2. Porter’s Five Forces
3.3. Market Ecosystem
3.4. SWOT Analysis
3.5. Regulatory Scenario
3.3. Effects of Inflation, Russia-Ukraine War, moderating economic growth, and other macroeconomic factors
Chapter 4. Competitive Landscape
4.1. Market Share Analysis
4.1.1. Global Processed Fruits Market Share by Company, 2023
4.1.2. Product Offerings of Leading Processed Fruits Companies
4.2. Market Entropy
4.2.1. New Product Launches in the Industry
4.2.2. Mergers, Acquisitions, Joint ventures, and Partnerships
4.3. Key Strategies and Best Practices
Chapter 5. Global Market Projections: Best, Reference, and Low Case Scenarios
5.1. Growth Analysis- Case Scenario Definitions
5.2. Low Growth Case Scenario Forecasts
5.3. Reference Growth Case Scenario Forecasts
5.4. High Growth Case Scenario Forecasts
Chapter 6. Market Dynamics
6.1. Processed Fruits Market Drivers
6.2. Processed Fruits Market Challenges
6.6. Processed Fruits Market Opportunities
6.4. Processed Fruits Market Trends
Chapter 7. Global Processed Fruits Market Outlook Trends
7.1. Global Processed Fruits Revenue (USD Million) and CAGR (%) by Type (2021-2032)
7.2. Global Processed Fruits Revenue (USD Million) and CAGR (%) by Application (2021-2032)
7.3. Global Processed Fruits Revenue (USD Million) and CAGR (%) by Product (2021-2032)
By Product
Fresh Cut
Canned Fruits
Frozen Fruits
By Distribution Channel
Offline
Online
Chapter 8. Global Processed Fruits Regional Analysis and Outlook
8.1. Global Processed Fruits Revenue (USD Million) By Regions (2021- 2032)
8.2. North America Processed Fruits Revenue (USD Million) by Country (2021-2032)
8.2.1. United States Processed Fruits Regional Analysis and Outlook
8.2.2. Canada Processed Fruits Regional Analysis and Outlook
8.2.3. Mexico Processed Fruits Regional Analysis and Outlook
8.3. Europe Processed Fruits Revenue (USD Million), by Country (2021-2032)
8.3.1. Germany Processed Fruits Regional Analysis and Outlook
8.3.2. France Processed Fruits Regional Analysis and Outlook
8.3.3. United Kingdom Processed Fruits Regional Analysis and Outlook
8.3.4. Spain Processed Fruits Regional Analysis and Outlook
8.3.5. Italy Processed Fruits Regional Analysis and Outlook
8.3.6. Russia Processed Fruits Regional Analysis and Outlook
8.3.7. Rest of Europe Processed Fruits Regional Analysis and Outlook
8.4. Asia Pacific Processed Fruits Revenue (USD Million) by Country (2021-2032)
8.4.1. China Processed Fruits Regional Analysis and Outlook
8.4.2. Japan Processed Fruits Regional Analysis and Outlook
8.4.3. India Processed Fruits Regional Analysis and Outlook
8.4.4. South Korea Processed Fruits Regional Analysis and Outlook
8.4.5. Australia Processed Fruits Regional Analysis and Outlook
8.4.6. South East Asia Processed Fruits Regional Analysis and Outlook
8.4.7. Rest of Asia Pacific Processed Fruits Regional Analysis and Outlook
8.5. South America Processed Fruits Revenue (USD Million), by Country (2021-2032)
8.5.1. Brazil Processed Fruits Regional Analysis and Outlook
8.5.2. Argentina Processed Fruits Regional Analysis and Outlook
8.5.3. Rest of South America Processed Fruits Regional Analysis and Outlook
8.6. Middle East and Africa Processed Fruits Revenue (USD Million) by Country (2021-2032)
8.6.1. Middle East Processed Fruits Regional Analysis and Outlook
8.6.2. Africa Processed Fruits Regional Analysis and Outlook
Chapter 9. North America Processed Fruits Analysis and Outlook
9.1. North America Processed Fruits Revenue (USD Million) by Segments (2021-2032)
9.1.1. North America Processed Fruits Revenue (USD Million) by Type (2021-2032)
9.1.2. North America Processed Fruits Revenue (USD Million) by Application (2021-2032)
9.1.3. North America Processed Fruits Revenue (USD Million) by Product (2021-2032)
By Product
Fresh Cut
Canned Fruits
Frozen Fruits
By Distribution Channel
Offline
Online
Chapter 10. Europe Processed Fruits Analysis and Outlook
10.1. Europe Processed Fruits Revenue (USD Million), by Segments (USD Million) (2021-2032)
10.1.1. Europe Processed Fruits Revenue (USD Million) by Type (2021-2032)
10.1.2. Europe Processed Fruits Revenue (USD Million) by Application (2021-2032)
10.1.3. Europe Processed Fruits Revenue (USD Million) by Product (2021-2032)
By Product
Fresh Cut
Canned Fruits
Frozen Fruits
By Distribution Channel
Offline
Online
Chapter 11. Asia Pacific Processed Fruits Analysis and Outlook
11.1. Asia Pacific Processed Fruits Revenue (USD Million), and Revenue (USD Million) by Segments (2021-2032)
11.1.1. Asia Pacific Processed Fruits Revenue (USD Million) by Type (2021-2032)
11.1.2. Asia Pacific Processed Fruits Revenue (USD Million) by Application (2021-2032)
11.1.3. Asia Pacific Processed Fruits Revenue (USD Million) by Product (2021-2032)
By Product
Fresh Cut
Canned Fruits
Frozen Fruits
By Distribution Channel
Offline
Online
Chapter 12. South America Processed Fruits Analysis and Outlook
12.1. South America Processed Fruits Revenue (USD Million), by Segments (2021-2032)
12.1.1. South America Processed Fruits Revenue (USD Million) by Type (2021-2032)
12.1.2. South America Processed Fruits Revenue (USD Million) by Application (2021-2032)
12.1.3. South America Processed Fruits Revenue (USD Million) by Product (2021-2032)
By Product
Fresh Cut
Canned Fruits
Frozen Fruits
By Distribution Channel
Offline
Online
Chapter 13. Middle East and Africa Processed Fruits Analysis and Outlook
13.1. Middle East and Africa Processed Fruits Revenue (USD Million), by Segments (2021-2032)
13.1.1. Middle East and Africa Processed Fruits Revenue (USD Million) by Type (2021-2032)
13.1.2. Middle East and Africa Processed Fruits Revenue (USD Million) by Application (2021-2032)
13.1.3. Middle East and Africa Processed Fruits Revenue (USD Million) by Product (2021-2032)
By Product
Fresh Cut
Canned Fruits
Frozen Fruits
By Distribution Channel
Offline
Online
Chapter 14. Processed Fruits Company Profiles
14.1 Business Overview
14.2 Product Profiles
14.3 SWOT Profiles
14.5 Recent Developments
14.6 Financial Profile
List of Companies
AGRANA Beteiligungs AG
Aohata Corp
Calavo Growers Inc
Capricorn Food Products India Ltd
CHB Group
Del Monte Food Inc
Delicia Foods India Pvt. Ltd
Dole Food Co. Inc
Mysore Fruit Products Pvt. Ltd
Ninos Fresh Cut Fruit and Veg LLC
Rhodes Food Group Holdings Ltd
Royal Ridge Fruits
Speyfruit Ltd
Sysco Corp
US Foods Holding Corp
15. Methodology and Data Sources
15.1 Customization Offerings
15.2 Subscription Services
15.3 Related Reports
15.4 Publisher Expertise
LIST OF TABLES
Table 1 Market Segmentation Analysis
Table 2 Global Processed Fruits Market Share of Leading Companies, 2023
Table 3 Product Offerings of Leading Companies
Table 4 Low Growth Scenario Forecasts
Table 5 Reference Case Growth Scenario
Table 6 High Growth Case Scenario
Table 7 Global Processed Fruits Revenue (USD Million) And CAGR (%) By Type (2021-2032)
Table 8 Global Processed Fruits Revenue (USD Million) And CAGR (%) By Application (2021-2032)
Table 9 Global Processed Fruits Revenue (USD Million) And CAGR (%) By Product (2021-2032)
Table 10 Global Processed Fruits Market Revenue (USD Million) By Regions (2021-2032)
Table 11 Global Processed Fruits Market Share (%) By Regions (2021-2032)
Table 12 North America Processed Fruits Revenue (USD Million) By Country (2021-2032)
Table 13 Europe Processed Fruits Revenue (USD Million) By Country (2021-2032)
Table 14 Asia Pacific Processed Fruits Revenue (USD Million) By Country (2021-2032)
Table 15 South America Processed Fruits Revenue (USD Million) By Country (2021-2032)
Table 16 Middle East and Africa Processed Fruits Revenue (USD Million) By Region (2021-2032)
Table 17 North America Processed Fruits Revenue (USD Million) By Type (2021-2032)
Table 18 North America Processed Fruits Revenue (USD Million) By Application (2021-2032)
Table 19 North America Processed Fruits Revenue (USD Million) By Product (2021-2032)
Table 20 Europe Processed Fruits Revenue (USD Million) By Type (2021-2032)
Table 21 Europe Processed Fruits Revenue (USD Million) By Application (2021-2032)
Table 22 Europe Processed Fruits Revenue (USD Million) By Product (2021-2032)
Table 23 Asia Pacific Processed Fruits Revenue (USD Million) By Type (2021-2032)
Table 24 Asia Pacific Processed Fruits Revenue (USD Million) By Application (2021-2032)
Table 25 Asia Pacific Processed Fruits Revenue (USD Million) By Product (2021-2032)
Table 26 South America Processed Fruits Revenue (USD Million) By Type (2021-2032)
Table 27 South America Processed Fruits Revenue (USD Million) By Application (2021-2032)
Table 28 South America Processed Fruits Revenue (USD Million) By Product (2021-2032)
Table 29 Middle East and Africa Processed Fruits Revenue (USD Million) By Type (2021-2032)
Table 30 Middle East and Africa Processed Fruits Revenue (USD Million) By Application (2021-2032)
Table 31 Middle East and Africa Processed Fruits Revenue (USD Million) By Product (2021-2032)
LIST OF FIGURES
Figure 1. Market Scope
Figure 2. Pricing Forecasts Per Unit, 2023- 2032
Figure 3. Porter’s Five Forces
Figure 4. Global Processed Fruits Market Revenue (USD Million) By Regions (2021-2032)
Figure 5. Global Processed Fruits Market Share (%) By Regions (2023)
Figure 6. North America Processed Fruits Revenue (USD Million) By Country (2021-2032)
Figure 7. United States Processed Fruits Revenue (USD Million) By Country (2021-2032)
Figure 8. Canada Processed Fruits Revenue (USD Million) By Country (2021-2032)
Figure 9. Mexico Processed Fruits Revenue (USD Million) By Country (2021-2032)
Figure 10. Europe Processed Fruits Revenue (USD Million) By Country (2021-2032)
Figure 11. Germany Processed Fruits Revenue (USD Million) By Country (2021-2032)
Figure 12. France Processed Fruits Revenue (USD Million) By Country (2021-2032)
Figure 13. United Kingdom Processed Fruits Revenue (USD Million) By Country (2021-2032)
Figure 14. Spain Processed Fruits Revenue (USD Million) By Country (2021-2032)
Figure 15. Italy Processed Fruits Revenue (USD Million) By Country (2021-2032)
Figure 16. Russia Processed Fruits Revenue (USD Million) By Country (2021-2032)
Figure 17. Rest of Europe Processed Fruits Revenue (USD Million) By Country (2021-2032)
Figure 11. Asia Pacific Processed Fruits Revenue (USD Million) By Country (2021-2032)
Figure 12. China Processed Fruits Revenue (USD Million) By Country (2021-2032)
Figure 13. Japan Processed Fruits Revenue (USD Million) By Country (2021-2032)
Figure 14. India Processed Fruits Revenue (USD Million) By Country (2021-2032)
Figure 15. South Korea Processed Fruits Revenue (USD Million) By Country (2021-2032)
Figure 16. Australia Processed Fruits Revenue (USD Million) By Country (2021-2032)
Figure 17. South East Asia Processed Fruits Revenue (USD Million) By Country (2021-2032)
Figure 18. South America Processed Fruits Revenue (USD Million) By Country (2021-2032)
Figure 19. Brazil Processed Fruits Revenue (USD Million) By Country (2021-2032)
Figure 20. Argentina Processed Fruits Revenue (USD Million) By Country (2021-2032)
Figure 21. Rest of Asia Pacific Processed Fruits Revenue (USD Million) By Country (2021-2032)
Figure 22. Middle East and Africa Processed Fruits Revenue (USD Million) By Region (2021-2032)
Figure 23. Saudi Arabia Processed Fruits Revenue (USD Million) By Region (2021-2032)
Figure 24. The UAE Processed Fruits Revenue (USD Million) By Region (2021-2032)
Figure 25. Rest of Middle East Processed Fruits Revenue (USD Million) By Region (2021-2032)
Figure 26. South Africa Processed Fruits Revenue (USD Million) By Region (2021-2032)
Figure 27. Africa Processed Fruits Revenue (USD Million) By Region (2021-2032)
Figure 28. North America Processed Fruits Revenue (USD Million) By Type (2021-2032)
Figure 29. North America Processed Fruits Revenue (USD Million) By Application (2021-2032)
Figure 30. North America Processed Fruits Revenue (USD Million) By Product (2021-2032)
Figure 31. Europe Processed Fruits Revenue (USD Million) By Type (2021-2032)
Figure 32. Europe Processed Fruits Revenue (USD Million) By Application (2021-2032)
Figure 33. Europe Processed Fruits Revenue (USD Million) By Product (2021-2032)
Figure 34. Asia Pacific Processed Fruits Revenue (USD Million) By Type (2021-2032)
Figure 35. Asia Pacific Processed Fruits Revenue (USD Million) By Application (2021-2032)
Figure 36. Asia Pacific Processed Fruits Revenue (USD Million) By Product (2021-2032)
Figure 37. South America Processed Fruits Revenue (USD Million) By Type (2021-2032)
Figure 38. South America Processed Fruits Revenue (USD Million) By Application (2021-2032)
Figure 39. South America Processed Fruits Revenue (USD Million) By Product (2021-2032)
Figure 40. Middle East and Africa Processed Fruits Revenue (USD Million) By Type (2021-2032)
Figure 41. Middle East and Africa Processed Fruits Revenue (USD Million) By Application (2021-2032)
Figure 42. Middle East and Africa Processed Fruits Revenue (USD Million) By Product (2021-2032)
By Product
Fresh Cut
Canned Fruits
Frozen Fruits
By Distribution Channel
Offline
Online
Countries Analyzed
North America (US, Canada, Mexico)
Europe (Germany, UK, France, Spain, Italy, Russia, Rest of Europe)
Asia Pacific (China, India, Japan, South Korea, Australia, South East Asia, Rest of Asia)
South America (Brazil, Argentina, Rest of South America)
Middle East and Africa (Saudi Arabia, UAE, Rest of Middle East, South Africa, Egypt, Rest of Africa)
