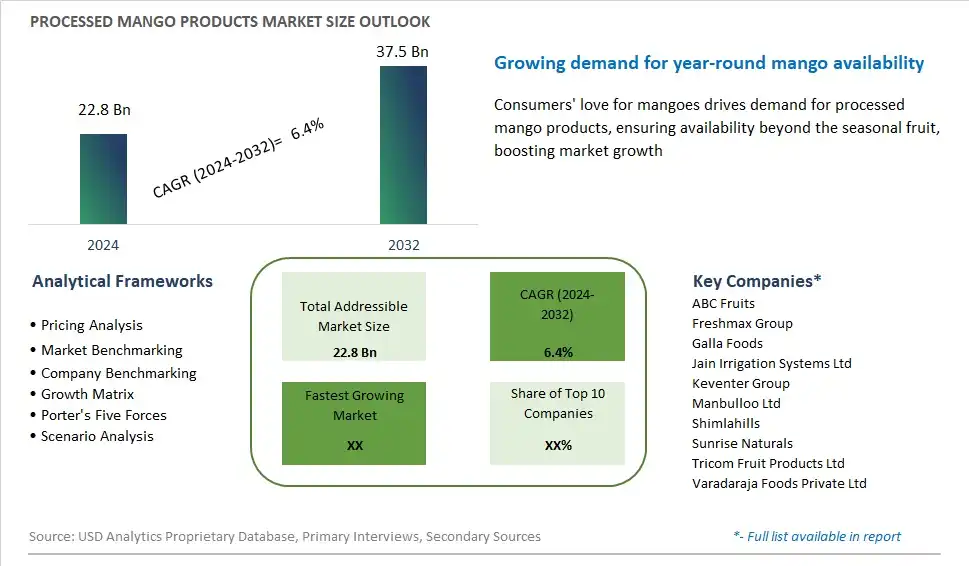
Global Processed Mango Products Market Size is valued at $22.8 Billion in 2024 and is forecast to register a growth rate (CAGR) of 6.4% to reach $37.5 Billion by 2032.
The global Processed Mango Products Market Comprehensive Study analyzes and forecasts the market size across 6 regions and 24 countries for diverse segments -By Product (Primary (Mango Powder, Mango Puree, Mango Pulp, Mango Concentrate), Secondary (Jam, Pickles, Juice, Candy, Squash, Others)), By Distribution Channel (Online, Offline)
An Introduction to Processed Mango Products Market
In 2024, the processed mango products market is thriving, driven by increasing global demand for the sweet and tropical flavor of mangoes in convenient and versatile forms. This market includes a variety of products, such as dried mango slices, mango puree, canned mango, mango juice, and mango-based snacks. Health-conscious consumers are drawn to processed mango products for their rich nutritional profile, including high levels of vitamins A and C, fiber, and antioxidants. The trend towards exotic and tropical flavors in food and beverages has significantly boosted the popularity of mango products. Innovations in processing and preservation technologies have enhanced the quality, taste, and shelf life of these products, making them a popular choice for snacks, desserts, and culinary applications. As consumers continue to seek nutritious and flavorful options, the processed mango products market is set for robust growth and diversification.
Processed Mango Products Competitive Landscape
The market report analyses the leading companies in the industry including ABC Fruits, Freshmax Group, Galla Foods, Jain Irrigation Systems Ltd, Keventer Group, Manbulloo Ltd, Shimlahills, Sunrise Naturals, Tricom Fruit Products Ltd, Varadaraja Foods Private Ltd, and Others.
Processed Mango Products Market Dynamics
Processed Mango Products Market Trend: Increasing Demand for Convenient and Exotic Fruit Products
The market for processed mango products is experiencing a prominent trend towards the increasing demand for convenient and exotic fruit products. This trend is driven by changing consumer preferences for convenient food options that offer unique flavors and experiences. Processed mango products, such as mango puree, dried mango slices, and mango nectar, provide consumers with the tropical taste of mangoes year-round, regardless of seasonal availability. As consumers seek out convenient and flavorful fruit options to incorporate into their diets, the market for processed mango products is witnessing steady growth and diversification to meet their needs.
Market Driver: Rising Popularity of Health and Wellness Trends
The rapid expansion of the processed mango products market is primarily driven by the rising popularity of health and wellness trends. Mangoes are rich in vitamins, minerals, and antioxidants, making them a sought-after ingredient for health-conscious consumers. Processed mango products offer a convenient way for consumers to enjoy the nutritional benefits of mangoes in various forms, including smoothies, snacks, and desserts. Moreover, mangoes are associated with numerous health benefits, including improved digestion, immune support, and skin health, further driving consumer interest in processed mango products as part of a balanced diet.
Market Opportunity: Innovation in Product Formulations and Packaging
One significant opportunity within the processed mango products market lies in innovation in product formulations and packaging to meet the evolving preferences and needs of consumers. Brands can differentiate themselves by offering a wider range of processed mango products, including mango-based sauces, jams, chutneys, and frozen mango chunks. Additionally, exploring innovative packaging formats such as single-serve pouches, resealable containers, and portion-controlled packs can enhance convenience and appeal to on-the-go consumers. Furthermore, leveraging consumer demand for organic, non-GMO, and sustainably sourced mangoes can create opportunities for premium and niche product offerings within the processed mango category. Collaborations with food technologists, flavor experts, and packaging specialists can drive product innovation and ensure that processed mango products meet the highest standards of quality, taste, and convenience. As the market for processed mango products continues to evolve, brands that prioritize innovation, sustainability, and consumer engagement are well-positioned to capitalize on the growing demand for convenient and nutritious mango-based products.
Processed Mango Products Market Share Analysis: Primary - Mango Pulp held the dominant market share in 2024
In the segmented landscape of the Processed Mango Products Market categorized by Product, Primary - Mango Pulp is the largest and most prevalent segment, driven by several key factors. Mango pulp serves as a versatile ingredient used in various food and beverage applications, including juices, smoothies, ice creams, yogurts, and desserts. Its rich flavor, vibrant color, and natural sweetness make it a popular choice among consumers and food manufacturers alike. Further, mango pulp offers convenience and consistency, eliminating the need for peeling, slicing, and pureeing fresh mangoes. Additionally, the growing demand for tropical flavors and exotic fruit-based products fuels the growth of the Mango Pulp segment. As consumers seek authentic and high-quality mango products for their culinary creations, the dominance of Mango Pulp in the Processed Mango Products Market is expected to persist, driving overall market sales and growth.
Processed Mango Products Market Share Analysis: Online Distribution market is poised to register the fastest growth rae over the forecast period to 2032
In the evolving landscape of the Processed Mango Products Market segmented by Distribution Channel, the Online segment is the fastest-growing player, driven by shifting consumer preferences towards convenience, accessibility, and digitalization. Online distribution channels offer consumers the convenience of purchasing processed mango products from the comfort of their homes, eliminating the need for physical store visits. Further, the proliferation of e-commerce platforms and digital marketplaces has expanded the reach of processed mango products to a broader audience, including consumers in remote areas. Additionally, the COVID-19 pandemic has accelerated the adoption of online shopping habits, further propelling the growth of the Online Distribution segment. As consumers continue to prioritize convenience and safety in their purchasing behaviors, the Online Distribution channel is poised to sustain its rapid growth trajectory in the Processed Mango Products Market.
Processed Mango Products Market Segmentation
By Product
Primary
-Mango Powder
-Mango Puree
-Mango Pulp
-Mango Concentrate
Secondary
-Jam
-Pickles
-Juice
-Candy
-Squash
-Others
By Distribution Channel
Online
Offline
Countries Analyzed
North America (US, Canada, Mexico)
Europe (Germany, UK, France, Spain, Italy, Russia, Rest of Europe)
Asia Pacific (China, India, Japan, South Korea, Australia, South East Asia, Rest of Asia)
South America (Brazil, Argentina, Rest of South America)
Middle East and Africa (Saudi Arabia, UAE, Rest of Middle East, South Africa, Egypt, Rest of Africa)
Processed Mango Products Companies Profiled in the Study
ABC Fruits
Freshmax Group
Galla Foods
Jain Irrigation Systems Ltd
Keventer Group
Manbulloo Ltd
Shimlahills
Sunrise Naturals
Tricom Fruit Products Ltd
Varadaraja Foods Private Ltd
*- List Not Exhaustive
Chapter 1. TABLE OF CONTENTS
Chapter 2. Introduction to Processed Mango Products Market
2.1. Market Overview
2.2. Key Statistics and Report Highlights
2.3. Scope of the Comprehensive Study
2.3.1. Market Definition
2.3.2 Countries and Regions Covered
2.3.3 Research Objective
2.3.4 Units, Currency, and Conversions
2.3.5 Industry Value Chain
2.4. Key Market Segments
2.5. Key Companies
2.6. Study Period
Chapter 3. Strategic Analysis Review
3.1. Processed Mango Products Pricing Analysis and Forecast
3.2. Porter’s Five Forces
3.3. Market Ecosystem
3.4. SWOT Analysis
3.5. Regulatory Scenario
3.3. Effects of Inflation, Russia-Ukraine War, moderating economic growth, and other macroeconomic factors
Chapter 4. Competitive Landscape
4.1. Market Share Analysis
4.1.1. Global Processed Mango Products Market Share by Company, 2023
4.1.2. Product Offerings of Leading Processed Mango Products Companies
4.2. Market Entropy
4.2.1. New Product Launches in the Industry
4.2.2. Mergers, Acquisitions, Joint ventures, and Partnerships
4.3. Key Strategies and Best Practices
Chapter 5. Global Market Projections: Best, Reference, and Low Case Scenarios
5.1. Growth Analysis- Case Scenario Definitions
5.2. Low Growth Case Scenario Forecasts
5.3. Reference Growth Case Scenario Forecasts
5.4. High Growth Case Scenario Forecasts
Chapter 6. Market Dynamics
6.1. Processed Mango Products Market Drivers
6.2. Processed Mango Products Market Challenges
6.6. Processed Mango Products Market Opportunities
6.4. Processed Mango Products Market Trends
Chapter 7. Global Processed Mango Products Market Outlook Trends
7.1. Global Processed Mango Products Revenue (USD Million) and CAGR (%) by Type (2021-2032)
7.2. Global Processed Mango Products Revenue (USD Million) and CAGR (%) by Application (2021-2032)
7.3. Global Processed Mango Products Revenue (USD Million) and CAGR (%) by Product (2021-2032)
By Product
Primary
-Mango Powder
-Mango Puree
-Mango Pulp
-Mango Concentrate
Secondary
-Jam
-Pickles
-Juice
-Candy
-Squash
-Others
By Distribution Channel
Online
Offline
Chapter 8. Global Processed Mango Products Regional Analysis and Outlook
8.1. Global Processed Mango Products Revenue (USD Million) By Regions (2021- 2032)
8.2. North America Processed Mango Products Revenue (USD Million) by Country (2021-2032)
8.2.1. United States Processed Mango Products Regional Analysis and Outlook
8.2.2. Canada Processed Mango Products Regional Analysis and Outlook
8.2.3. Mexico Processed Mango Products Regional Analysis and Outlook
8.3. Europe Processed Mango Products Revenue (USD Million), by Country (2021-2032)
8.3.1. Germany Processed Mango Products Regional Analysis and Outlook
8.3.2. France Processed Mango Products Regional Analysis and Outlook
8.3.3. United Kingdom Processed Mango Products Regional Analysis and Outlook
8.3.4. Spain Processed Mango Products Regional Analysis and Outlook
8.3.5. Italy Processed Mango Products Regional Analysis and Outlook
8.3.6. Russia Processed Mango Products Regional Analysis and Outlook
8.3.7. Rest of Europe Processed Mango Products Regional Analysis and Outlook
8.4. Asia Pacific Processed Mango Products Revenue (USD Million) by Country (2021-2032)
8.4.1. China Processed Mango Products Regional Analysis and Outlook
8.4.2. Japan Processed Mango Products Regional Analysis and Outlook
8.4.3. India Processed Mango Products Regional Analysis and Outlook
8.4.4. South Korea Processed Mango Products Regional Analysis and Outlook
8.4.5. Australia Processed Mango Products Regional Analysis and Outlook
8.4.6. South East Asia Processed Mango Products Regional Analysis and Outlook
8.4.7. Rest of Asia Pacific Processed Mango Products Regional Analysis and Outlook
8.5. South America Processed Mango Products Revenue (USD Million), by Country (2021-2032)
8.5.1. Brazil Processed Mango Products Regional Analysis and Outlook
8.5.2. Argentina Processed Mango Products Regional Analysis and Outlook
8.5.3. Rest of South America Processed Mango Products Regional Analysis and Outlook
8.6. Middle East and Africa Processed Mango Products Revenue (USD Million) by Country (2021-2032)
8.6.1. Middle East Processed Mango Products Regional Analysis and Outlook
8.6.2. Africa Processed Mango Products Regional Analysis and Outlook
Chapter 9. North America Processed Mango Products Analysis and Outlook
9.1. North America Processed Mango Products Revenue (USD Million) by Segments (2021-2032)
9.1.1. North America Processed Mango Products Revenue (USD Million) by Type (2021-2032)
9.1.2. North America Processed Mango Products Revenue (USD Million) by Application (2021-2032)
9.1.3. North America Processed Mango Products Revenue (USD Million) by Product (2021-2032)
By Product
Primary
-Mango Powder
-Mango Puree
-Mango Pulp
-Mango Concentrate
Secondary
-Jam
-Pickles
-Juice
-Candy
-Squash
-Others
By Distribution Channel
Online
Offline
Chapter 10. Europe Processed Mango Products Analysis and Outlook
10.1. Europe Processed Mango Products Revenue (USD Million), by Segments (USD Million) (2021-2032)
10.1.1. Europe Processed Mango Products Revenue (USD Million) by Type (2021-2032)
10.1.2. Europe Processed Mango Products Revenue (USD Million) by Application (2021-2032)
10.1.3. Europe Processed Mango Products Revenue (USD Million) by Product (2021-2032)
By Product
Primary
-Mango Powder
-Mango Puree
-Mango Pulp
-Mango Concentrate
Secondary
-Jam
-Pickles
-Juice
-Candy
-Squash
-Others
By Distribution Channel
Online
Offline
Chapter 11. Asia Pacific Processed Mango Products Analysis and Outlook
11.1. Asia Pacific Processed Mango Products Revenue (USD Million), and Revenue (USD Million) by Segments (2021-2032)
11.1.1. Asia Pacific Processed Mango Products Revenue (USD Million) by Type (2021-2032)
11.1.2. Asia Pacific Processed Mango Products Revenue (USD Million) by Application (2021-2032)
11.1.3. Asia Pacific Processed Mango Products Revenue (USD Million) by Product (2021-2032)
By Product
Primary
-Mango Powder
-Mango Puree
-Mango Pulp
-Mango Concentrate
Secondary
-Jam
-Pickles
-Juice
-Candy
-Squash
-Others
By Distribution Channel
Online
Offline
Chapter 12. South America Processed Mango Products Analysis and Outlook
12.1. South America Processed Mango Products Revenue (USD Million), by Segments (2021-2032)
12.1.1. South America Processed Mango Products Revenue (USD Million) by Type (2021-2032)
12.1.2. South America Processed Mango Products Revenue (USD Million) by Application (2021-2032)
12.1.3. South America Processed Mango Products Revenue (USD Million) by Product (2021-2032)
By Product
Primary
-Mango Powder
-Mango Puree
-Mango Pulp
-Mango Concentrate
Secondary
-Jam
-Pickles
-Juice
-Candy
-Squash
-Others
By Distribution Channel
Online
Offline
Chapter 13. Middle East and Africa Processed Mango Products Analysis and Outlook
13.1. Middle East and Africa Processed Mango Products Revenue (USD Million), by Segments (2021-2032)
13.1.1. Middle East and Africa Processed Mango Products Revenue (USD Million) by Type (2021-2032)
13.1.2. Middle East and Africa Processed Mango Products Revenue (USD Million) by Application (2021-2032)
13.1.3. Middle East and Africa Processed Mango Products Revenue (USD Million) by Product (2021-2032)
By Product
Primary
-Mango Powder
-Mango Puree
-Mango Pulp
-Mango Concentrate
Secondary
-Jam
-Pickles
-Juice
-Candy
-Squash
-Others
By Distribution Channel
Online
Offline
Chapter 14. Processed Mango Products Company Profiles
14.1 Business Overview
14.2 Product Profiles
14.3 SWOT Profiles
14.5 Recent Developments
14.6 Financial Profile
List of Companies
ABC Fruits
Freshmax Group
Galla Foods
Jain Irrigation Systems Ltd
Keventer Group
Manbulloo Ltd
Shimlahills
Sunrise Naturals
Tricom Fruit Products Ltd
Varadaraja Foods Private Ltd
15. Methodology and Data Sources
15.1 Customization Offerings
15.2 Subscription Services
15.3 Related Reports
15.4 Publisher Expertise
LIST OF TABLES
Table 1 Market Segmentation Analysis
Table 2 Global Processed Mango Products Market Share of Leading Companies, 2023
Table 3 Product Offerings of Leading Companies
Table 4 Low Growth Scenario Forecasts
Table 5 Reference Case Growth Scenario
Table 6 High Growth Case Scenario
Table 7 Global Processed Mango Products Revenue (USD Million) And CAGR (%) By Type (2021-2032)
Table 8 Global Processed Mango Products Revenue (USD Million) And CAGR (%) By Application (2021-2032)
Table 9 Global Processed Mango Products Revenue (USD Million) And CAGR (%) By Product (2021-2032)
Table 10 Global Processed Mango Products Market Revenue (USD Million) By Regions (2021-2032)
Table 11 Global Processed Mango Products Market Share (%) By Regions (2021-2032)
Table 12 North America Processed Mango Products Revenue (USD Million) By Country (2021-2032)
Table 13 Europe Processed Mango Products Revenue (USD Million) By Country (2021-2032)
Table 14 Asia Pacific Processed Mango Products Revenue (USD Million) By Country (2021-2032)
Table 15 South America Processed Mango Products Revenue (USD Million) By Country (2021-2032)
Table 16 Middle East and Africa Processed Mango Products Revenue (USD Million) By Region (2021-2032)
Table 17 North America Processed Mango Products Revenue (USD Million) By Type (2021-2032)
Table 18 North America Processed Mango Products Revenue (USD Million) By Application (2021-2032)
Table 19 North America Processed Mango Products Revenue (USD Million) By Product (2021-2032)
Table 20 Europe Processed Mango Products Revenue (USD Million) By Type (2021-2032)
Table 21 Europe Processed Mango Products Revenue (USD Million) By Application (2021-2032)
Table 22 Europe Processed Mango Products Revenue (USD Million) By Product (2021-2032)
Table 23 Asia Pacific Processed Mango Products Revenue (USD Million) By Type (2021-2032)
Table 24 Asia Pacific Processed Mango Products Revenue (USD Million) By Application (2021-2032)
Table 25 Asia Pacific Processed Mango Products Revenue (USD Million) By Product (2021-2032)
Table 26 South America Processed Mango Products Revenue (USD Million) By Type (2021-2032)
Table 27 South America Processed Mango Products Revenue (USD Million) By Application (2021-2032)
Table 28 South America Processed Mango Products Revenue (USD Million) By Product (2021-2032)
Table 29 Middle East and Africa Processed Mango Products Revenue (USD Million) By Type (2021-2032)
Table 30 Middle East and Africa Processed Mango Products Revenue (USD Million) By Application (2021-2032)
Table 31 Middle East and Africa Processed Mango Products Revenue (USD Million) By Product (2021-2032)
LIST OF FIGURES
Figure 1. Market Scope
Figure 2. Pricing Forecasts Per Unit, 2023- 2032
Figure 3. Porter’s Five Forces
Figure 4. Global Processed Mango Products Market Revenue (USD Million) By Regions (2021-2032)
Figure 5. Global Processed Mango Products Market Share (%) By Regions (2023)
Figure 6. North America Processed Mango Products Revenue (USD Million) By Country (2021-2032)
Figure 7. United States Processed Mango Products Revenue (USD Million) By Country (2021-2032)
Figure 8. Canada Processed Mango Products Revenue (USD Million) By Country (2021-2032)
Figure 9. Mexico Processed Mango Products Revenue (USD Million) By Country (2021-2032)
Figure 10. Europe Processed Mango Products Revenue (USD Million) By Country (2021-2032)
Figure 11. Germany Processed Mango Products Revenue (USD Million) By Country (2021-2032)
Figure 12. France Processed Mango Products Revenue (USD Million) By Country (2021-2032)
Figure 13. United Kingdom Processed Mango Products Revenue (USD Million) By Country (2021-2032)
Figure 14. Spain Processed Mango Products Revenue (USD Million) By Country (2021-2032)
Figure 15. Italy Processed Mango Products Revenue (USD Million) By Country (2021-2032)
Figure 16. Russia Processed Mango Products Revenue (USD Million) By Country (2021-2032)
Figure 17. Rest of Europe Processed Mango Products Revenue (USD Million) By Country (2021-2032)
Figure 11. Asia Pacific Processed Mango Products Revenue (USD Million) By Country (2021-2032)
Figure 12. China Processed Mango Products Revenue (USD Million) By Country (2021-2032)
Figure 13. Japan Processed Mango Products Revenue (USD Million) By Country (2021-2032)
Figure 14. India Processed Mango Products Revenue (USD Million) By Country (2021-2032)
Figure 15. South Korea Processed Mango Products Revenue (USD Million) By Country (2021-2032)
Figure 16. Australia Processed Mango Products Revenue (USD Million) By Country (2021-2032)
Figure 17. South East Asia Processed Mango Products Revenue (USD Million) By Country (2021-2032)
Figure 18. South America Processed Mango Products Revenue (USD Million) By Country (2021-2032)
Figure 19. Brazil Processed Mango Products Revenue (USD Million) By Country (2021-2032)
Figure 20. Argentina Processed Mango Products Revenue (USD Million) By Country (2021-2032)
Figure 21. Rest of Asia Pacific Processed Mango Products Revenue (USD Million) By Country (2021-2032)
Figure 22. Middle East and Africa Processed Mango Products Revenue (USD Million) By Region (2021-2032)
Figure 23. Saudi Arabia Processed Mango Products Revenue (USD Million) By Region (2021-2032)
Figure 24. The UAE Processed Mango Products Revenue (USD Million) By Region (2021-2032)
Figure 25. Rest of Middle East Processed Mango Products Revenue (USD Million) By Region (2021-2032)
Figure 26. South Africa Processed Mango Products Revenue (USD Million) By Region (2021-2032)
Figure 27. Africa Processed Mango Products Revenue (USD Million) By Region (2021-2032)
Figure 28. North America Processed Mango Products Revenue (USD Million) By Type (2021-2032)
Figure 29. North America Processed Mango Products Revenue (USD Million) By Application (2021-2032)
Figure 30. North America Processed Mango Products Revenue (USD Million) By Product (2021-2032)
Figure 31. Europe Processed Mango Products Revenue (USD Million) By Type (2021-2032)
Figure 32. Europe Processed Mango Products Revenue (USD Million) By Application (2021-2032)
Figure 33. Europe Processed Mango Products Revenue (USD Million) By Product (2021-2032)
Figure 34. Asia Pacific Processed Mango Products Revenue (USD Million) By Type (2021-2032)
Figure 35. Asia Pacific Processed Mango Products Revenue (USD Million) By Application (2021-2032)
Figure 36. Asia Pacific Processed Mango Products Revenue (USD Million) By Product (2021-2032)
Figure 37. South America Processed Mango Products Revenue (USD Million) By Type (2021-2032)
Figure 38. South America Processed Mango Products Revenue (USD Million) By Application (2021-2032)
Figure 39. South America Processed Mango Products Revenue (USD Million) By Product (2021-2032)
Figure 40. Middle East and Africa Processed Mango Products Revenue (USD Million) By Type (2021-2032)
Figure 41. Middle East and Africa Processed Mango Products Revenue (USD Million) By Application (2021-2032)
Figure 42. Middle East and Africa Processed Mango Products Revenue (USD Million) By Product (2021-2032)
By Product
Primary
-Mango Powder
-Mango Puree
-Mango Pulp
-Mango Concentrate
Secondary
-Jam
-Pickles
-Juice
-Candy
-Squash
-Others
By Distribution Channel
Online
Offline
Countries Analyzed
North America (US, Canada, Mexico)
Europe (Germany, UK, France, Spain, Italy, Russia, Rest of Europe)
Asia Pacific (China, India, Japan, South Korea, Australia, South East Asia, Rest of Asia)
South America (Brazil, Argentina, Rest of South America)
Middle East and Africa (Saudi Arabia, UAE, Rest of Middle East, South Africa, Egypt, Rest of Africa)
