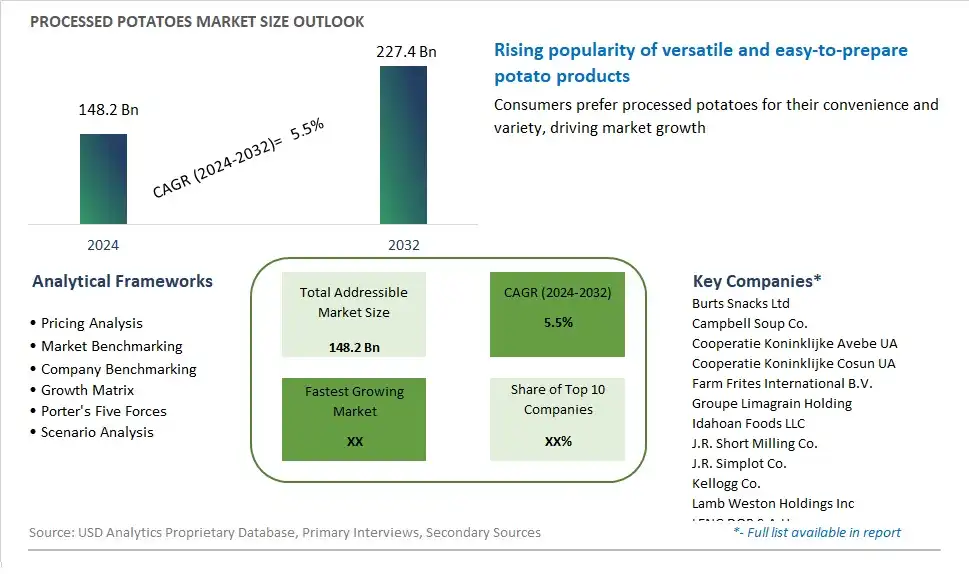
Global Processed Potatoes Market Size is valued at $148.2 Billion in 2024 and is forecast to register a growth rate (CAGR) of 5.5% to reach $227.4 Billion by 2032.
The global Processed Potatoes Market Comprehensive Study analyzes and forecasts the market size across 6 regions and 24 countries for diverse segments -By Type (Positive Temperature Coefficient (PTC), Potato Chips, Potato Flakes, Potato Starch, Frozen French Fries, Others), By Application (Ready to Cook Products, Prepared Meals, Snacks, Others), By Distribution Channel (Online, Offline)
An Introduction to Processed Potatoes Market
In 2024, the market for processed potatoes continues to evolve as consumers seek convenient and innovative potato-based products that offer convenience and versatility in meal preparation. Processed potatoes encompass a wide range of forms, including frozen French fries, potato chips, dehydrated mashed potatoes, potato flakes, and pre-cut potato products, catering to diverse culinary preferences and dietary needs. With busy lifestyles and changing eating habits, consumers are increasingly turning to processed potato products for quick and easy meal solutions without compromising on taste or quality. Moreover, manufacturers are responding to consumer demand for healthier options by introducing baked, air-fried, and low-sodium varieties of processed potato products, reflecting ongoing trends towards health-conscious eating and snacking.
Processed Potatoes Competitive Landscape
The market report analyses the leading companies in the industry including Burts Snacks Ltd, Campbell Soup Co., Cooperatie Koninklijke Avebe UA, Cooperatie Koninklijke Cosun UA, Farm Frites International B.V., Groupe Limagrain Holding, Idahoan Foods LLC, J.R. Short Milling Co., J.R. Simplot Co., Kellogg Co., Lamb Weston Holdings Inc, LENG DOR S.A.U., McCain Foods Ltd, Old Dutch Foods Ltd, PepsiCo Inc, and Others.
Processed Potatoes Market Dynamics
Processed Potatoes Market Trend: Growing Popularity of Convenience Foods
The most prominent trend in the processed potatoes market is the growing popularity of convenience foods. As modern lifestyles become increasingly busy, consumers are seeking out quick and easy meal solutions. Processed potato products, such as frozen fries, potato chips, instant mashed potatoes, and ready-to-cook potato meals, are becoming staples in households due to their convenience, ease of preparation, and long shelf life. This trend is further driven by the rise of fast food culture and the increasing prevalence of quick-service restaurants that heavily rely on processed potato products. Additionally, advancements in food processing technology have improved the quality and variety of processed potato offerings, making them more appealing to consumers. This trend reflects a broader shift towards convenience-oriented food consumption patterns in both developed and developing regions.
Market Driver: Rising Demand for Processed Snack Foods
A key driver in the processed potatoes market is the rising demand for processed snack foods. As snacking becomes a more integral part of daily diets, especially among younger demographics, the consumption of potato-based snacks has surged. The versatility of potatoes allows for a wide range of snack products, from traditional chips and crisps to innovative offerings like flavored fries and potato wedges. This demand is fueled by aggressive marketing campaigns, product innovations, and the introduction of healthier snack options, such as baked or low-fat potato products. Furthermore, the growing trend of at-home entertainment and social gatherings has increased the purchase of snack foods, positioning processed potatoes as a convenient and popular choice. The snacking culture, combined with the global reach of potato-based products, ensures sustained demand and robust market growth.
Market Opportunity: Expansion into Health-Conscious and Emerging Markets
A significant opportunity in the processed potatoes market lies in expanding into health-conscious and emerging markets. With the increasing awareness of health and wellness, there is a growing consumer segment that prefers healthier alternatives to traditional potato snacks. Companies can capitalize on this by developing and promoting products that are low in fat, high in fiber, or fortified with additional nutrients. The use of natural ingredients and clean labeling can also attract health-conscious consumers. Additionally, emerging markets in Asia, Latin America, and Africa present substantial growth opportunities due to rising disposable incomes, urbanization, and changing dietary preferences. By tailoring products to meet local tastes and establishing robust distribution networks, companies can tap into these rapidly expanding markets. Strategic partnerships, localized marketing campaigns, and investment in local production facilities can further enhance market penetration and drive significant growth in these regions.
Processed Potatoes Market Share Analysis: Frozen French Fries held the dominant market share in 2024
Within the processed potatoes market, Frozen French Fries stand out as the largest segment, and this can be attributed to several factors. Firstly, Frozen French Fries have gained immense popularity due to their widespread consumption as a convenient and versatile food item across various demographics globally. Their appeal lies in their quick and easy preparation, making them a go-to option for busy households and food service establishments alike. Additionally, Frozen French Fries are favored for their crispy texture and savory flavor, appealing to consumers' taste preferences. Further, the rise of fast-food chains and the increasing trend of dining out have significantly contributed to the demand for Frozen French Fries as a staple menu item in restaurants and fast-food outlets. Furthermore, the growing trend of home cooking and the availability of frozen food products in supermarkets have further bolstered the market for Frozen French Fries. Overall, these factors combined have propelled Frozen French Fries to emerge as the largest segment within the processed potatoes market, showcasing sustained growth and market dominance.
Processed Potatoes Market Share Analysis: Snacks market is poised to register the fastest growth rae over the forecast period to 2032
In the processed potatoes market segmented by application, the Snacks category is the fastest-growing segment, fueled by evolving consumer preferences and lifestyle changes. Snacking has become an integral part of modern dietary habits, driven by factors such as busy schedules, on-the-go lifestyles, and the increasing demand for convenient yet satisfying food options. Processed potato-based snacks, including potato chips, crisps, and other innovative snack varieties, have gained significant traction due to their portability, flavor diversity, and indulgent appeal. Further, manufacturers are constantly innovating to meet the growing demand for healthier snack alternatives, offering baked or air-fried potato snacks with reduced fat and sodium content to cater to health-conscious consumers. Additionally, the rising popularity of snacking occasions beyond traditional meal times, such as mid-morning or late-night snacking, further drives the demand for processed potato snacks. As a result, the Snacks segment within the processed potatoes market is experiencing rapid growth, presenting lucrative opportunities for businesses to capitalize on the expanding snacking culture and consumer preferences.
Processed Potatoes Market Share Analysis: Offline Distribution held the dominant market share in 2024
In the processed potatoes market categorized by distribution channels, the Offline segment is the largest, primarily due to the entrenched presence of traditional retail channels such as supermarkets, hypermarkets, convenience stores, and specialty food stores. Offline distribution channels have historically dominated the market, offering consumers a tangible shopping experience where they can physically inspect and purchase products. Additionally, offline retailers often benefit from established networks, extensive shelf space, and strategic placement within high-traffic locations, contributing to higher visibility and accessibility for consumers. Further, the human element in offline retail, including personalized customer service and interaction, fosters trust and loyalty among consumers. Despite the rapid growth of online shopping platforms, offline distribution channels continue to maintain their dominance in the processed potatoes market, leveraging their strong infrastructure, brand partnerships, and customer relationships to sustain market leadership.
Processed Potatoes Market Segmentation
By Type
Positive Temperature Coefficient (PTC)
Potato Chips
Potato Flakes
Potato Starch
Frozen French Fries
Others
By Application
Ready to Cook Products
Prepared Meals
Snacks
Others
By Distribution Channel
Online
Offline
Countries Analyzed
North America (US, Canada, Mexico)
Europe (Germany, UK, France, Spain, Italy, Russia, Rest of Europe)
Asia Pacific (China, India, Japan, South Korea, Australia, South East Asia, Rest of Asia)
South America (Brazil, Argentina, Rest of South America)
Middle East and Africa (Saudi Arabia, UAE, Rest of Middle East, South Africa, Egypt, Rest of Africa)
Processed Potatoes Companies Profiled in the Study
Burts Snacks Ltd
Campbell Soup Co.
Cooperatie Koninklijke Avebe UA
Cooperatie Koninklijke Cosun UA
Farm Frites International B.V.
Groupe Limagrain Holding
Idahoan Foods LLC
J.R. Short Milling Co.
J.R. Simplot Co.
Kellogg Co.
Lamb Weston Holdings Inc
LENG DOR S.A.U.
McCain Foods Ltd
Old Dutch Foods Ltd
PepsiCo Inc
*- List Not Exhaustive
Chapter 1. TABLE OF CONTENTS
Chapter 2. Introduction to Processed Potatoes Market
2.1. Market Overview
2.2. Key Statistics and Report Highlights
2.3. Scope of the Comprehensive Study
2.3.1. Market Definition
2.3.2 Countries and Regions Covered
2.3.3 Research Objective
2.3.4 Units, Currency, and Conversions
2.3.5 Industry Value Chain
2.4. Key Market Segments
2.5. Key Companies
2.6. Study Period
Chapter 3. Strategic Analysis Review
3.1. Processed Potatoes Pricing Analysis and Forecast
3.2. Porter’s Five Forces
3.3. Market Ecosystem
3.4. SWOT Analysis
3.5. Regulatory Scenario
3.3. Effects of Inflation, Russia-Ukraine War, moderating economic growth, and other macroeconomic factors
Chapter 4. Competitive Landscape
4.1. Market Share Analysis
4.1.1. Global Processed Potatoes Market Share by Company, 2023
4.1.2. Product Offerings of Leading Processed Potatoes Companies
4.2. Market Entropy
4.2.1. New Product Launches in the Industry
4.2.2. Mergers, Acquisitions, Joint ventures, and Partnerships
4.3. Key Strategies and Best Practices
Chapter 5. Global Market Projections: Best, Reference, and Low Case Scenarios
5.1. Growth Analysis- Case Scenario Definitions
5.2. Low Growth Case Scenario Forecasts
5.3. Reference Growth Case Scenario Forecasts
5.4. High Growth Case Scenario Forecasts
Chapter 6. Market Dynamics
6.1. Processed Potatoes Market Drivers
6.2. Processed Potatoes Market Challenges
6.6. Processed Potatoes Market Opportunities
6.4. Processed Potatoes Market Trends
Chapter 7. Global Processed Potatoes Market Outlook Trends
7.1. Global Processed Potatoes Revenue (USD Million) and CAGR (%) by Type (2021-2032)
7.2. Global Processed Potatoes Revenue (USD Million) and CAGR (%) by Application (2021-2032)
7.3. Global Processed Potatoes Revenue (USD Million) and CAGR (%) by Product (2021-2032)
By Type
Positive Temperature Coefficient (PTC)
Potato Chips
Potato Flakes
Potato Starch
Frozen French Fries
Others
By Application
Ready to Cook Products
Prepared Meals
Snacks
Others
By Distribution Channel
Online
Offline
Chapter 8. Global Processed Potatoes Regional Analysis and Outlook
8.1. Global Processed Potatoes Revenue (USD Million) By Regions (2021- 2032)
8.2. North America Processed Potatoes Revenue (USD Million) by Country (2021-2032)
8.2.1. United States Processed Potatoes Regional Analysis and Outlook
8.2.2. Canada Processed Potatoes Regional Analysis and Outlook
8.2.3. Mexico Processed Potatoes Regional Analysis and Outlook
8.3. Europe Processed Potatoes Revenue (USD Million), by Country (2021-2032)
8.3.1. Germany Processed Potatoes Regional Analysis and Outlook
8.3.2. France Processed Potatoes Regional Analysis and Outlook
8.3.3. United Kingdom Processed Potatoes Regional Analysis and Outlook
8.3.4. Spain Processed Potatoes Regional Analysis and Outlook
8.3.5. Italy Processed Potatoes Regional Analysis and Outlook
8.3.6. Russia Processed Potatoes Regional Analysis and Outlook
8.3.7. Rest of Europe Processed Potatoes Regional Analysis and Outlook
8.4. Asia Pacific Processed Potatoes Revenue (USD Million) by Country (2021-2032)
8.4.1. China Processed Potatoes Regional Analysis and Outlook
8.4.2. Japan Processed Potatoes Regional Analysis and Outlook
8.4.3. India Processed Potatoes Regional Analysis and Outlook
8.4.4. South Korea Processed Potatoes Regional Analysis and Outlook
8.4.5. Australia Processed Potatoes Regional Analysis and Outlook
8.4.6. South East Asia Processed Potatoes Regional Analysis and Outlook
8.4.7. Rest of Asia Pacific Processed Potatoes Regional Analysis and Outlook
8.5. South America Processed Potatoes Revenue (USD Million), by Country (2021-2032)
8.5.1. Brazil Processed Potatoes Regional Analysis and Outlook
8.5.2. Argentina Processed Potatoes Regional Analysis and Outlook
8.5.3. Rest of South America Processed Potatoes Regional Analysis and Outlook
8.6. Middle East and Africa Processed Potatoes Revenue (USD Million) by Country (2021-2032)
8.6.1. Middle East Processed Potatoes Regional Analysis and Outlook
8.6.2. Africa Processed Potatoes Regional Analysis and Outlook
Chapter 9. North America Processed Potatoes Analysis and Outlook
9.1. North America Processed Potatoes Revenue (USD Million) by Segments (2021-2032)
9.1.1. North America Processed Potatoes Revenue (USD Million) by Type (2021-2032)
9.1.2. North America Processed Potatoes Revenue (USD Million) by Application (2021-2032)
9.1.3. North America Processed Potatoes Revenue (USD Million) by Product (2021-2032)
By Type
Positive Temperature Coefficient (PTC)
Potato Chips
Potato Flakes
Potato Starch
Frozen French Fries
Others
By Application
Ready to Cook Products
Prepared Meals
Snacks
Others
By Distribution Channel
Online
Offline
Chapter 10. Europe Processed Potatoes Analysis and Outlook
10.1. Europe Processed Potatoes Revenue (USD Million), by Segments (USD Million) (2021-2032)
10.1.1. Europe Processed Potatoes Revenue (USD Million) by Type (2021-2032)
10.1.2. Europe Processed Potatoes Revenue (USD Million) by Application (2021-2032)
10.1.3. Europe Processed Potatoes Revenue (USD Million) by Product (2021-2032)
By Type
Positive Temperature Coefficient (PTC)
Potato Chips
Potato Flakes
Potato Starch
Frozen French Fries
Others
By Application
Ready to Cook Products
Prepared Meals
Snacks
Others
By Distribution Channel
Online
Offline
Chapter 11. Asia Pacific Processed Potatoes Analysis and Outlook
11.1. Asia Pacific Processed Potatoes Revenue (USD Million), and Revenue (USD Million) by Segments (2021-2032)
11.1.1. Asia Pacific Processed Potatoes Revenue (USD Million) by Type (2021-2032)
11.1.2. Asia Pacific Processed Potatoes Revenue (USD Million) by Application (2021-2032)
11.1.3. Asia Pacific Processed Potatoes Revenue (USD Million) by Product (2021-2032)
By Type
Positive Temperature Coefficient (PTC)
Potato Chips
Potato Flakes
Potato Starch
Frozen French Fries
Others
By Application
Ready to Cook Products
Prepared Meals
Snacks
Others
By Distribution Channel
Online
Offline
Chapter 12. South America Processed Potatoes Analysis and Outlook
12.1. South America Processed Potatoes Revenue (USD Million), by Segments (2021-2032)
12.1.1. South America Processed Potatoes Revenue (USD Million) by Type (2021-2032)
12.1.2. South America Processed Potatoes Revenue (USD Million) by Application (2021-2032)
12.1.3. South America Processed Potatoes Revenue (USD Million) by Product (2021-2032)
By Type
Positive Temperature Coefficient (PTC)
Potato Chips
Potato Flakes
Potato Starch
Frozen French Fries
Others
By Application
Ready to Cook Products
Prepared Meals
Snacks
Others
By Distribution Channel
Online
Offline
Chapter 13. Middle East and Africa Processed Potatoes Analysis and Outlook
13.1. Middle East and Africa Processed Potatoes Revenue (USD Million), by Segments (2021-2032)
13.1.1. Middle East and Africa Processed Potatoes Revenue (USD Million) by Type (2021-2032)
13.1.2. Middle East and Africa Processed Potatoes Revenue (USD Million) by Application (2021-2032)
13.1.3. Middle East and Africa Processed Potatoes Revenue (USD Million) by Product (2021-2032)
By Type
Positive Temperature Coefficient (PTC)
Potato Chips
Potato Flakes
Potato Starch
Frozen French Fries
Others
By Application
Ready to Cook Products
Prepared Meals
Snacks
Others
By Distribution Channel
Online
Offline
Chapter 14. Processed Potatoes Company Profiles
14.1 Business Overview
14.2 Product Profiles
14.3 SWOT Profiles
14.5 Recent Developments
14.6 Financial Profile
List of Companies
Burts Snacks Ltd
Campbell Soup Co.
Cooperatie Koninklijke Avebe UA
Cooperatie Koninklijke Cosun UA
Farm Frites International B.V.
Groupe Limagrain Holding
Idahoan Foods LLC
J.R. Short Milling Co.
J.R. Simplot Co.
Kellogg Co.
Lamb Weston Holdings Inc
LENG DOR S.A.U.
McCain Foods Ltd
Old Dutch Foods Ltd
PepsiCo Inc
15. Methodology and Data Sources
15.1 Customization Offerings
15.2 Subscription Services
15.3 Related Reports
15.4 Publisher Expertise
LIST OF TABLES
Table 1 Market Segmentation Analysis
Table 2 Global Processed Potatoes Market Share of Leading Companies, 2023
Table 3 Product Offerings of Leading Companies
Table 4 Low Growth Scenario Forecasts
Table 5 Reference Case Growth Scenario
Table 6 High Growth Case Scenario
Table 7 Global Processed Potatoes Revenue (USD Million) And CAGR (%) By Type (2021-2032)
Table 8 Global Processed Potatoes Revenue (USD Million) And CAGR (%) By Application (2021-2032)
Table 9 Global Processed Potatoes Revenue (USD Million) And CAGR (%) By Product (2021-2032)
Table 10 Global Processed Potatoes Market Revenue (USD Million) By Regions (2021-2032)
Table 11 Global Processed Potatoes Market Share (%) By Regions (2021-2032)
Table 12 North America Processed Potatoes Revenue (USD Million) By Country (2021-2032)
Table 13 Europe Processed Potatoes Revenue (USD Million) By Country (2021-2032)
Table 14 Asia Pacific Processed Potatoes Revenue (USD Million) By Country (2021-2032)
Table 15 South America Processed Potatoes Revenue (USD Million) By Country (2021-2032)
Table 16 Middle East and Africa Processed Potatoes Revenue (USD Million) By Region (2021-2032)
Table 17 North America Processed Potatoes Revenue (USD Million) By Type (2021-2032)
Table 18 North America Processed Potatoes Revenue (USD Million) By Application (2021-2032)
Table 19 North America Processed Potatoes Revenue (USD Million) By Product (2021-2032)
Table 20 Europe Processed Potatoes Revenue (USD Million) By Type (2021-2032)
Table 21 Europe Processed Potatoes Revenue (USD Million) By Application (2021-2032)
Table 22 Europe Processed Potatoes Revenue (USD Million) By Product (2021-2032)
Table 23 Asia Pacific Processed Potatoes Revenue (USD Million) By Type (2021-2032)
Table 24 Asia Pacific Processed Potatoes Revenue (USD Million) By Application (2021-2032)
Table 25 Asia Pacific Processed Potatoes Revenue (USD Million) By Product (2021-2032)
Table 26 South America Processed Potatoes Revenue (USD Million) By Type (2021-2032)
Table 27 South America Processed Potatoes Revenue (USD Million) By Application (2021-2032)
Table 28 South America Processed Potatoes Revenue (USD Million) By Product (2021-2032)
Table 29 Middle East and Africa Processed Potatoes Revenue (USD Million) By Type (2021-2032)
Table 30 Middle East and Africa Processed Potatoes Revenue (USD Million) By Application (2021-2032)
Table 31 Middle East and Africa Processed Potatoes Revenue (USD Million) By Product (2021-2032)
LIST OF FIGURES
Figure 1. Market Scope
Figure 2. Pricing Forecasts Per Unit, 2023- 2032
Figure 3. Porter’s Five Forces
Figure 4. Global Processed Potatoes Market Revenue (USD Million) By Regions (2021-2032)
Figure 5. Global Processed Potatoes Market Share (%) By Regions (2023)
Figure 6. North America Processed Potatoes Revenue (USD Million) By Country (2021-2032)
Figure 7. United States Processed Potatoes Revenue (USD Million) By Country (2021-2032)
Figure 8. Canada Processed Potatoes Revenue (USD Million) By Country (2021-2032)
Figure 9. Mexico Processed Potatoes Revenue (USD Million) By Country (2021-2032)
Figure 10. Europe Processed Potatoes Revenue (USD Million) By Country (2021-2032)
Figure 11. Germany Processed Potatoes Revenue (USD Million) By Country (2021-2032)
Figure 12. France Processed Potatoes Revenue (USD Million) By Country (2021-2032)
Figure 13. United Kingdom Processed Potatoes Revenue (USD Million) By Country (2021-2032)
Figure 14. Spain Processed Potatoes Revenue (USD Million) By Country (2021-2032)
Figure 15. Italy Processed Potatoes Revenue (USD Million) By Country (2021-2032)
Figure 16. Russia Processed Potatoes Revenue (USD Million) By Country (2021-2032)
Figure 17. Rest of Europe Processed Potatoes Revenue (USD Million) By Country (2021-2032)
Figure 11. Asia Pacific Processed Potatoes Revenue (USD Million) By Country (2021-2032)
Figure 12. China Processed Potatoes Revenue (USD Million) By Country (2021-2032)
Figure 13. Japan Processed Potatoes Revenue (USD Million) By Country (2021-2032)
Figure 14. India Processed Potatoes Revenue (USD Million) By Country (2021-2032)
Figure 15. South Korea Processed Potatoes Revenue (USD Million) By Country (2021-2032)
Figure 16. Australia Processed Potatoes Revenue (USD Million) By Country (2021-2032)
Figure 17. South East Asia Processed Potatoes Revenue (USD Million) By Country (2021-2032)
Figure 18. South America Processed Potatoes Revenue (USD Million) By Country (2021-2032)
Figure 19. Brazil Processed Potatoes Revenue (USD Million) By Country (2021-2032)
Figure 20. Argentina Processed Potatoes Revenue (USD Million) By Country (2021-2032)
Figure 21. Rest of Asia Pacific Processed Potatoes Revenue (USD Million) By Country (2021-2032)
Figure 22. Middle East and Africa Processed Potatoes Revenue (USD Million) By Region (2021-2032)
Figure 23. Saudi Arabia Processed Potatoes Revenue (USD Million) By Region (2021-2032)
Figure 24. The UAE Processed Potatoes Revenue (USD Million) By Region (2021-2032)
Figure 25. Rest of Middle East Processed Potatoes Revenue (USD Million) By Region (2021-2032)
Figure 26. South Africa Processed Potatoes Revenue (USD Million) By Region (2021-2032)
Figure 27. Africa Processed Potatoes Revenue (USD Million) By Region (2021-2032)
Figure 28. North America Processed Potatoes Revenue (USD Million) By Type (2021-2032)
Figure 29. North America Processed Potatoes Revenue (USD Million) By Application (2021-2032)
Figure 30. North America Processed Potatoes Revenue (USD Million) By Product (2021-2032)
Figure 31. Europe Processed Potatoes Revenue (USD Million) By Type (2021-2032)
Figure 32. Europe Processed Potatoes Revenue (USD Million) By Application (2021-2032)
Figure 33. Europe Processed Potatoes Revenue (USD Million) By Product (2021-2032)
Figure 34. Asia Pacific Processed Potatoes Revenue (USD Million) By Type (2021-2032)
Figure 35. Asia Pacific Processed Potatoes Revenue (USD Million) By Application (2021-2032)
Figure 36. Asia Pacific Processed Potatoes Revenue (USD Million) By Product (2021-2032)
Figure 37. South America Processed Potatoes Revenue (USD Million) By Type (2021-2032)
Figure 38. South America Processed Potatoes Revenue (USD Million) By Application (2021-2032)
Figure 39. South America Processed Potatoes Revenue (USD Million) By Product (2021-2032)
Figure 40. Middle East and Africa Processed Potatoes Revenue (USD Million) By Type (2021-2032)
Figure 41. Middle East and Africa Processed Potatoes Revenue (USD Million) By Application (2021-2032)
Figure 42. Middle East and Africa Processed Potatoes Revenue (USD Million) By Product (2021-2032)
By Type
Positive Temperature Coefficient (PTC)
Potato Chips
Potato Flakes
Potato Starch
Frozen French Fries
Others
By Application
Ready to Cook Products
Prepared Meals
Snacks
Others
By Distribution Channel
Online
Offline
Countries Analyzed
North America (US, Canada, Mexico)
Europe (Germany, UK, France, Spain, Italy, Russia, Rest of Europe)
Asia Pacific (China, India, Japan, South Korea, Australia, South East Asia, Rest of Asia)
South America (Brazil, Argentina, Rest of South America)
Middle East and Africa (Saudi Arabia, UAE, Rest of Middle East, South Africa, Egypt, Rest of Africa)
