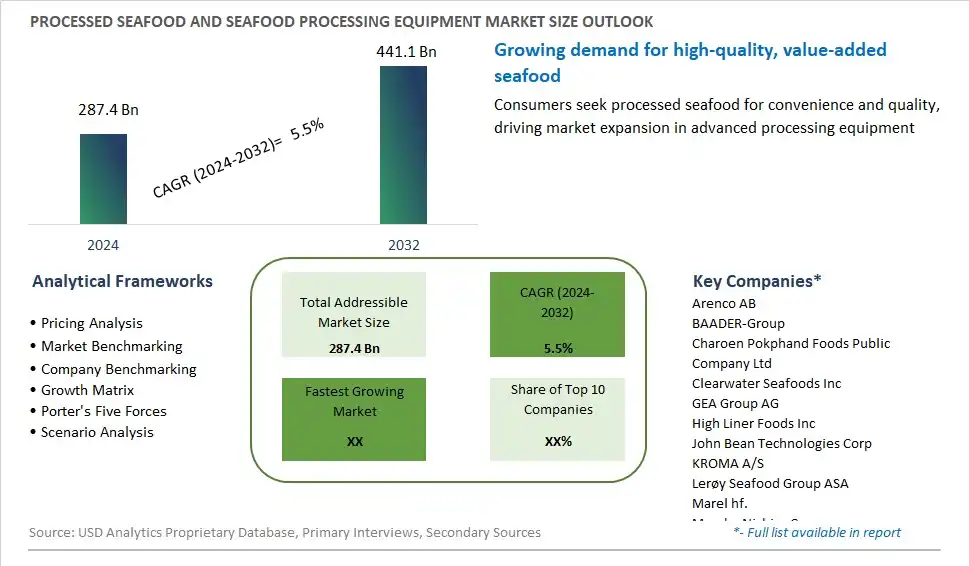
Global Processed Seafood and Seafood Processing Equipment Market Size is valued at $287.4 Billion in 2024 and is forecast to register a growth rate (CAGR) of 5.5% to reach $441.1 Billion by 2032.
The global Processed Seafood and Seafood Processing Equipment Market Comprehensive Study analyzes and forecasts the market size across 6 regions and 24 countries for diverse segments -By Type (Fish, Crustaceans, Mollusks, Others), By System (Frozen, Dried, Smoked, Canned, Surimi, Others), By Equipment (Slaughtering, Smoking, Curing & Filling, Gutting, Scaling, Skinning, Filleting, Deboning, Others), By Seafood (Fish, Crustaceans, Mollusks, Others)
An Introduction to Processed Seafood and Seafood Processing Equipment Market
Processed seafood refers to fish and shellfish products that have undergone various processing steps such as cleaning, filleting, curing, smoking, and packaging to enhance flavor, texture, and shelf life in 2024. Processed seafood products include canned fish, smoked salmon, frozen shrimp, fish fillets, and seafood snacks, catering to diverse culinary preferences and dietary needs worldwide. Seafood processing equipment encompasses machinery and systems used in the processing, handling, and packaging of seafood products, including fish gutting machines, filleting machines, smoking kilns, freezing tunnels, and packaging lines, each designed to optimize production efficiency, quality, and safety. With advancements in processing technology, automation, and food safety standards, modern seafood processing equipment offers increased throughput, yield, and product consistency, enabling manufacturers to meet consumer demands for safe, high-quality seafood products. As global demand for seafood continues to rise, driven by population growth, economic development, and dietary shifts, the market for processed seafood and seafood processing equipment is expected to expand, driven by investments in technology, innovation, and sustainability initiatives that ensure the integrity and sustainability of the seafood supply chain while meeting market demands and consumer expectations for safe, nutritious, and delicious seafood products.
Processed Seafood and Seafood Processing Equipment Competitive Landscape
The market report analyses the leading companies in the industry including Arenco AB, BAADER-Group, Charoen Pokphand Foods Public Company Ltd, Clearwater Seafoods Inc, GEA Group AG, High Liner Foods Inc, John Bean Technologies Corp, KROMA A/S, Lerøy Seafood Group ASA, Marel hf., Maruha Nichiro Corp, Mowi ASA, Nippon Suisan Kaisha Ltd (Nissui), Nueva Pescanova, S.L., Royal Greenland A/S, Skaginn 3X ehf., Thai Union Group Public Company Ltd, The Middleby Corp, Uni-Food Technic A/S, Zhengda Food Machinery Co. Ltd, and Others.
Processed Seafood and Seafood Processing Equipment Market Dynamics
Processed Seafood and Seafood Processing Equipment Market Trend: Growth in Demand for Convenient and Value-Added Seafood Products
One prominent market trend in processed seafood and seafood processing equipment is the growth in demand for convenient and value-added seafood products. As consumers increasingly seek convenient meal solutions and healthy protein options, there's a rising interest in processed seafood products such as frozen fillets, seafood snacks, ready-to-eat meals, and seafood-based ingredients. This trend is driven by factors such as busy lifestyles, urbanization, and the growing awareness of the health benefits of seafood consumption. Additionally, the preference for value-added products with extended shelf life, portion control, and flavor variety contributes to the demand for processed seafood. To meet this trend, seafood processors are investing in advanced processing equipment and technologies to enhance efficiency, product quality, and innovation in seafood processing.
Market Driver: Expansion of Seafood Processing Industry and Global Trade
A key driver propelling the market for processed seafood and seafood processing equipment is the expansion of the seafood processing industry and global trade in seafood products. With increasing demand for seafood across various regions and market segments, there's a growing need for efficient and scalable processing solutions to meet production volumes and quality standards. Seafood processors are investing in state-of-the-art processing equipment, automation technologies, and cold chain infrastructure to optimize production processes, minimize waste, and ensure food safety and traceability. Furthermore, the globalization of the seafood supply chain and international trade agreements facilitate the exchange of seafood products between countries, driving investment in processing facilities and equipment to meet regulatory requirements and market demands. As the seafood processing industry continues to expand and evolve, there's a growing market for advanced seafood processing equipment and technologies to support sustainable growth and competitiveness in the global seafood market.
Market Opportunity: Adoption of Sustainable and Traceable Processing Practices
An opportunity within the processed seafood and seafood processing equipment market lies in the adoption of sustainable and traceable processing practices to meet consumer preferences and regulatory requirements for responsible seafood sourcing and production. With increasing concerns about overfishing, environmental degradation, and seafood fraud, consumers are seeking assurances regarding the sustainability and traceability of seafood products from ocean to plate. Seafood processors can capitalize on this opportunity by investing in eco-friendly processing equipment, energy-efficient technologies, and waste management solutions to minimize the environmental impact of seafood processing operations. Moreover, implementing traceability systems, quality control measures, and certification programs can enhance transparency and accountability in the seafood supply chain, ensuring the authenticity and integrity of processed seafood products. By adopting sustainable and traceable processing practices, seafood processors can differentiate their products in the market, build consumer trust, and access premium market segments focused on ethical and environmentally conscious consumption.
Processed Seafood and Seafood Processing Equipment Market Share Analysis: Fish held the dominant market share in 2024
The fish segment dominates the processed seafood and seafood processing equipment market due to the widespread consumption of fish products globally and the extensive range of fish species available for processing. Fish is a staple food in many cultures, valued for its nutritional benefits, versatility in cooking, and mild flavor profile. As a result, there is a high demand for processed fish products such as fillets, canned fish, fish sticks, and surimi, driving the need for efficient seafood processing equipment. Additionally, advancements in processing technologies have enabled the development of value-added fish products, including smoked fish, marinated fish, and ready-to-eat seafood meals, further boosting market growth. The fish segment's dominance is also supported by the increasing consumer awareness of the health benefits associated with seafood consumption, including omega-3 fatty acids and protein content. With the seafood industry continuing to expand to meet growing consumer demand and preferences, the fish segment is expected to maintain its leading position in the processed seafood and seafood processing equipment market.
Processed Seafood and Seafood Processing Equipment Market Share Analysis: Surimi held the dominant market share in 2024
The surimi segment is experiencing rapid growth in the processed seafood and seafood processing equipment market, driven by the increasing popularity of surimi-based products worldwide. Surimi, a processed fish paste typically made from whitefish such as pollock, is valued for its versatility, mild flavor, and ability to mimic the texture of more expensive seafood varieties. Surimi-based products, including imitation crab meat, lobster, and shrimp, offer a cost-effective alternative to traditional seafood options while maintaining a similar taste and appearance. The surimi industry benefits from continuous innovation in processing technologies, enabling manufacturers to produce high-quality surimi with improved texture, flavor, and nutritional content. Further, surimi's longer shelf life and convenience make it a preferred choice for consumers seeking convenient and nutritious seafood options. As demand for surimi-based products continues to grow, fueled by changing consumer lifestyles and preferences, investments in surimi processing equipment are on the rise, driving the segment's rapid expansion in the processed seafood market.
Processed Seafood and Seafood Processing Equipment Market Share Analysis: Filleting held the dominant market share in 2024
The filleting equipment segment commands the largest share in the processed seafood and seafood processing equipment market, owing to its crucial role in the seafood processing chain and the high demand for processed fillet products worldwide. Filleting equipment is essential for removing bones and skin from fish and other seafood to produce boneless fillets, a popular and versatile seafood product consumed globally. With the rising preference for convenience and value-added seafood products among consumers, the demand for processed fillets continues to soar. Filleting equipment offers precision and efficiency in the filleting process, ensuring consistent product quality and maximizing yield. Further, technological advancements in filleting equipment, such as automation, robotics, and advanced cutting techniques, have enhanced productivity and reduced labor costs for seafood processors. As the seafood industry expands to meet increasing consumer demand, the filleting equipment segment remains at the forefront, driving growth and innovation in the processed seafood and seafood processing equipment market.
Processed Seafood and Seafood Processing Equipment Market Segmentation
By Type
Fish
Crustaceans
Mollusks
Others
By System
Frozen
Dried
Smoked
Canned
Surimi
Others
By Equipment
Slaughtering
Smoking
Curing & Filling
Gutting
Scaling
Skinning
Filleting
Deboning
Others
By Seafood
Fish
Crustaceans
Mollusks
Others
Countries Analyzed
North America (US, Canada, Mexico)
Europe (Germany, UK, France, Spain, Italy, Russia, Rest of Europe)
Asia Pacific (China, India, Japan, South Korea, Australia, South East Asia, Rest of Asia)
South America (Brazil, Argentina, Rest of South America)
Middle East and Africa (Saudi Arabia, UAE, Rest of Middle East, South Africa, Egypt, Rest of Africa)
Processed Seafood and Seafood Processing Equipment Companies Profiled in the Study
Arenco AB
BAADER-Group
Charoen Pokphand Foods Public Company Ltd
Clearwater Seafoods Inc
GEA Group AG
High Liner Foods Inc
John Bean Technologies Corp
KROMA A/S
Lerøy Seafood Group ASA
Marel hf.
Maruha Nichiro Corp
Mowi ASA
Nippon Suisan Kaisha Ltd (Nissui)
Nueva Pescanova, S.L.
Royal Greenland A/S
Skaginn 3X ehf.
Thai Union Group Public Company Ltd
The Middleby Corp
Uni-Food Technic A/S
Zhengda Food Machinery Co. Ltd
*- List Not Exhaustive
Chapter 1. TABLE OF CONTENTS
Chapter 2. Introduction to Processed Seafood and Seafood Processing Equipment Market
2.1. Market Overview
2.2. Key Statistics and Report Highlights
2.3. Scope of the Comprehensive Study
2.3.1. Market Definition
2.3.2 Countries and Regions Covered
2.3.3 Research Objective
2.3.4 Units, Currency, and Conversions
2.3.5 Industry Value Chain
2.4. Key Market Segments
2.5. Key Companies
2.6. Study Period
Chapter 3. Strategic Analysis Review
3.1. Processed Seafood and Seafood Processing Equipment Pricing Analysis and Forecast
3.2. Porter’s Five Forces
3.3. Market Ecosystem
3.4. SWOT Analysis
3.5. Regulatory Scenario
3.3. Effects of Inflation, Russia-Ukraine War, moderating economic growth, and other macroeconomic factors
Chapter 4. Competitive Landscape
4.1. Market Share Analysis
4.1.1. Global Processed Seafood and Seafood Processing Equipment Market Share by Company, 2023
4.1.2. Product Offerings of Leading Processed Seafood and Seafood Processing Equipment Companies
4.2. Market Entropy
4.2.1. New Product Launches in the Industry
4.2.2. Mergers, Acquisitions, Joint ventures, and Partnerships
4.3. Key Strategies and Best Practices
Chapter 5. Global Market Projections: Best, Reference, and Low Case Scenarios
5.1. Growth Analysis- Case Scenario Definitions
5.2. Low Growth Case Scenario Forecasts
5.3. Reference Growth Case Scenario Forecasts
5.4. High Growth Case Scenario Forecasts
Chapter 6. Market Dynamics
6.1. Processed Seafood and Seafood Processing Equipment Market Drivers
6.2. Processed Seafood and Seafood Processing Equipment Market Challenges
6.6. Processed Seafood and Seafood Processing Equipment Market Opportunities
6.4. Processed Seafood and Seafood Processing Equipment Market Trends
Chapter 7. Global Processed Seafood and Seafood Processing Equipment Market Outlook Trends
7.1. Global Processed Seafood and Seafood Processing Equipment Revenue (USD Million) and CAGR (%) by Type (2021-2032)
7.2. Global Processed Seafood and Seafood Processing Equipment Revenue (USD Million) and CAGR (%) by Application (2021-2032)
7.3. Global Processed Seafood and Seafood Processing Equipment Revenue (USD Million) and CAGR (%) by Product (2021-2032)
By Type
Fish
Crustaceans
Mollusks
Others
By System
Frozen
Dried
Smoked
Canned
Surimi
Others
By Equipment
Slaughtering
Smoking
Curing & Filling
Gutting
Scaling
Skinning
Filleting
Deboning
Others
By Seafood
Fish
Crustaceans
Mollusks
Others
Chapter 8. Global Processed Seafood and Seafood Processing Equipment Regional Analysis and Outlook
8.1. Global Processed Seafood and Seafood Processing Equipment Revenue (USD Million) By Regions (2021- 2032)
8.2. North America Processed Seafood and Seafood Processing Equipment Revenue (USD Million) by Country (2021-2032)
8.2.1. United States Processed Seafood and Seafood Processing Equipment Regional Analysis and Outlook
8.2.2. Canada Processed Seafood and Seafood Processing Equipment Regional Analysis and Outlook
8.2.3. Mexico Processed Seafood and Seafood Processing Equipment Regional Analysis and Outlook
8.3. Europe Processed Seafood and Seafood Processing Equipment Revenue (USD Million), by Country (2021-2032)
8.3.1. Germany Processed Seafood and Seafood Processing Equipment Regional Analysis and Outlook
8.3.2. France Processed Seafood and Seafood Processing Equipment Regional Analysis and Outlook
8.3.3. United Kingdom Processed Seafood and Seafood Processing Equipment Regional Analysis and Outlook
8.3.4. Spain Processed Seafood and Seafood Processing Equipment Regional Analysis and Outlook
8.3.5. Italy Processed Seafood and Seafood Processing Equipment Regional Analysis and Outlook
8.3.6. Russia Processed Seafood and Seafood Processing Equipment Regional Analysis and Outlook
8.3.7. Rest of Europe Processed Seafood and Seafood Processing Equipment Regional Analysis and Outlook
8.4. Asia Pacific Processed Seafood and Seafood Processing Equipment Revenue (USD Million) by Country (2021-2032)
8.4.1. China Processed Seafood and Seafood Processing Equipment Regional Analysis and Outlook
8.4.2. Japan Processed Seafood and Seafood Processing Equipment Regional Analysis and Outlook
8.4.3. India Processed Seafood and Seafood Processing Equipment Regional Analysis and Outlook
8.4.4. South Korea Processed Seafood and Seafood Processing Equipment Regional Analysis and Outlook
8.4.5. Australia Processed Seafood and Seafood Processing Equipment Regional Analysis and Outlook
8.4.6. South East Asia Processed Seafood and Seafood Processing Equipment Regional Analysis and Outlook
8.4.7. Rest of Asia Pacific Processed Seafood and Seafood Processing Equipment Regional Analysis and Outlook
8.5. South America Processed Seafood and Seafood Processing Equipment Revenue (USD Million), by Country (2021-2032)
8.5.1. Brazil Processed Seafood and Seafood Processing Equipment Regional Analysis and Outlook
8.5.2. Argentina Processed Seafood and Seafood Processing Equipment Regional Analysis and Outlook
8.5.3. Rest of South America Processed Seafood and Seafood Processing Equipment Regional Analysis and Outlook
8.6. Middle East and Africa Processed Seafood and Seafood Processing Equipment Revenue (USD Million) by Country (2021-2032)
8.6.1. Middle East Processed Seafood and Seafood Processing Equipment Regional Analysis and Outlook
8.6.2. Africa Processed Seafood and Seafood Processing Equipment Regional Analysis and Outlook
Chapter 9. North America Processed Seafood and Seafood Processing Equipment Analysis and Outlook
9.1. North America Processed Seafood and Seafood Processing Equipment Revenue (USD Million) by Segments (2021-2032)
9.1.1. North America Processed Seafood and Seafood Processing Equipment Revenue (USD Million) by Type (2021-2032)
9.1.2. North America Processed Seafood and Seafood Processing Equipment Revenue (USD Million) by Application (2021-2032)
9.1.3. North America Processed Seafood and Seafood Processing Equipment Revenue (USD Million) by Product (2021-2032)
By Type
Fish
Crustaceans
Mollusks
Others
By System
Frozen
Dried
Smoked
Canned
Surimi
Others
By Equipment
Slaughtering
Smoking
Curing & Filling
Gutting
Scaling
Skinning
Filleting
Deboning
Others
By Seafood
Fish
Crustaceans
Mollusks
Others
Chapter 10. Europe Processed Seafood and Seafood Processing Equipment Analysis and Outlook
10.1. Europe Processed Seafood and Seafood Processing Equipment Revenue (USD Million), by Segments (USD Million) (2021-2032)
10.1.1. Europe Processed Seafood and Seafood Processing Equipment Revenue (USD Million) by Type (2021-2032)
10.1.2. Europe Processed Seafood and Seafood Processing Equipment Revenue (USD Million) by Application (2021-2032)
10.1.3. Europe Processed Seafood and Seafood Processing Equipment Revenue (USD Million) by Product (2021-2032)
By Type
Fish
Crustaceans
Mollusks
Others
By System
Frozen
Dried
Smoked
Canned
Surimi
Others
By Equipment
Slaughtering
Smoking
Curing & Filling
Gutting
Scaling
Skinning
Filleting
Deboning
Others
By Seafood
Fish
Crustaceans
Mollusks
Others
Chapter 11. Asia Pacific Processed Seafood and Seafood Processing Equipment Analysis and Outlook
11.1. Asia Pacific Processed Seafood and Seafood Processing Equipment Revenue (USD Million), and Revenue (USD Million) by Segments (2021-2032)
11.1.1. Asia Pacific Processed Seafood and Seafood Processing Equipment Revenue (USD Million) by Type (2021-2032)
11.1.2. Asia Pacific Processed Seafood and Seafood Processing Equipment Revenue (USD Million) by Application (2021-2032)
11.1.3. Asia Pacific Processed Seafood and Seafood Processing Equipment Revenue (USD Million) by Product (2021-2032)
By Type
Fish
Crustaceans
Mollusks
Others
By System
Frozen
Dried
Smoked
Canned
Surimi
Others
By Equipment
Slaughtering
Smoking
Curing & Filling
Gutting
Scaling
Skinning
Filleting
Deboning
Others
By Seafood
Fish
Crustaceans
Mollusks
Others
Chapter 12. South America Processed Seafood and Seafood Processing Equipment Analysis and Outlook
12.1. South America Processed Seafood and Seafood Processing Equipment Revenue (USD Million), by Segments (2021-2032)
12.1.1. South America Processed Seafood and Seafood Processing Equipment Revenue (USD Million) by Type (2021-2032)
12.1.2. South America Processed Seafood and Seafood Processing Equipment Revenue (USD Million) by Application (2021-2032)
12.1.3. South America Processed Seafood and Seafood Processing Equipment Revenue (USD Million) by Product (2021-2032)
By Type
Fish
Crustaceans
Mollusks
Others
By System
Frozen
Dried
Smoked
Canned
Surimi
Others
By Equipment
Slaughtering
Smoking
Curing & Filling
Gutting
Scaling
Skinning
Filleting
Deboning
Others
By Seafood
Fish
Crustaceans
Mollusks
Others
Chapter 13. Middle East and Africa Processed Seafood and Seafood Processing Equipment Analysis and Outlook
13.1. Middle East and Africa Processed Seafood and Seafood Processing Equipment Revenue (USD Million), by Segments (2021-2032)
13.1.1. Middle East and Africa Processed Seafood and Seafood Processing Equipment Revenue (USD Million) by Type (2021-2032)
13.1.2. Middle East and Africa Processed Seafood and Seafood Processing Equipment Revenue (USD Million) by Application (2021-2032)
13.1.3. Middle East and Africa Processed Seafood and Seafood Processing Equipment Revenue (USD Million) by Product (2021-2032)
By Type
Fish
Crustaceans
Mollusks
Others
By System
Frozen
Dried
Smoked
Canned
Surimi
Others
By Equipment
Slaughtering
Smoking
Curing & Filling
Gutting
Scaling
Skinning
Filleting
Deboning
Others
By Seafood
Fish
Crustaceans
Mollusks
Others
Chapter 14. Processed Seafood and Seafood Processing Equipment Company Profiles
14.1 Business Overview
14.2 Product Profiles
14.3 SWOT Profiles
14.5 Recent Developments
14.6 Financial Profile
List of Companies
Arenco AB
BAADER-Group
Charoen Pokphand Foods Public Company Ltd
Clearwater Seafoods Inc
GEA Group AG
High Liner Foods Inc
John Bean Technologies Corp
KROMA A/S
Lerøy Seafood Group ASA
Marel hf.
Maruha Nichiro Corp
Mowi ASA
Nippon Suisan Kaisha Ltd (Nissui)
Nueva Pescanova, S.L.
Royal Greenland A/S
Skaginn 3X ehf.
Thai Union Group Public Company Ltd
The Middleby Corp
Uni-Food Technic A/S
Zhengda Food Machinery Co. Ltd
15. Methodology and Data Sources
15.1 Customization Offerings
15.2 Subscription Services
15.3 Related Reports
15.4 Publisher Expertise
LIST OF TABLES
Table 1 Market Segmentation Analysis
Table 2 Global Processed Seafood and Seafood Processing Equipment Market Share of Leading Companies, 2023
Table 3 Product Offerings of Leading Companies
Table 4 Low Growth Scenario Forecasts
Table 5 Reference Case Growth Scenario
Table 6 High Growth Case Scenario
Table 7 Global Processed Seafood and Seafood Processing Equipment Revenue (USD Million) And CAGR (%) By Type (2021-2032)
Table 8 Global Processed Seafood and Seafood Processing Equipment Revenue (USD Million) And CAGR (%) By Application (2021-2032)
Table 9 Global Processed Seafood and Seafood Processing Equipment Revenue (USD Million) And CAGR (%) By Product (2021-2032)
Table 10 Global Processed Seafood and Seafood Processing Equipment Market Revenue (USD Million) By Regions (2021-2032)
Table 11 Global Processed Seafood and Seafood Processing Equipment Market Share (%) By Regions (2021-2032)
Table 12 North America Processed Seafood and Seafood Processing Equipment Revenue (USD Million) By Country (2021-2032)
Table 13 Europe Processed Seafood and Seafood Processing Equipment Revenue (USD Million) By Country (2021-2032)
Table 14 Asia Pacific Processed Seafood and Seafood Processing Equipment Revenue (USD Million) By Country (2021-2032)
Table 15 South America Processed Seafood and Seafood Processing Equipment Revenue (USD Million) By Country (2021-2032)
Table 16 Middle East and Africa Processed Seafood and Seafood Processing Equipment Revenue (USD Million) By Region (2021-2032)
Table 17 North America Processed Seafood and Seafood Processing Equipment Revenue (USD Million) By Type (2021-2032)
Table 18 North America Processed Seafood and Seafood Processing Equipment Revenue (USD Million) By Application (2021-2032)
Table 19 North America Processed Seafood and Seafood Processing Equipment Revenue (USD Million) By Product (2021-2032)
Table 20 Europe Processed Seafood and Seafood Processing Equipment Revenue (USD Million) By Type (2021-2032)
Table 21 Europe Processed Seafood and Seafood Processing Equipment Revenue (USD Million) By Application (2021-2032)
Table 22 Europe Processed Seafood and Seafood Processing Equipment Revenue (USD Million) By Product (2021-2032)
Table 23 Asia Pacific Processed Seafood and Seafood Processing Equipment Revenue (USD Million) By Type (2021-2032)
Table 24 Asia Pacific Processed Seafood and Seafood Processing Equipment Revenue (USD Million) By Application (2021-2032)
Table 25 Asia Pacific Processed Seafood and Seafood Processing Equipment Revenue (USD Million) By Product (2021-2032)
Table 26 South America Processed Seafood and Seafood Processing Equipment Revenue (USD Million) By Type (2021-2032)
Table 27 South America Processed Seafood and Seafood Processing Equipment Revenue (USD Million) By Application (2021-2032)
Table 28 South America Processed Seafood and Seafood Processing Equipment Revenue (USD Million) By Product (2021-2032)
Table 29 Middle East and Africa Processed Seafood and Seafood Processing Equipment Revenue (USD Million) By Type (2021-2032)
Table 30 Middle East and Africa Processed Seafood and Seafood Processing Equipment Revenue (USD Million) By Application (2021-2032)
Table 31 Middle East and Africa Processed Seafood and Seafood Processing Equipment Revenue (USD Million) By Product (2021-2032)
LIST OF FIGURES
Figure 1. Market Scope
Figure 2. Pricing Forecasts Per Unit, 2023- 2032
Figure 3. Porter’s Five Forces
Figure 4. Global Processed Seafood and Seafood Processing Equipment Market Revenue (USD Million) By Regions (2021-2032)
Figure 5. Global Processed Seafood and Seafood Processing Equipment Market Share (%) By Regions (2023)
Figure 6. North America Processed Seafood and Seafood Processing Equipment Revenue (USD Million) By Country (2021-2032)
Figure 7. United States Processed Seafood and Seafood Processing Equipment Revenue (USD Million) By Country (2021-2032)
Figure 8. Canada Processed Seafood and Seafood Processing Equipment Revenue (USD Million) By Country (2021-2032)
Figure 9. Mexico Processed Seafood and Seafood Processing Equipment Revenue (USD Million) By Country (2021-2032)
Figure 10. Europe Processed Seafood and Seafood Processing Equipment Revenue (USD Million) By Country (2021-2032)
Figure 11. Germany Processed Seafood and Seafood Processing Equipment Revenue (USD Million) By Country (2021-2032)
Figure 12. France Processed Seafood and Seafood Processing Equipment Revenue (USD Million) By Country (2021-2032)
Figure 13. United Kingdom Processed Seafood and Seafood Processing Equipment Revenue (USD Million) By Country (2021-2032)
Figure 14. Spain Processed Seafood and Seafood Processing Equipment Revenue (USD Million) By Country (2021-2032)
Figure 15. Italy Processed Seafood and Seafood Processing Equipment Revenue (USD Million) By Country (2021-2032)
Figure 16. Russia Processed Seafood and Seafood Processing Equipment Revenue (USD Million) By Country (2021-2032)
Figure 17. Rest of Europe Processed Seafood and Seafood Processing Equipment Revenue (USD Million) By Country (2021-2032)
Figure 11. Asia Pacific Processed Seafood and Seafood Processing Equipment Revenue (USD Million) By Country (2021-2032)
Figure 12. China Processed Seafood and Seafood Processing Equipment Revenue (USD Million) By Country (2021-2032)
Figure 13. Japan Processed Seafood and Seafood Processing Equipment Revenue (USD Million) By Country (2021-2032)
Figure 14. India Processed Seafood and Seafood Processing Equipment Revenue (USD Million) By Country (2021-2032)
Figure 15. South Korea Processed Seafood and Seafood Processing Equipment Revenue (USD Million) By Country (2021-2032)
Figure 16. Australia Processed Seafood and Seafood Processing Equipment Revenue (USD Million) By Country (2021-2032)
Figure 17. South East Asia Processed Seafood and Seafood Processing Equipment Revenue (USD Million) By Country (2021-2032)
Figure 18. South America Processed Seafood and Seafood Processing Equipment Revenue (USD Million) By Country (2021-2032)
Figure 19. Brazil Processed Seafood and Seafood Processing Equipment Revenue (USD Million) By Country (2021-2032)
Figure 20. Argentina Processed Seafood and Seafood Processing Equipment Revenue (USD Million) By Country (2021-2032)
Figure 21. Rest of Asia Pacific Processed Seafood and Seafood Processing Equipment Revenue (USD Million) By Country (2021-2032)
Figure 22. Middle East and Africa Processed Seafood and Seafood Processing Equipment Revenue (USD Million) By Region (2021-2032)
Figure 23. Saudi Arabia Processed Seafood and Seafood Processing Equipment Revenue (USD Million) By Region (2021-2032)
Figure 24. The UAE Processed Seafood and Seafood Processing Equipment Revenue (USD Million) By Region (2021-2032)
Figure 25. Rest of Middle East Processed Seafood and Seafood Processing Equipment Revenue (USD Million) By Region (2021-2032)
Figure 26. South Africa Processed Seafood and Seafood Processing Equipment Revenue (USD Million) By Region (2021-2032)
Figure 27. Africa Processed Seafood and Seafood Processing Equipment Revenue (USD Million) By Region (2021-2032)
Figure 28. North America Processed Seafood and Seafood Processing Equipment Revenue (USD Million) By Type (2021-2032)
Figure 29. North America Processed Seafood and Seafood Processing Equipment Revenue (USD Million) By Application (2021-2032)
Figure 30. North America Processed Seafood and Seafood Processing Equipment Revenue (USD Million) By Product (2021-2032)
Figure 31. Europe Processed Seafood and Seafood Processing Equipment Revenue (USD Million) By Type (2021-2032)
Figure 32. Europe Processed Seafood and Seafood Processing Equipment Revenue (USD Million) By Application (2021-2032)
Figure 33. Europe Processed Seafood and Seafood Processing Equipment Revenue (USD Million) By Product (2021-2032)
Figure 34. Asia Pacific Processed Seafood and Seafood Processing Equipment Revenue (USD Million) By Type (2021-2032)
Figure 35. Asia Pacific Processed Seafood and Seafood Processing Equipment Revenue (USD Million) By Application (2021-2032)
Figure 36. Asia Pacific Processed Seafood and Seafood Processing Equipment Revenue (USD Million) By Product (2021-2032)
Figure 37. South America Processed Seafood and Seafood Processing Equipment Revenue (USD Million) By Type (2021-2032)
Figure 38. South America Processed Seafood and Seafood Processing Equipment Revenue (USD Million) By Application (2021-2032)
Figure 39. South America Processed Seafood and Seafood Processing Equipment Revenue (USD Million) By Product (2021-2032)
Figure 40. Middle East and Africa Processed Seafood and Seafood Processing Equipment Revenue (USD Million) By Type (2021-2032)
Figure 41. Middle East and Africa Processed Seafood and Seafood Processing Equipment Revenue (USD Million) By Application (2021-2032)
Figure 42. Middle East and Africa Processed Seafood and Seafood Processing Equipment Revenue (USD Million) By Product (2021-2032)
By Type
Fish
Crustaceans
Mollusks
Others
By System
Frozen
Dried
Smoked
Canned
Surimi
Others
By Equipment
Slaughtering
Smoking
Curing & Filling
Gutting
Scaling
Skinning
Filleting
Deboning
Others
By Seafood
Fish
Crustaceans
Mollusks
Others
Countries Analyzed
North America (US, Canada, Mexico)
Europe (Germany, UK, France, Spain, Italy, Russia, Rest of Europe)
Asia Pacific (China, India, Japan, South Korea, Australia, South East Asia, Rest of Asia)
South America (Brazil, Argentina, Rest of South America)
Middle East and Africa (Saudi Arabia, UAE, Rest of Middle East, South Africa, Egypt, Rest of Africa)
