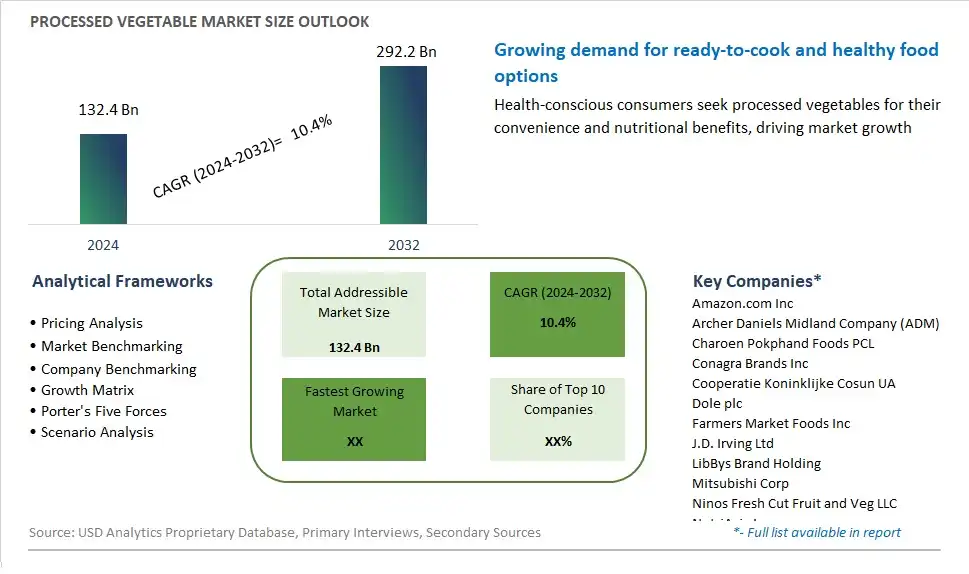
Global Processed Vegetable Market Size is valued at $132.4 Billion in 2024 and is forecast to register a growth rate (CAGR) of 10.4% to reach $292.2 Billion by 2032.
The global Processed Vegetable Market Comprehensive Study analyzes and forecasts the market size across 6 regions and 24 countries for diverse segments -By Product (Canned vegetables, Frozen vegetables, Fresh-cut vegetables), By Distribution Channel (Supermarkets/Hypermarkets, Independent retailers and convenience stores, Specialty food stores, Online retailers)
An Introduction to Processed Vegetable Market
The Processed Vegetable Market involves the production and sale of vegetables that have been preserved through methods such as canning, freezing, drying, and pickling. These products offer convenience and extended shelf life while retaining nutritional value. The market is driven by increasing demand for convenience foods, rising consumer awareness about healthy eating, and growing preference for ready-to-eat and easy-to-prepare vegetables. Additionally, advancements in processing technologies and packaging solutions support market growth.
Processed Vegetable Competitive Landscape
The market report analyses the leading companies in the industry including Amazon.com Inc, Archer Daniels Midland Company (ADM), Charoen Pokphand Foods PCL, Conagra Brands Inc, Cooperatie Koninklijke Cosun UA, Dole plc, Farmers Market Foods Inc, J.D. Irving Ltd, LibBys Brand Holding, Mitsubishi Corp, Ninos Fresh Cut Fruit and Veg LLC, NutriAsia Inc, RFG Holdings Ltd, Seneca Foods Corp, Smith Frozen Foods Inc, Sprouts Farmers Market Inc, Sysco Corp, The Fresh Gourmet Co., and Others.
Processed Vegetable Market Dynamics
Processed Vegetable Market Trend: Increasing Consumer Shift Towards Frozen and Ready-to-Eat Vegetables
One of the most prominent trends in the processed vegetable market is the increasing consumer shift towards frozen and ready-to-eat vegetables. With busy lifestyles and a growing preference for convenient meal solutions, consumers are turning to processed vegetables that offer ease of preparation without compromising nutritional value. Frozen vegetables, in particular, have gained popularity due to their long shelf life, retention of nutrients, and minimal preparation time. This trend is further fueled by the perception that frozen vegetables can be as healthy as fresh ones, owing to advancements in flash-freezing technologies that preserve their quality and taste. Additionally, the variety and availability of ready-to-eat vegetable products, such as pre-washed salads, vegetable mixes, and microwaveable dishes, cater to the demand for quick, healthy meals, making them a staple in modern kitchens.
Market Driver: Rising Health Consciousness and Demand for Nutritious Food Options
A major driver in the processed vegetable market is the rising health consciousness and demand for nutritious food options. As consumers become more aware of the health benefits associated with a diet rich in vegetables, there is a growing preference for products that contribute to a balanced and healthy diet. Processed vegetables, which include canned, frozen, and dehydrated options, provide an easy way for consumers to increase their vegetable intake. The convenience of having ready-to-use vegetables encourages healthier eating habits, even among those with busy lifestyles. This driver is also supported by various health campaigns and dietary guidelines that emphasize the importance of vegetable consumption for preventing chronic diseases and promoting overall well-being. Furthermore, the clean label movement, which advocates for transparency and minimal processing, has boosted the demand for processed vegetables that are free from additives and preservatives, aligning with consumer preferences for natural and wholesome foods.
Market Opportunity: Expansion into Emerging Markets and Development of Organic Product Lines
The processed vegetable market holds significant growth opportunities in emerging markets and the development of organic product lines. Emerging markets in Asia-Pacific, Latin America, and Africa are experiencing rapid urbanization, rising disposable incomes, and a shift towards modern retail formats, all of which contribute to increased demand for processed foods, including vegetables. Companies can tap into these markets by establishing strong distribution networks, understanding local culinary preferences, and offering products that cater to regional tastes. Additionally, the growing trend towards organic and sustainably sourced food products presents a lucrative opportunity. Developing organic processed vegetables can attract health-conscious consumers willing to pay a premium for products that are perceived as healthier and environmentally friendly. Investments in organic farming practices and certifications, along with strategic marketing campaigns that highlight the benefits of organic products, can help companies capture a larger share of the market and meet the evolving demands of consumers worldwide. Market Trend: Rising Popularity of Natural and Organic Hair Care ProductsOne of the most prominent trends in the professional hair care market is the rising popularity of natural and organic hair care products. Consumers are increasingly becoming aware of the potential harmful effects of synthetic chemicals found in conventional hair care products, such as sulfates, parabens, and silicones. This shift towards natural and organic products is driven by a broader trend of health and wellness, where consumers are seeking safer, more sustainable options for their beauty routines. Professional hair care brands are responding by formulating products with plant-based ingredients, essential oils, and organic extracts that promise to deliver effective results without compromising health. This trend is also supported by the clean beauty movement, which advocates for transparency in ingredient sourcing and product labeling. The demand for natural and organic hair care products is further amplified by endorsements from celebrities, influencers, and hairstylists who highlight the benefits of using clean and green beauty products in professional settings.
Market Driver: Increased Consumer Spending on Premium Hair Care Services and Products
A significant driver in the professional hair care market is the increased consumer spending on premium hair care services and products. As disposable incomes rise, especially in emerging economies, consumers are willing to invest more in high-quality hair care solutions offered by professional salons and spas. This is driven by the desire for superior results that can only be achieved through professional-grade products and expert services. Additionally, there is a growing awareness about the importance of hair health, leading consumers to seek out specialized treatments such as keratin treatments, scalp care, and customized hair repair therapies. The professional hair care segment is also benefiting from the trend of experiential spending, where consumers prioritize spending on experiences and self-care over material goods. This has led to an increase in salon visits and the purchase of salon-recommended hair care products, further driving the market growth.
Market Opportunity: Expansion into Emerging Markets and Digital Transformation
The professional hair care market presents significant opportunities for expansion into emerging markets and leveraging digital transformation. Emerging markets in Asia-Pacific, Latin America, and Africa are witnessing rapid urbanization, growing middle-class populations, and increasing beauty consciousness, creating a fertile ground for professional hair care brands to establish their presence. Companies can capitalize on this opportunity by entering these markets with tailored marketing strategies, affordable yet premium product lines, and partnerships with local salons and distributors. Additionally, the digital transformation of the beauty industry presents a vast opportunity for growth. The rise of e-commerce platforms, social media marketing, and digital consultations are reshaping how consumers discover, purchase, and experience professional hair care products. Brands that invest in robust online sales channels, engage with consumers through social media, and offer personalized virtual consultations can significantly enhance their market reach and consumer engagement. Digital tools and technologies also enable salons to streamline operations, improve customer service, and offer customized hair care solutions, thereby driving overall market growth.
Processed Vegetable Market Share Analysis: Frozen Vegetables held the dominant market share in 2024
Within the processed vegetable market segmented by product, Frozen Vegetables emerge as the largest segment, driven by several factors. Firstly, frozen vegetables offer convenience and longer shelf life compared to their fresh counterparts, making them a preferred choice for consumers seeking quick and easy meal solutions without compromising nutritional value. The freezing process helps to retain the nutritional content of vegetables, ensuring that they maintain their vitamins and minerals even after extended storage periods. Further, frozen vegetables eliminate the need for washing, peeling, and chopping, saving time and effort in meal preparation, which resonates well with busy households and individuals. Additionally, the availability of a wide variety of frozen vegetable options, ranging from mixed vegetables to specialty items, caters to diverse consumer preferences and culinary needs. Furthermore, the growing awareness of food waste reduction and the desire for year-round access to seasonal produce contribute to the popularity of frozen vegetables among consumers. Overall, these factors collectively contribute to the dominance of Frozen Vegetables as the largest segment within the processed vegetable market.
Processed Vegetable Market Share Analysis: Online Retailers market is poised to register the fastest growth rae over the forecast period to 2032
In the processed vegetable market segmented by distribution channels, Online Retailers emerge as the fastest-growing segment, propelled by shifting consumer preferences and the digital transformation of shopping habits. The convenience and accessibility offered by online platforms have revolutionized the way consumers purchase groceries, including processed vegetables. Online retailers provide a convenient shopping experience, allowing consumers to browse a wide range of products from the comfort of their homes and have them delivered directly to their doorstep. Further, the COVID-19 pandemic has accelerated the adoption of online grocery shopping as consumers prioritize safety and minimize physical contact. Additionally, online retailers often offer a broader selection of processed vegetable products compared to traditional brick-and-mortar stores, catering to diverse dietary preferences and specialty items. Furthermore, promotional discounts, subscription services, and loyalty programs enhance the attractiveness of online shopping for processed vegetables, driving its rapid growth in the market. Overall, the convenience, variety, and safety features offered by online retailers contribute to their emergence as the fastest-growing segment within the processed vegetable market.
Processed Vegetable Market Segmentation
By Product
Canned vegetables
Frozen vegetables
Fresh-cut vegetables
By Distribution Channel
Supermarkets/Hypermarkets
Independent retailers and convenience store
Specialty food stores
Online retailers
Countries Analyzed
North America (US, Canada, Mexico)
Europe (Germany, UK, France, Spain, Italy, Russia, Rest of Europe)
Asia Pacific (China, India, Japan, South Korea, Australia, South East Asia, Rest of Asia)
South America (Brazil, Argentina, Rest of South America)
Middle East and Africa (Saudi Arabia, UAE, Rest of Middle East, South Africa, Egypt, Rest of Africa)
Processed Vegetable Companies Profiled in the Study
Amazon.com Inc
Archer Daniels Midland Company (ADM)
Charoen Pokphand Foods PCL
Conagra Brands Inc
Cooperatie Koninklijke Cosun UA
Dole plc
Farmers Market Foods Inc
J.D. Irving Ltd
LibBys Brand Holding
Mitsubishi Corp
Ninos Fresh Cut Fruit and Veg LLC
NutriAsia Inc
RFG Holdings Ltd
Seneca Foods Corp
Smith Frozen Foods Inc
Sprouts Farmers Market Inc
Sysco Corp
The Fresh Gourmet Co.
*- List Not Exhaustive
Chapter 1. TABLE OF CONTENTS
Chapter 2. Introduction to Processed Vegetable Market
2.1. Market Overview
2.2. Key Statistics and Report Highlights
2.3. Scope of the Comprehensive Study
2.3.1. Market Definition
2.3.2 Countries and Regions Covered
2.3.3 Research Objective
2.3.4 Units, Currency, and Conversions
2.3.5 Industry Value Chain
2.4. Key Market Segments
2.5. Key Companies
2.6. Study Period
Chapter 3. Strategic Analysis Review
3.1. Processed Vegetable Pricing Analysis and Forecast
3.2. Porter’s Five Forces
3.3. Market Ecosystem
3.4. SWOT Analysis
3.5. Regulatory Scenario
3.3. Effects of Inflation, Russia-Ukraine War, moderating economic growth, and other macroeconomic factors
Chapter 4. Competitive Landscape
4.1. Market Share Analysis
4.1.1. Global Processed Vegetable Market Share by Company, 2023
4.1.2. Product Offerings of Leading Processed Vegetable Companies
4.2. Market Entropy
4.2.1. New Product Launches in the Industry
4.2.2. Mergers, Acquisitions, Joint ventures, and Partnerships
4.3. Key Strategies and Best Practices
Chapter 5. Global Market Projections: Best, Reference, and Low Case Scenarios
5.1. Growth Analysis- Case Scenario Definitions
5.2. Low Growth Case Scenario Forecasts
5.3. Reference Growth Case Scenario Forecasts
5.4. High Growth Case Scenario Forecasts
Chapter 6. Market Dynamics
6.1. Processed Vegetable Market Drivers
6.2. Processed Vegetable Market Challenges
6.6. Processed Vegetable Market Opportunities
6.4. Processed Vegetable Market Trends
Chapter 7. Global Processed Vegetable Market Outlook Trends
7.1. Global Processed Vegetable Revenue (USD Million) and CAGR (%) by Type (2021-2032)
7.2. Global Processed Vegetable Revenue (USD Million) and CAGR (%) by Application (2021-2032)
7.3. Global Processed Vegetable Revenue (USD Million) and CAGR (%) by Product (2021-2032)
By Product
Canned vegetables
Frozen vegetables
Fresh-cut vegetables
By Distribution Channel
Supermarkets/Hypermarkets
Independent retailers and convenience store
Specialty food stores
Online retailers
Chapter 8. Global Processed Vegetable Regional Analysis and Outlook
8.1. Global Processed Vegetable Revenue (USD Million) By Regions (2021- 2032)
8.2. North America Processed Vegetable Revenue (USD Million) by Country (2021-2032)
8.2.1. United States Processed Vegetable Regional Analysis and Outlook
8.2.2. Canada Processed Vegetable Regional Analysis and Outlook
8.2.3. Mexico Processed Vegetable Regional Analysis and Outlook
8.3. Europe Processed Vegetable Revenue (USD Million), by Country (2021-2032)
8.3.1. Germany Processed Vegetable Regional Analysis and Outlook
8.3.2. France Processed Vegetable Regional Analysis and Outlook
8.3.3. United Kingdom Processed Vegetable Regional Analysis and Outlook
8.3.4. Spain Processed Vegetable Regional Analysis and Outlook
8.3.5. Italy Processed Vegetable Regional Analysis and Outlook
8.3.6. Russia Processed Vegetable Regional Analysis and Outlook
8.3.7. Rest of Europe Processed Vegetable Regional Analysis and Outlook
8.4. Asia Pacific Processed Vegetable Revenue (USD Million) by Country (2021-2032)
8.4.1. China Processed Vegetable Regional Analysis and Outlook
8.4.2. Japan Processed Vegetable Regional Analysis and Outlook
8.4.3. India Processed Vegetable Regional Analysis and Outlook
8.4.4. South Korea Processed Vegetable Regional Analysis and Outlook
8.4.5. Australia Processed Vegetable Regional Analysis and Outlook
8.4.6. South East Asia Processed Vegetable Regional Analysis and Outlook
8.4.7. Rest of Asia Pacific Processed Vegetable Regional Analysis and Outlook
8.5. South America Processed Vegetable Revenue (USD Million), by Country (2021-2032)
8.5.1. Brazil Processed Vegetable Regional Analysis and Outlook
8.5.2. Argentina Processed Vegetable Regional Analysis and Outlook
8.5.3. Rest of South America Processed Vegetable Regional Analysis and Outlook
8.6. Middle East and Africa Processed Vegetable Revenue (USD Million) by Country (2021-2032)
8.6.1. Middle East Processed Vegetable Regional Analysis and Outlook
8.6.2. Africa Processed Vegetable Regional Analysis and Outlook
Chapter 9. North America Processed Vegetable Analysis and Outlook
9.1. North America Processed Vegetable Revenue (USD Million) by Segments (2021-2032)
9.1.1. North America Processed Vegetable Revenue (USD Million) by Type (2021-2032)
9.1.2. North America Processed Vegetable Revenue (USD Million) by Application (2021-2032)
9.1.3. North America Processed Vegetable Revenue (USD Million) by Product (2021-2032)
By Product
Canned vegetables
Frozen vegetables
Fresh-cut vegetables
By Distribution Channel
Supermarkets/Hypermarkets
Independent retailers and convenience store
Specialty food stores
Online retailers
Chapter 10. Europe Processed Vegetable Analysis and Outlook
10.1. Europe Processed Vegetable Revenue (USD Million), by Segments (USD Million) (2021-2032)
10.1.1. Europe Processed Vegetable Revenue (USD Million) by Type (2021-2032)
10.1.2. Europe Processed Vegetable Revenue (USD Million) by Application (2021-2032)
10.1.3. Europe Processed Vegetable Revenue (USD Million) by Product (2021-2032)
By Product
Canned vegetables
Frozen vegetables
Fresh-cut vegetables
By Distribution Channel
Supermarkets/Hypermarkets
Independent retailers and convenience store
Specialty food stores
Online retailers
Chapter 11. Asia Pacific Processed Vegetable Analysis and Outlook
11.1. Asia Pacific Processed Vegetable Revenue (USD Million), and Revenue (USD Million) by Segments (2021-2032)
11.1.1. Asia Pacific Processed Vegetable Revenue (USD Million) by Type (2021-2032)
11.1.2. Asia Pacific Processed Vegetable Revenue (USD Million) by Application (2021-2032)
11.1.3. Asia Pacific Processed Vegetable Revenue (USD Million) by Product (2021-2032)
By Product
Canned vegetables
Frozen vegetables
Fresh-cut vegetables
By Distribution Channel
Supermarkets/Hypermarkets
Independent retailers and convenience store
Specialty food stores
Online retailers
Chapter 12. South America Processed Vegetable Analysis and Outlook
12.1. South America Processed Vegetable Revenue (USD Million), by Segments (2021-2032)
12.1.1. South America Processed Vegetable Revenue (USD Million) by Type (2021-2032)
12.1.2. South America Processed Vegetable Revenue (USD Million) by Application (2021-2032)
12.1.3. South America Processed Vegetable Revenue (USD Million) by Product (2021-2032)
By Product
Canned vegetables
Frozen vegetables
Fresh-cut vegetables
By Distribution Channel
Supermarkets/Hypermarkets
Independent retailers and convenience store
Specialty food stores
Online retailers
Chapter 13. Middle East and Africa Processed Vegetable Analysis and Outlook
13.1. Middle East and Africa Processed Vegetable Revenue (USD Million), by Segments (2021-2032)
13.1.1. Middle East and Africa Processed Vegetable Revenue (USD Million) by Type (2021-2032)
13.1.2. Middle East and Africa Processed Vegetable Revenue (USD Million) by Application (2021-2032)
13.1.3. Middle East and Africa Processed Vegetable Revenue (USD Million) by Product (2021-2032)
By Product
Canned vegetables
Frozen vegetables
Fresh-cut vegetables
By Distribution Channel
Supermarkets/Hypermarkets
Independent retailers and convenience store
Specialty food stores
Online retailers
Chapter 14. Processed Vegetable Company Profiles
14.1 Business Overview
14.2 Product Profiles
14.3 SWOT Profiles
14.5 Recent Developments
14.6 Financial Profile
List of Companies
Amazon.com Inc
Archer Daniels Midland Company (ADM)
Charoen Pokphand Foods PCL
Conagra Brands Inc
Cooperatie Koninklijke Cosun UA
Dole plc
Farmers Market Foods Inc
J.D. Irving Ltd
LibBys Brand Holding
Mitsubishi Corp
Ninos Fresh Cut Fruit and Veg LLC
NutriAsia Inc
RFG Holdings Ltd
Seneca Foods Corp
Smith Frozen Foods Inc
Sprouts Farmers Market Inc
Sysco Corp
The Fresh Gourmet Co.
15. Methodology and Data Sources
15.1 Customization Offerings
15.2 Subscription Services
15.3 Related Reports
15.4 Publisher Expertise
LIST OF TABLES
Table 1 Market Segmentation Analysis
Table 2 Global Processed Vegetable Market Share of Leading Companies, 2023
Table 3 Product Offerings of Leading Companies
Table 4 Low Growth Scenario Forecasts
Table 5 Reference Case Growth Scenario
Table 6 High Growth Case Scenario
Table 7 Global Processed Vegetable Revenue (USD Million) And CAGR (%) By Type (2021-2032)
Table 8 Global Processed Vegetable Revenue (USD Million) And CAGR (%) By Application (2021-2032)
Table 9 Global Processed Vegetable Revenue (USD Million) And CAGR (%) By Product (2021-2032)
Table 10 Global Processed Vegetable Market Revenue (USD Million) By Regions (2021-2032)
Table 11 Global Processed Vegetable Market Share (%) By Regions (2021-2032)
Table 12 North America Processed Vegetable Revenue (USD Million) By Country (2021-2032)
Table 13 Europe Processed Vegetable Revenue (USD Million) By Country (2021-2032)
Table 14 Asia Pacific Processed Vegetable Revenue (USD Million) By Country (2021-2032)
Table 15 South America Processed Vegetable Revenue (USD Million) By Country (2021-2032)
Table 16 Middle East and Africa Processed Vegetable Revenue (USD Million) By Region (2021-2032)
Table 17 North America Processed Vegetable Revenue (USD Million) By Type (2021-2032)
Table 18 North America Processed Vegetable Revenue (USD Million) By Application (2021-2032)
Table 19 North America Processed Vegetable Revenue (USD Million) By Product (2021-2032)
Table 20 Europe Processed Vegetable Revenue (USD Million) By Type (2021-2032)
Table 21 Europe Processed Vegetable Revenue (USD Million) By Application (2021-2032)
Table 22 Europe Processed Vegetable Revenue (USD Million) By Product (2021-2032)
Table 23 Asia Pacific Processed Vegetable Revenue (USD Million) By Type (2021-2032)
Table 24 Asia Pacific Processed Vegetable Revenue (USD Million) By Application (2021-2032)
Table 25 Asia Pacific Processed Vegetable Revenue (USD Million) By Product (2021-2032)
Table 26 South America Processed Vegetable Revenue (USD Million) By Type (2021-2032)
Table 27 South America Processed Vegetable Revenue (USD Million) By Application (2021-2032)
Table 28 South America Processed Vegetable Revenue (USD Million) By Product (2021-2032)
Table 29 Middle East and Africa Processed Vegetable Revenue (USD Million) By Type (2021-2032)
Table 30 Middle East and Africa Processed Vegetable Revenue (USD Million) By Application (2021-2032)
Table 31 Middle East and Africa Processed Vegetable Revenue (USD Million) By Product (2021-2032)
LIST OF FIGURES
Figure 1. Market Scope
Figure 2. Pricing Forecasts Per Unit, 2023- 2032
Figure 3. Porter’s Five Forces
Figure 4. Global Processed Vegetable Market Revenue (USD Million) By Regions (2021-2032)
Figure 5. Global Processed Vegetable Market Share (%) By Regions (2023)
Figure 6. North America Processed Vegetable Revenue (USD Million) By Country (2021-2032)
Figure 7. United States Processed Vegetable Revenue (USD Million) By Country (2021-2032)
Figure 8. Canada Processed Vegetable Revenue (USD Million) By Country (2021-2032)
Figure 9. Mexico Processed Vegetable Revenue (USD Million) By Country (2021-2032)
Figure 10. Europe Processed Vegetable Revenue (USD Million) By Country (2021-2032)
Figure 11. Germany Processed Vegetable Revenue (USD Million) By Country (2021-2032)
Figure 12. France Processed Vegetable Revenue (USD Million) By Country (2021-2032)
Figure 13. United Kingdom Processed Vegetable Revenue (USD Million) By Country (2021-2032)
Figure 14. Spain Processed Vegetable Revenue (USD Million) By Country (2021-2032)
Figure 15. Italy Processed Vegetable Revenue (USD Million) By Country (2021-2032)
Figure 16. Russia Processed Vegetable Revenue (USD Million) By Country (2021-2032)
Figure 17. Rest of Europe Processed Vegetable Revenue (USD Million) By Country (2021-2032)
Figure 11. Asia Pacific Processed Vegetable Revenue (USD Million) By Country (2021-2032)
Figure 12. China Processed Vegetable Revenue (USD Million) By Country (2021-2032)
Figure 13. Japan Processed Vegetable Revenue (USD Million) By Country (2021-2032)
Figure 14. India Processed Vegetable Revenue (USD Million) By Country (2021-2032)
Figure 15. South Korea Processed Vegetable Revenue (USD Million) By Country (2021-2032)
Figure 16. Australia Processed Vegetable Revenue (USD Million) By Country (2021-2032)
Figure 17. South East Asia Processed Vegetable Revenue (USD Million) By Country (2021-2032)
Figure 18. South America Processed Vegetable Revenue (USD Million) By Country (2021-2032)
Figure 19. Brazil Processed Vegetable Revenue (USD Million) By Country (2021-2032)
Figure 20. Argentina Processed Vegetable Revenue (USD Million) By Country (2021-2032)
Figure 21. Rest of Asia Pacific Processed Vegetable Revenue (USD Million) By Country (2021-2032)
Figure 22. Middle East and Africa Processed Vegetable Revenue (USD Million) By Region (2021-2032)
Figure 23. Saudi Arabia Processed Vegetable Revenue (USD Million) By Region (2021-2032)
Figure 24. The UAE Processed Vegetable Revenue (USD Million) By Region (2021-2032)
Figure 25. Rest of Middle East Processed Vegetable Revenue (USD Million) By Region (2021-2032)
Figure 26. South Africa Processed Vegetable Revenue (USD Million) By Region (2021-2032)
Figure 27. Africa Processed Vegetable Revenue (USD Million) By Region (2021-2032)
Figure 28. North America Processed Vegetable Revenue (USD Million) By Type (2021-2032)
Figure 29. North America Processed Vegetable Revenue (USD Million) By Application (2021-2032)
Figure 30. North America Processed Vegetable Revenue (USD Million) By Product (2021-2032)
Figure 31. Europe Processed Vegetable Revenue (USD Million) By Type (2021-2032)
Figure 32. Europe Processed Vegetable Revenue (USD Million) By Application (2021-2032)
Figure 33. Europe Processed Vegetable Revenue (USD Million) By Product (2021-2032)
Figure 34. Asia Pacific Processed Vegetable Revenue (USD Million) By Type (2021-2032)
Figure 35. Asia Pacific Processed Vegetable Revenue (USD Million) By Application (2021-2032)
Figure 36. Asia Pacific Processed Vegetable Revenue (USD Million) By Product (2021-2032)
Figure 37. South America Processed Vegetable Revenue (USD Million) By Type (2021-2032)
Figure 38. South America Processed Vegetable Revenue (USD Million) By Application (2021-2032)
Figure 39. South America Processed Vegetable Revenue (USD Million) By Product (2021-2032)
Figure 40. Middle East and Africa Processed Vegetable Revenue (USD Million) By Type (2021-2032)
Figure 41. Middle East and Africa Processed Vegetable Revenue (USD Million) By Application (2021-2032)
Figure 42. Middle East and Africa Processed Vegetable Revenue (USD Million) By Product (2021-2032)
By Product
Canned vegetables
Frozen vegetables
Fresh-cut vegetables
By Distribution Channel
Supermarkets/Hypermarkets
Independent retailers and convenience store
Specialty food stores
Online retailers
Countries Analyzed
North America (US, Canada, Mexico)
Europe (Germany, UK, France, Spain, Italy, Russia, Rest of Europe)
Asia Pacific (China, India, Japan, South Korea, Australia, South East Asia, Rest of Asia)
South America (Brazil, Argentina, Rest of South America)
Middle East and Africa (Saudi Arabia, UAE, Rest of Middle East, South Africa, Egypt, Rest of Africa)
