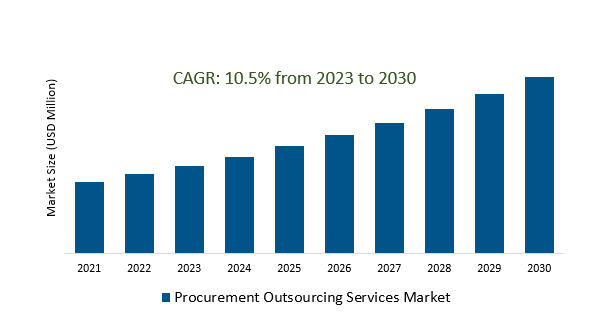
The Procurement Outsourcing Services Market Size is estimated to register 10.5% growth over the forecast period from 2023 to 2030.
Procurement Outsourcing Services Market Overview
The pursuit of cost efficiency and savings, compelling organizations to leverage outsourcing to streamline procurement processes, negotiate better deals, and optimize expenditures are the primary factors. Emphasis on strategic sourcing approaches focusing on supplier relationship management, category expertise, and data-driven decision-making to achieve cost savings, mitigate risks, and drive innovation in procurement strategies. Cost efficiency, focus on core competencies, access to specialized expertise, globalization, and technological advancements are primary drivers. Increased adoption of integrated procurement outsourcing models combining technology, consulting, and managed services, allowing businesses to optimize resources, drive innovation, and achieve procurement objectives more effectively.
Procurement Outsourcing Services Market Dynamics
Market Trends- The Procurement Outsourcing Services Market is witnessing a shift towards strategic procurement focus.
Strategic procurement focuses on enhancing supplier collaboration, optimizing sourcing strategies, and driving innovation throughout the supply chain.
Organizations are emphasizing supplier relationships, data-driven decision-making, and category management to drive innovation, cost savings, and procurement excellence.
Further, Service providers are offering strategic advisory services to assist businesses in achieving these objectives, reflecting a fundamental change in procurement strategies towards creating competitive advantages and operational efficiencies.
Market Driver- Risk management and compliance drives strategies within the Procurement Outsourcing Services Market.
Globalization and stringent regulations necessitate robust risk strategies, making outsourcing an efficient means to ensure compliance and manage legal risks, driving the market demand.
Enabling companies to tap into expert resources proficient in regulatory compliance, thereby ensuring adherence to standards and mitigating legal risks are fueling the market growth.
Further, the evolving business environment, marked by frequent supply chain disruptions are propelling the necessity for proactive risk assessment and mitigation strategies.
Market Opportunity- Cost efficiency and savings drive the Procurement Outsourcing Services Market.
The desire for operational optimization, where businesses aim to leverage outsourcing expertise to streamline processes and achieve cost efficiencies is fueling the market demand.
Strategic partnerships are on the rise, with organizations seeking long-term collaborations with outsourcing service providers to achieve economies of scale and enhance operational efficiencies.
Outsourcing non-core procurement functions, enabling organizations to redirect resources towards core competencies are driving cost savings and enhancing overall efficiency.
Market Share Analysis- Business Process Outsourcing Services will register the fastest growth.
The Procurement Outsourcing Services Market is analyzed across Business Process, Outsourcing Services & Consulting Services. Business Process Outsourcing Services is poised to register the fastest growth. These services encompass a wide spectrum, including transactional processing, supplier management, procurement analytics, and data management. BPO providers assist organizations in streamlining their procurement operations by handling routine tasks like purchase order processing, invoice management, vendor management, and catalog management. Moreover, they employ advanced technologies and automation tools to enhance efficiency and accuracy in procurement processes. BPO services also extend to strategic functions such as spending analysis, market intelligence, and supplier relationship management, aiding organizations in making informed decisions, negotiating better deals, and driving cost savings.
Market Share Analysis- Solution held a significant market share in 2023.
The Procurement Outsourcing Services Market is analyzed across various components including Solution & Services. Of these, Solution held a significant market share in 2023. These solutions include e-procurement software, spend management systems, supplier management tools, and other technology-driven platforms tailored to automate workflows, enhance visibility, and improve efficiency across purchasing activities. Procurement Solutions are instrumental in facilitating better decision-making, cost savings, and process optimization within organizations. They offer functionalities such as e-sourcing, contract management, catalog management, and analytics to support strategic procurement objectives. Moreover, these solutions often integrate with enterprise resource planning (ERP) systems, providing seamless connectivity across different organizational functions. The significance of procurement solutions lies in their ability to leverage technology for enhancing procurement strategies and fostering improved outcomes within the broader procurement landscape.
Procurement Outsourcing Services Market Segmentation
By Services
- Business Process Outsourcing Services
- Consulting Services
By Component
By Deployment
By Application
- Marketing Related Services
- IT Related Services
- HR Related Services
- Facilities Management Office Services
- Others
By Region
- North America (United States, Canada, Mexico)
- Europe (Germany, France, United Kingdom, Spain, Italy, Others)
- Asia Pacific (China, India, Japan, South Korea, Australia, Others)
- Latin America (Brazil, Argentina, Others)
- Middle East and Africa (Saudi Arabia, UAE, Kuwait, Other Middle East, South Africa, Nigeria, Other Africa)
Procurement Outsourcing Services Market Companies
- Accenture Plc
- Genpact Ltd
- DXC Technology Company
- WNS Ltd
- Infosys Ltd
- Wipro Ltd
- Capgemini SE
- GEP
- International Business Machines Corporation
- Tata Consultancy Services Ltd
*List not exhaustive
Procurement Outsourcing Services Market Outlook 2023
1 Market Overview
1.1 Introduction to the Procurement Outsourcing Services Market
1.2 Scope of the Study
1.3 Research Objective
1.3.1 Key Market Scope and Segments
1.3.2 Players Covered
1.3.3 Years Considered
2 Executive Summary
2.1 2023 Procurement Outsourcing Services Industry- Market Statistics
3 Market Dynamics
3.1 Market Drivers
3.2 Market Challenges
3.3 Market Opportunities
3.4 Market Trends
4 Market Factor Analysis
4.1 Porter’s Five Forces
4.2 Market Entropy
4.2.1 Global Procurement Outsourcing Services Market Companies with Area Served
4.2.2 Products Offerings Global Procurement Outsourcing Services Market
5 COVID-19 Impact Analysis and Outlook Scenarios
5.1.1 Covid-19 Impact Analysis
5.1.2 post-COVID-19 Scenario- Low Growth Case
5.1.3 post-COVID-19 Scenario- Reference Growth Case
5.1.4 post-COVID-19 Scenario- Low Growth Case
6 Global Procurement Outsourcing Services Market Trends
6.1 Global Procurement Outsourcing Services Revenue (USD Million) and CAGR (%) by Type (2018-2030)
6.2 Global Procurement Outsourcing Services Revenue (USD Million) and CAGR (%) by Applications (2018-2030)
6.3 Global Procurement Outsourcing Services Revenue (USD Million) and CAGR (%) by regions (2018-2030)
7 Global Procurement Outsourcing Services Market Revenue (USD Million) by Type, and Applications (2018-2022)
7.1 Global Procurement Outsourcing Services Revenue (USD Million) by Type (2018-2022)
7.1.1 Global Procurement Outsourcing Services Revenue (USD Million), Market Share (%) by Type (2018-2022)
7.2 Global Procurement Outsourcing Services Revenue (USD Million) by Applications (2018-2022)
7.2.1 Global Procurement Outsourcing Services Revenue (USD Million), Market Share (%) by Applications (2018-2022)
8 Global Procurement Outsourcing Services Development Regional Status and Outlook
8.1 Global Procurement Outsourcing Services Revenue (USD Million) By Regions (2018-2022)
8.2 North America Procurement Outsourcing Services Revenue (USD Million) by Type, and Application (2018-2022)
8.2.1 North America Procurement Outsourcing Services Revenue (USD Million) by Country (2018-2022)
8.2.2 North America Procurement Outsourcing Services Revenue (USD Million) by Type (2018-2022)
8.2.3 North America Procurement Outsourcing Services Revenue (USD Million) by Applications (2018-2022)
8.3 Europe Procurement Outsourcing Services Revenue (USD Million), by Type, and Applications (USD Million) (2018-2022)
8.3.1 Europe Procurement Outsourcing Services Revenue (USD Million), by Country (2018-2022)
8.3.2 Europe Procurement Outsourcing Services Revenue (USD Million) by Type (2018-2022)
8.3.3 Europe Procurement Outsourcing Services Revenue (USD Million) by Applications (2018-2022)
8.4 Asia Pacific Procurement Outsourcing Services Revenue (USD Million), and Revenue (USD Million) by Type, and Applications (2018-2022)
8.4.1 Asia Pacific Procurement Outsourcing Services Revenue (USD Million) by Country (2018-2022)
8.4.2 Asia Pacific Procurement Outsourcing Services Revenue (USD Million) by Type (2018-2022)
8.4.3 Asia Pacific Procurement Outsourcing Services Revenue (USD Million) by Applications (2018-2022)
8.5 South America Procurement Outsourcing Services Revenue (USD Million), by Type, and Applications (2018-2022)
8.5.1 South America Procurement Outsourcing Services Revenue (USD Million), by Country (2018-2022)
8.5.2 South America Procurement Outsourcing Services Revenue (USD Million) by Type (2018-2022)
8.5.3 South America Procurement Outsourcing Services Revenue (USD Million) by Applications (2018-2022)
8.6 Middle East and Africa Procurement Outsourcing Services Revenue (USD Million), by Type, Technology, Application, Thickness (2018-2022)
8.6.1 Middle East and Africa Procurement Outsourcing Services Revenue (USD Million) by Country (2018-2022)
8.6.2 Middle East and Africa Procurement Outsourcing Services Revenue (USD Million) by Type (2018-2022)
8.6.3 Middle East and Africa Procurement Outsourcing Services Revenue (USD Million) by Applications (2018-2022)
9 Company Profiles
10 Global Procurement Outsourcing Services Market Revenue (USD Million), by Type, and Applications (2023-2030)
10.1 Global Procurement Outsourcing Services Revenue (USD Million) and Market Share (%) by Type (2023-2030)
10.1.1 Global Procurement Outsourcing Services Revenue (USD Million), and Market Share (%) by Type (2023-2030)
10.2 Global Procurement Outsourcing Services Revenue (USD Million) and Market Share (%) by Applications (2023-2030)
10.2.1 Global Procurement Outsourcing Services Revenue (USD Million), and Market Share (%) by Applications (2023-2030)
11 Global Procurement Outsourcing Services Development Regional Status and Outlook Forecast
11.1 Global Procurement Outsourcing Services Revenue (USD Million) By Regions (2023-2030)
11.2 North America Procurement Outsourcing Services Revenue (USD Million) by Type, and Applications (2023-2030)
11.2.1 North America Procurement Outsourcing Services Revenue (USD) Million by Country (2023-2030)
11.2.2 North America Procurement Outsourcing Services Revenue (USD Million), by Type (2023-2030)
11.2.3 North America Procurement Outsourcing Services Revenue (USD Million), Market Share (%) by Applications (2023-2030)
11.3 Europe Procurement Outsourcing Services Revenue (USD Million), by Type, and Applications (2023-2030)
11.3.1 Europe Procurement Outsourcing Services Revenue (USD Million), by Country (2023-2030)
11.3.2 Europe Procurement Outsourcing Services Revenue (USD Million), by Type (2023-2030)
11.3.3 Europe Procurement Outsourcing Services Revenue (USD Million), by Applications (2023-2030)
11.4 Asia Pacific Procurement Outsourcing Services Revenue (USD Million) by Type, and Applications (2023-2030)
11.4.1 Asia Pacific Procurement Outsourcing Services Revenue (USD Million), by Country (2023-2030)
11.4.2 Asia Pacific Procurement Outsourcing Services Revenue (USD Million), by Type (2023-2030)
11.4.3 Asia Pacific Procurement Outsourcing Services Revenue (USD Million), by Applications (2023-2030)
11.5 South America Procurement Outsourcing Services Revenue (USD Million), by Type, and Applications (2023-2030)
11.5.1 South America Procurement Outsourcing Services Revenue (USD Million), by Country (2023-2030)
11.5.2 South America Procurement Outsourcing Services Revenue (USD Million), by Type (2023-2030)
11.5.3 South America Procurement Outsourcing Services Revenue (USD Million), by Applications (2023-2030)
11.6 Middle East and Africa Procurement Outsourcing Services Revenue (USD Million), by Type, and Applications (2023-2030)
11.6.1 Middle East and Africa Procurement Outsourcing Services Revenue (USD Million), by region (2023-2030)
11.6.2 Middle East and Africa Procurement Outsourcing Services Revenue (USD Million), by Type (2023-2030)
11.6.3 Middle East and Africa Procurement Outsourcing Services Revenue (USD Million), by Applications (2023-2030)
12 Methodology and Data Sources
12.1 Methodology/Research Approach
12.1.1 Research Programs/Design
12.1.2 Market Size Estimation
12.1.3 Market Breakdown and Data Triangulation
12.2 Data Sources
12.2.1 Secondary Sources
12.2.2 Primary Sources
12.3 Disclaimer
List of Tables
Table 1 Market Segmentation Analysis
Table 2 Global Procurement Outsourcing Services Market Companies with Areas Served
Table 3 Products Offerings Global Procurement Outsourcing Services Market
Table 4 Low Growth Scenario Forecasts
Table 5 Reference Case Growth Scenario
Table 6 High Growth Case Scenario
Table 7 Global Procurement Outsourcing Services Revenue (USD Million) And CAGR (%) By Type (2018-2030)
Table 8 Global Procurement Outsourcing Services Revenue (USD Million) And CAGR (%) By Applications (2018-2030)
Table 9 Global Procurement Outsourcing Services Revenue (USD Million) And CAGR (%) By Regions (2018-2030)
Table 10 Global Procurement Outsourcing Services Revenue (USD Million) By Type (2018-2022)
Table 11 Global Procurement Outsourcing Services Revenue Market Share (%) By Type (2018-2022)
Table 12 Global Procurement Outsourcing Services Revenue (USD Million) By Applications (2018-2022)
Table 13 Global Procurement Outsourcing Services Revenue Market Share (%) By Applications (2018-2022)
Table 14 Global Procurement Outsourcing Services Market Revenue (USD Million) By Regions (2018-2022)
Table 15 Global Procurement Outsourcing Services Market Share (%) By Regions (2018-2022)
Table 16 North America Procurement Outsourcing Services Revenue (USD Million) By Country (2018-2022)
Table 17 North America Procurement Outsourcing Services Revenue (USD Million) By Type (2018-2022)
Table 18 North America Procurement Outsourcing Services Revenue (USD Million) By Applications (2018-2022)
Table 19 Europe Procurement Outsourcing Services Revenue (USD Million) By Country (2018-2022)
Table 20 Europe Procurement Outsourcing Services Revenue (USD Million) By Type (2018-2022)
Table 21 Europe Procurement Outsourcing Services Revenue (USD Million) By Applications (2018-2022)
Table 22 Asia Pacific Procurement Outsourcing Services Revenue (USD Million) By Country (2018-2022)
Table 23 Asia Pacific Procurement Outsourcing Services Revenue (USD Million) By Type (2018-2022)
Table 24 Asia Pacific Procurement Outsourcing Services Revenue (USD Million) By Applications (2018-2022)
Table 25 South America Procurement Outsourcing Services Revenue (USD Million) By Country (2018-2022)
Table 26 South America Procurement Outsourcing Services Revenue (USD Million) By Type (2018-2022)
Table 27 South America Procurement Outsourcing Services Revenue (USD Million) By Applications (2018-2022)
Table 28 Middle East and Africa Procurement Outsourcing Services Revenue (USD Million) By Region (2018-2022)
Table 29 Middle East and Africa Procurement Outsourcing Services Revenue (USD Million) By Type (2018-2022)
Table 30 Middle East and Africa Procurement Outsourcing Services Revenue (USD Million) By Applications (2018-2022)
Table 31 Financial Analysis
Table 32 Global Procurement Outsourcing Services Revenue (USD Million) By Type (2023-2030)
Table 33 Global Procurement Outsourcing Services Revenue Market Share (%) By Type (2023-2030)
Table 34 Global Procurement Outsourcing Services Revenue (USD Million) By Applications (2023-2030)
Table 35 Global Procurement Outsourcing Services Revenue Market Share (%) By Applications (2023-2030)
Table 36 Global Procurement Outsourcing Services Market Revenue (USD Million), And Revenue (USD Million) By Regions (2023-2030)
Table 37 North America Procurement Outsourcing Services Revenue (USD)By Country (2023-2030)
Table 38 North America Procurement Outsourcing Services Revenue (USD Million) By Type (2023-2030)
Table 39 North America Procurement Outsourcing Services Revenue (USD Million) By Applications (2023-2030)
Table 40 Europe Procurement Outsourcing Services Revenue (USD Million) By Country (2023-2030)
Table 41 Europe Procurement Outsourcing Services Revenue (USD Million) By Type (2023-2030)
Table 42 Europe Procurement Outsourcing Services Revenue (USD Million) By Applications (2023-2030)
Table 43 Asia Pacific Procurement Outsourcing Services Revenue (USD Million) By Country (2023-2030)
Table 44 Asia Pacific Procurement Outsourcing Services Revenue (USD Million) By Type (2023-2030)
Table 45 Asia Pacific Procurement Outsourcing Services Revenue (USD Million) By Applications (2023-2030)
Table 46 South America Procurement Outsourcing Services Revenue (USD Million) By Country (2023-2030)
Table 47 South America Procurement Outsourcing Services Revenue (USD Million) By Type (2023-2030)
Table 48 South America Procurement Outsourcing Services Revenue (USD Million) By Applications (2023-2030)
Table 49 Middle East and Africa Procurement Outsourcing Services Revenue (USD Million) By Region (2023-2030)
Table 50 Middle East and Africa Procurement Outsourcing Services Revenue (USD Million) By Region (2023-2030)
Table 51 Middle East and Africa Procurement Outsourcing Services Revenue (USD Million) By Type (2023-2030)
Table 52 Middle East and Africa Procurement Outsourcing Services Revenue (USD Million) By Applications (2023-2030)
Table 53 Research Programs/Design for This Report
Table 54 Key Data Information from Secondary Sources
Table 55 Key Data Information from Primary Sources
List of Figures
Figure 1 Market Scope
Figure 2 Porter’s Five Forces
Figure 3 Global Procurement Outsourcing Services Revenue (USD Million) By Type (2018-2022)
Figure 4 Global Procurement Outsourcing Services Revenue Market Share (%) By Type (2022)
Figure 5 Global Procurement Outsourcing Services Revenue (USD Million) By Applications (2018-2022)
Figure 6 Global Procurement Outsourcing Services Revenue Market Share (%) By Applications (2022)
Figure 7 Global Procurement Outsourcing Services Market Revenue (USD Million) By Regions (2018-2022)
Figure 8 Global Procurement Outsourcing Services Market Share (%) By Regions (2022)
Figure 9 North America Procurement Outsourcing Services Revenue (USD Million) By Country (2018-2022)
Figure 10 North America Procurement Outsourcing Services Revenue (USD Million) By Type (2018-2022)
Figure 11 North America Procurement Outsourcing Services Revenue (USD Million) By Applications (2018-2022)
Figure 12 Europe Procurement Outsourcing Services Revenue (USD Million) By Country (2018-2022)
Figure 13 Europe Procurement Outsourcing Services Revenue (USD Million) By Type (2018-2022)
Figure 14 Europe Procurement Outsourcing Services Revenue (USD Million) By Applications (2018-2022)
Figure 15 Asia Pacific Procurement Outsourcing Services Revenue (USD Million) By Country (2018-2022)
Figure 16 Asia Pacific Procurement Outsourcing Services Revenue (USD Million) By Type (2018-2022)
Figure 17 Asia Pacific Procurement Outsourcing Services Revenue (USD Million) By Applications (2018-2022)
Figure 18 South America Procurement Outsourcing Services Revenue (USD Million) By Country (2018-2022)
Figure 19 South America Procurement Outsourcing Services Revenue (USD Million) By Type (2018-2022)
Figure 20 South America Procurement Outsourcing Services Revenue (USD Million) By Applications (2018-2022)
Figure 21 Middle East and Africa Procurement Outsourcing Services Revenue (USD Million) By Region (2018-2022)
Figure 22 Middle East and Africa Procurement Outsourcing Services Revenue (USD Million) By Type (2018-2022)
Figure 23 Middle East and Africa Procurement Outsourcing Services Revenue (USD Million) By Applications (2018-2022)
Figure 24 Global Procurement Outsourcing Services Revenue (USD Million) By Type (2023-2030)
Figure 25 Global Procurement Outsourcing Services Revenue Market Share (%) By Type (2030)
Figure 26 Global Procurement Outsourcing Services Revenue (USD Million) By Applications (2023-2030)
Figure 27 Global Procurement Outsourcing Services Revenue Market Share (%) By Applications (2030)
Figure 28 Global Procurement Outsourcing Services Market Revenue (USD Million) By Regions (2023-2030)
Figure 29 North America Procurement Outsourcing Services Revenue (USD Million) By Country (2023-2030)
Figure 30 North America Procurement Outsourcing Services Revenue (USD Million) By Type (2023-2030)
Figure 31 North America Procurement Outsourcing Services Revenue (USD Million) By Applications (2023-2030)
Figure 32 Europe Procurement Outsourcing Services Revenue (USD Million) By Country (2023-2030)
Figure 33 Europe Procurement Outsourcing Services Revenue (USD Million) By Type (2023-2030)
Figure 34 Europe Procurement Outsourcing Services Revenue (USD Million) By Applications (2023-2030)
Figure 35 Asia Pacific Procurement Outsourcing Services Revenue (USD Million) By Country (2023-2030)
Figure 36 Asia Pacific Procurement Outsourcing Services Revenue (USD Million) By Type (2023-2030)
Figure 37 Asia Pacific Procurement Outsourcing Services Revenue (USD Million) By Applications (2023-2030)
Figure 38 South America Procurement Outsourcing Services Revenue (USD Million) By Country (2023-2030)
Figure 39 South America Procurement Outsourcing Services Revenue (USD Million) By Type (2023-2030)
Figure 40 South America Procurement Outsourcing Services Revenue (USD Million) By Applications (2023-2030)
Figure 41 Middle East and Africa Procurement Outsourcing Services Revenue (USD Million) By Region (2023-2030)
Figure 42 Middle East and Africa Procurement Outsourcing Services Revenue (USD Million) By Region (2023-2030)
Figure 43 Middle East and Africa Procurement Outsourcing Services Revenue (USD Million) By Type (2023-2030)
Figure 44 Middle East and Africa Procurement Outsourcing Services Revenue (USD Million) By Applications (2023-2030)
Figure 45 Bottom-Up and Top-Down Approaches for This Report
Figure 46 Data Triangulation
