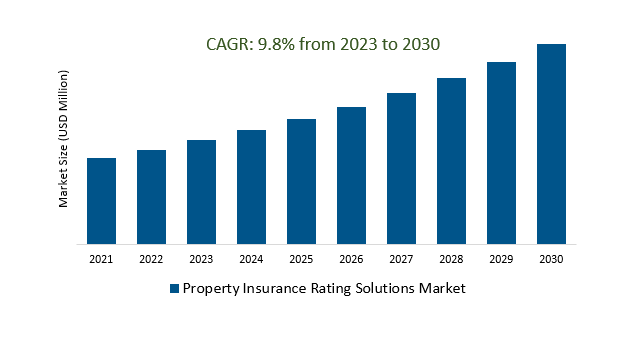
The Global property insurance rating solutions Market Size is estimated to register 9.8% growth over the forecast period from 2023 to 2030.
The property insurance rating solutions market is driven by factors such as increasing property ownership, rising risk awareness, regulatory compliance, data analytics and AI, and customer expectations. The market is also influenced by usage-based insurance (UBI), blockchain technology, climate risk assessment, insurance innovation, cyber insurance, customer experience focus, and sustainability and ESG factors. UBI uses telematics and IoT devices to collect data on property conditions, while blockchain technology improves transparency and trust in the insurance industry. Climate risk assessment is integrated into rating models to better understand and price climate-related risks. Insurtech innovation disrupts traditional insurance markets, while cyber insurance is becoming a significant part of the market. Customer experience focus focuses on improving the customer experience, and ESG factors are being incorporated into risk assessment and pricing.
The Surge in Demand for Advanced Property Insurance Rating Solutions is boosting the market.
The upswing can be attributed to several factors, including the growing complexity of property insurance risks, the desire for more accurate pricing models, and the need to stay competitive in a rapidly evolving industry. Insurance companies are increasingly recognizing the importance of leveraging advanced technology, data analytics, and artificial intelligence to assess property risks more effectively. As a result, they are actively seeking innovative rating solutions that can help them underwrite policies more accurately, reduce losses, and enhance overall profitability. This growing demand is propelling the Property Insurance Rating Solutions Market to new heights, fostering an environment of innovation and competitiveness among solution providers. In this dynamic landscape, companies that offer cutting-edge rating solutions are poised to thrive and make a significant impact on the property insurance industry.
Elevated Risk Awareness is creating a Demand for Advanced Property Insurance Rating Solutions.
The heightened awareness of risks in today's unpredictable world has significantly increased the demand for advanced property insurance rating solutions within the Property Insurance Rating Solutions Market. As individuals and businesses become more cognizant of the potential threats to their assets, they are seeking comprehensive and customized insurance coverage. This surge in risk consciousness has necessitated the development of cutting-edge rating solutions that can accurately assess and price property insurance policies. These advanced solutions leverage data analytics, artificial intelligence, and predictive modelling to provide insurers with precise risk assessments, enabling them to offer more competitive and tailored insurance products. Consequently, the Property Insurance Rating Solutions Market is experiencing a growing need for innovative tools that enhance risk evaluation and underwriting in response to the evolving risk landscape.
Revolutionizing Property Insurance with Usage-Based Insurance (UBI) is attracting a wide customer base.
The adoption of Usage-Based Insurance (UBI) is revolutionizing the Property Insurance Rating Solutions Market by offering a dynamic and personalized approach to coverage. This innovative approach is resonating with a broad customer base, as it allows policyholders to pay premiums based on their actual usage and risk factors. UBI leverages data analytics and telematics to assess property usage, occupancy patterns, and security measures, providing insurers with more accurate risk assessments. This not only benefits consumers by potentially lowering their insurance costs but also encourages them to adopt safer practices, ultimately reducing the frequency and severity of claims. As a result, the Property Insurance Rating Solutions Market is experiencing a surge in interest and growth due to the transformative impact of UBI.
Market Share Analysis:
Cloud-based property insurance rating solutions have emerged as the dominant choice in the market.
The cloud-based systems are more cost effective than traditional on-premises solutions, eliminating the need for costly hardware and software investments. Additionally, they offer scalability, accommodate businesses of all sizes, and provide accessibility from anywhere with an internet connection, catering to remote work environments. Security is robust in cloud-based solutions, assuring data protection. Key benefits of these solutions include cost reduction, improved operational efficiency through automation, heightened accuracy through advanced data and analytics tools, and elevated customer service facilitated by real-time access to customer data and rating information for agents.
Enterprise is the most dominant application segment in the property insurance rating solutions market.
Enterprise-level property insurance rating solutions are extensively adopted by large insurance companies and organizations that manage a vast portfolio of properties and assets. These enterprises require sophisticated rating solutions to assess and price risks accurately. Property insurance rating solutions tailored for enterprises offer a wide range of functionalities, including robust risk assessment models, data analytics, and comprehensive reporting tools. Moreover, they can handle complex underwriting processes, manage diverse policy types, and support large-scale data processing, making them indispensable for organizations dealing with substantial property portfolios. Additionally, enterprises often operate in a highly competitive insurance landscape, where pricing accuracy and risk management are crucial for profitability. Therefore, the demand for advanced property insurance rating solutions is particularly pronounced in this segment as companies seek to gain a competitive edge, optimize pricing strategies, and enhance their overall risk management capabilities, solidifying the dominance of the enterprise application segment in the property insurance rating solutions market.
North America holds a prominent position in the property insurance rating solutions market due to several factors.
The dominance is driven by the rising complexity of property insurance risks, including challenges posed by climate change and cyber threats. Insurers increasingly require accurate and current information to precisely price premiums and make informed underwriting decisions. Key players in this market, such as Verisk Analytics, CoreLogic, Moody's Analytics, S&P Global Market Intelligence, and LexisNexis Risk Solutions, offer a range of solutions, including property risk models, data analytics, and underwriting tools. Given insurers' continued investments in risk management solutions, North America is expected to maintain its leadership in the property insurance rating solutions market in the foreseeable future.
property insurance rating solutions Market Segmentation
By Type
By Application
- Enterprise
- Personal
- Channel D
By Region
- North America (United States, Canada, Mexico)
- Europe (Germany, France, United Kingdom, Spain, Italy, Others)
- Asia Pacific (China, India, Japan, South Korea, Australia, Others)
- Latin America (Brazil, Argentina, Others)
- Middle East and Africa (Saudi Arabia, UAE, Kuwait, Other Middle East, South Africa, Nigeria, Other Africa)
property insurance rating solutions market Companies
Leading companies profiled in the study include-
- EZLynx
- Applied Systems
- ACS
- Vertafore
- Velocity
- Sapiens/Maximum Processing
- Agency Matrix
- ITC
- 1Insurer Suite
- Buckhill
- HawkSoft
*List not exhaustive
Property insurance rating solutions Market Outlook 2023
1 Market Overview
1.1 Introduction to the Property insurance rating solutions Market
1.2 Scope of the Study
1.3 Research Objective
1.3.1 Key Market Scope and Segments
1.3.2 Players Covered
1.3.3 Years Considered
2 Executive Summary
2.1 2023 Property insurance rating solutions Industry- Market Statistics
3 Market Dynamics
3.1 Market Drivers
3.2 Market Challenges
3.3 Market Opportunities
3.4 Market Trends
4 Market Factor Analysis
4.1 Porter’s Five Forces
4.2 Market Entropy
4.2.1 Global Property insurance rating solutions Market Companies with Area Served
4.2.2 Products Offerings Global Property insurance rating solutions Market
5 COVID-19 Impact Analysis and Outlook Scenarios
5.1.1 Covid-19 Impact Analysis
5.1.2 Post-COVID-19 Scenario- Low Growth Case
5.1.3 Post-COVID-19 Scenario- Reference Growth Case
5.1.4 Post-COVID-19 Scenario- Low Growth Case
6 Global Property insurance rating solutions Market Trends
6.1 Global Property insurance rating solutions Revenue (USD Million) and CAGR (%) by Type (2018-2030)
6.2 Global Property insurance rating solutions Revenue (USD Million) and CAGR (%) by Applications (2018-2030)
6.3 Global Property insurance rating solutions Revenue (USD Million) and CAGR (%) by Regions (2018-2030)
7 Global Property insurance rating solutions Market Revenue (USD Million) by Type, and Applications (2018-2022)
7.1 Global Property insurance rating solutions Revenue (USD Million) by Type (2018-2022)
7.1.1 Global Property insurance rating solutions Revenue (USD Million), Market Share (%) by Type (2018-2022)
7.2 Global Property insurance rating solutions Revenue (USD Million) by Applications (2018-2022)
7.2.1 Global Property insurance rating solutions Revenue (USD Million), Market Share (%) by Applications (2018-2022)
8 Global Property insurance rating solutions Development Regional Status and Outlook
8.1 Global Property insurance rating solutions Revenue (USD Million) By Regions (2018-2022)
8.2 North America Property insurance rating solutions Revenue (USD Million) by Type, and Application (2018-2022)
8.2.1 North America Property insurance rating solutions Revenue (USD Million) by Country (2018-2022)
8.2.2 North America Property insurance rating solutions Revenue (USD Million) by Type (2018-2022)
8.2.3 North America Property insurance rating solutions Revenue (USD Million) by Applications (2018-2022)
8.3 Europe Property insurance rating solutions Revenue (USD Million), by Type, and Applications (USD Million) (2018-2022)
8.3.1 Europe Property insurance rating solutions Revenue (USD Million), by Country (2018-2022)
8.3.2 Europe Property insurance rating solutions Revenue (USD Million) by Type (2018-2022)
8.3.3 Europe Property insurance rating solutions Revenue (USD Million) by Applications (2018-2022)
8.4 Asia Pacific Property insurance rating solutions Revenue (USD Million), and Revenue (USD Million) by Type, and Applications (2018-2022)
8.4.1 Asia Pacific Property insurance rating solutions Revenue (USD Million) by Country (2018-2022)
8.4.2 Asia Pacific Property insurance rating solutions Revenue (USD Million) by Type (2018-2022)
8.4.3 Asia Pacific Property insurance rating solutions Revenue (USD Million) by Applications (2018-2022)
8.5 South America Property insurance rating solutions Revenue (USD Million), by Type, and Applications (2018-2022)
8.5.1 South America Property insurance rating solutions Revenue (USD Million), by Country (2018-2022)
8.5.2 South America Property insurance rating solutions Revenue (USD Million) by Type (2018-2022)
8.5.3 South America Property insurance rating solutions Revenue (USD Million) by Applications (2018-2022)
8.6 Middle East and Africa Property insurance rating solutions Revenue (USD Million), by Type, Technology, Application, Thickness (2018-2022)
8.6.1 Middle East and Africa Property insurance rating solutions Revenue (USD Million) by Country (2018-2022)
8.6.2 Middle East and Africa Property insurance rating solutions Revenue (USD Million) by Type (2018-2022)
8.6.3 Middle East and Africa Property insurance rating solutions Revenue (USD Million) by Applications (2018-2022)
9 Company Profiles
10 Global Property insurance rating solutions Market Revenue (USD Million), by Type, and Applications (2023-2030)
10.1 Global Property insurance rating solutions Revenue (USD Million) and Market Share (%) by Type (2023-2030)
10.1.1 Global Property insurance rating solutions Revenue (USD Million), and Market Share (%) by Type (2023-2030)
10.2 Global Property insurance rating solutions Revenue (USD Million) and Market Share (%) by Applications (2023-2030)
10.2.1 Global Property insurance rating solutions Revenue (USD Million), and Market Share (%) by Applications (2023-2030)
11 Global Property insurance rating solutions Development Regional Status and Outlook Forecast
11.1 Global Property insurance rating solutions Revenue (USD Million) By Regions (2023-2030)
11.2 North America Property insurance rating solutions Revenue (USD Million) by Type, and Applications (2023-2030)
11.2.1 North America Property insurance rating solutions Revenue (USD) Million by Country (2023-2030)
11.2.2 North America Property insurance rating solutions Revenue (USD Million), by Type (2023-2030)
11.2.3 North America Property insurance rating solutions Revenue (USD Million), Market Share (%) by Applications (2023-2030)
11.3 Europe Property insurance rating solutions Revenue (USD Million), by Type, and Applications (2023-2030)
11.3.1 Europe Property insurance rating solutions Revenue (USD Million), by Country (2023-2030)
11.3.2 Europe Property insurance rating solutions Revenue (USD Million), by Type (2023-2030)
11.3.3 Europe Property insurance rating solutions Revenue (USD Million), by Applications (2023-2030)
11.4 Asia Pacific Property insurance rating solutions Revenue (USD Million) by Type, and Applications (2023-2030)
11.4.1 Asia Pacific Property insurance rating solutions Revenue (USD Million), by Country (2023-2030)
11.4.2 Asia Pacific Property insurance rating solutions Revenue (USD Million), by Type (2023-2030)
11.4.3 Asia Pacific Property insurance rating solutions Revenue (USD Million), by Applications (2023-2030)
11.5 South America Property insurance rating solutions Revenue (USD Million), by Type, and Applications (2023-2030)
11.5.1 South America Property insurance rating solutions Revenue (USD Million), by Country (2023-2030)
11.5.2 South America Property insurance rating solutions Revenue (USD Million), by Type (2023-2030)
11.5.3 South America Property insurance rating solutions Revenue (USD Million), by Applications (2023-2030)
11.6 Middle East and Africa Property insurance rating solutions Revenue (USD Million), by Type, and Applications (2023-2030)
11.6.1 Middle East and Africa Property insurance rating solutions Revenue (USD Million), by Region (2023-2030)
11.6.2 Middle East and Africa Property insurance rating solutions Revenue (USD Million), by Type (2023-2030)
11.6.3 Middle East and Africa Property insurance rating solutions Revenue (USD Million), by Applications (2023-2030)
12 Methodology and Data Sources
12.1 Methodology/Research Approach
12.1.1 Research Programs/Design
12.1.2 Market Size Estimation
12.1.3 Market Breakdown and Data Triangulation
12.2 Data Sources
12.2.1 Secondary Sources
12.2.2 Primary Sources
12.3 Disclaimer
List of Tables
Table 1 Market Segmentation Analysis
Table 2 Global Property insurance rating solutions Market Companies with Areas Served
Table 3 Products Offerings Global Property insurance rating solutions Market
Table 4 Low Growth Scenario Forecasts
Table 5 Reference Case Growth Scenario
Table 6 High Growth Case Scenario
Table 7 Global Property insurance rating solutions Revenue (USD Million) And CAGR (%) By Type (2018-2030)
Table 8 Global Property insurance rating solutions Revenue (USD Million) And CAGR (%) By Applications (2018-2030)
Table 9 Global Property insurance rating solutions Revenue (USD Million) And CAGR (%) By Regions (2018-2030)
Table 10 Global Property insurance rating solutions Revenue (USD Million) By Type (2018-2022)
Table 11 Global Property insurance rating solutions Revenue Market Share (%) By Type (2018-2022)
Table 12 Global Property insurance rating solutions Revenue (USD Million) By Applications (2018-2022)
Table 13 Global Property insurance rating solutions Revenue Market Share (%) By Applications (2018-2022)
Table 14 Global Property insurance rating solutions Market Revenue (USD Million) By Regions (2018-2022)
Table 15 Global Property insurance rating solutions Market Share (%) By Regions (2018-2022)
Table 16 North America Property insurance rating solutions Revenue (USD Million) By Country (2018-2022)
Table 17 North America Property insurance rating solutions Revenue (USD Million) By Type (2018-2022)
Table 18 North America Property insurance rating solutions Revenue (USD Million) By Applications (2018-2022)
Table 19 Europe Property insurance rating solutions Revenue (USD Million) By Country (2018-2022)
Table 20 Europe Property insurance rating solutions Revenue (USD Million) By Type (2018-2022)
Table 21 Europe Property insurance rating solutions Revenue (USD Million) By Applications (2018-2022)
Table 22 Asia Pacific Property insurance rating solutions Revenue (USD Million) By Country (2018-2022)
Table 23 Asia Pacific Property insurance rating solutions Revenue (USD Million) By Type (2018-2022)
Table 24 Asia Pacific Property insurance rating solutions Revenue (USD Million) By Applications (2018-2022)
Table 25 South America Property insurance rating solutions Revenue (USD Million) By Country (2018-2022)
Table 26 South America Property insurance rating solutions Revenue (USD Million) By Type (2018-2022)
Table 27 South America Property insurance rating solutions Revenue (USD Million) By Applications (2018-2022)
Table 28 Middle East and Africa Property insurance rating solutions Revenue (USD Million) By Region (2018-2022)
Table 29 Middle East and Africa Property insurance rating solutions Revenue (USD Million) By Type (2018-2022)
Table 30 Middle East and Africa Property insurance rating solutions Revenue (USD Million) By Applications (2018-2022)
Table 31 Financial Analysis
Table 32 Global Property insurance rating solutions Revenue (USD Million) By Type (2023-2030)
Table 33 Global Property insurance rating solutions Revenue Market Share (%) By Type (2023-2030)
Table 34 Global Property insurance rating solutions Revenue (USD Million) By Applications (2023-2030)
Table 35 Global Property insurance rating solutions Revenue Market Share (%) By Applications (2023-2030)
Table 36 Global Property insurance rating solutions Market Revenue (USD Million), And Revenue (USD Million) By Regions (2023-2030)
Table 37 North America Property insurance rating solutions Revenue (USD)By Country (2023-2030)
Table 38 North America Property insurance rating solutions Revenue (USD Million) By Type (2023-2030)
Table 39 North America Property insurance rating solutions Revenue (USD Million) By Applications (2023-2030)
Table 40 Europe Property insurance rating solutions Revenue (USD Million) By Country (2023-2030)
Table 41 Europe Property insurance rating solutions Revenue (USD Million) By Type (2023-2030)
Table 42 Europe Property insurance rating solutions Revenue (USD Million) By Applications (2023-2030)
Table 43 Asia Pacific Property insurance rating solutions Revenue (USD Million) By Country (2023-2030)
Table 44 Asia Pacific Property insurance rating solutions Revenue (USD Million) By Type (2023-2030)
Table 45 Asia Pacific Property insurance rating solutions Revenue (USD Million) By Applications (2023-2030)
Table 46 South America Property insurance rating solutions Revenue (USD Million) By Country (2023-2030)
Table 47 South America Property insurance rating solutions Revenue (USD Million) By Type (2023-2030)
Table 48 South America Property insurance rating solutions Revenue (USD Million) By Applications (2023-2030)
Table 49 Middle East and Africa Property insurance rating solutions Revenue (USD Million) By Region (2023-2030)
Table 50 Middle East and Africa Property insurance rating solutions Revenue (USD Million) By Region (2023-2030)
Table 51 Middle East and Africa Property insurance rating solutions Revenue (USD Million) By Type (2023-2030)
Table 52 Middle East and Africa Property insurance rating solutions Revenue (USD Million) By Applications (2023-2030)
Table 53 Research Programs/Design for This Report
Table 54 Key Data Information from Secondary Sources
Table 55 Key Data Information from Primary Sources
List of Figures
Figure 1 Market Scope
Figure 2 Porter’s Five Forces
Figure 3 Global Property insurance rating solutions Revenue (USD Million) By Type (2018-2022)
Figure 4 Global Property insurance rating solutions Revenue Market Share (%) By Type (2022)
Figure 5 Global Property insurance rating solutions Revenue (USD Million) By Applications (2018-2022)
Figure 6 Global Property insurance rating solutions Revenue Market Share (%) By Applications (2022)
Figure 7 Global Property insurance rating solutions Market Revenue (USD Million) By Regions (2018-2022)
Figure 8 Global Property insurance rating solutions Market Share (%) By Regions (2022)
Figure 9 North America Property insurance rating solutions Revenue (USD Million) By Country (2018-2022)
Figure 10 North America Property insurance rating solutions Revenue (USD Million) By Type (2018-2022)
Figure 11 North America Property insurance rating solutions Revenue (USD Million) By Applications (2018-2022)
Figure 12 Europe Property insurance rating solutions Revenue (USD Million) By Country (2018-2022)
Figure 13 Europe Property insurance rating solutions Revenue (USD Million) By Type (2018-2022)
Figure 14 Europe Property insurance rating solutions Revenue (USD Million) By Applications (2018-2022)
Figure 15 Asia Pacific Property insurance rating solutions Revenue (USD Million) By Country (2018-2022)
Figure 16 Asia Pacific Property insurance rating solutions Revenue (USD Million) By Type (2018-2022)
Figure 17 Asia Pacific Property insurance rating solutions Revenue (USD Million) By Applications (2018-2022)
Figure 18 South America Property insurance rating solutions Revenue (USD Million) By Country (2018-2022)
Figure 19 South America Property insurance rating solutions Revenue (USD Million) By Type (2018-2022)
Figure 20 South America Property insurance rating solutions Revenue (USD Million) By Applications (2018-2022)
Figure 21 Middle East and Africa Property insurance rating solutions Revenue (USD Million) By Region (2018-2022)
Figure 22 Middle East and Africa Property insurance rating solutions Revenue (USD Million) By Type (2018-2022)
Figure 23 Middle East and Africa Property insurance rating solutions Revenue (USD Million) By Applications (2018-2022)
Figure 24 Global Property insurance rating solutions Revenue (USD Million) By Type (2023-2030)
Figure 25 Global Property insurance rating solutions Revenue Market Share (%) By Type (2030)
Figure 26 Global Property insurance rating solutions Revenue (USD Million) By Applications (2023-2030)
Figure 27 Global Property insurance rating solutions Revenue Market Share (%) By Applications (2030)
Figure 28 Global Property insurance rating solutions Market Revenue (USD Million) By Regions (2023-2030)
Figure 29 North America Property insurance rating solutions Revenue (USD Million) By Country (2023-2030)
Figure 30 North America Property insurance rating solutions Revenue (USD Million) By Type (2023-2030)
Figure 31 North America Property insurance rating solutions Revenue (USD Million) By Applications (2023-2030)
Figure 32 Europe Property insurance rating solutions Revenue (USD Million) By Country (2023-2030)
Figure 33 Europe Property insurance rating solutions Revenue (USD Million) By Type (2023-2030)
Figure 34 Europe Property insurance rating solutions Revenue (USD Million) By Applications (2023-2030)
Figure 35 Asia Pacific Property insurance rating solutions Revenue (USD Million) By Country (2023-2030)
Figure 36 Asia Pacific Property insurance rating solutions Revenue (USD Million) By Type (2023-2030)
Figure 37 Asia Pacific Property insurance rating solutions Revenue (USD Million) By Applications (2023-2030)
Figure 38 South America Property insurance rating solutions Revenue (USD Million) By Country (2023-2030)
Figure 39 South America Property insurance rating solutions Revenue (USD Million) By Type (2023-2030)
Figure 40 South America Property insurance rating solutions Revenue (USD Million) By Applications (2023-2030)
Figure 41 Middle East and Africa Property insurance rating solutions Revenue (USD Million) By Region (2023-2030)
Figure 42 Middle East and Africa Property insurance rating solutions Revenue (USD Million) By Region (2023-2030)
Figure 43 Middle East and Africa Property insurance rating solutions Revenue (USD Million) By Type (2023-2030)
Figure 44 Middle East and Africa Property insurance rating solutions Revenue (USD Million) By Applications (2023-2030)
Figure 45 Bottom-Up and Top-Down Approaches For This Report
Figure 46 Data Triangulation
