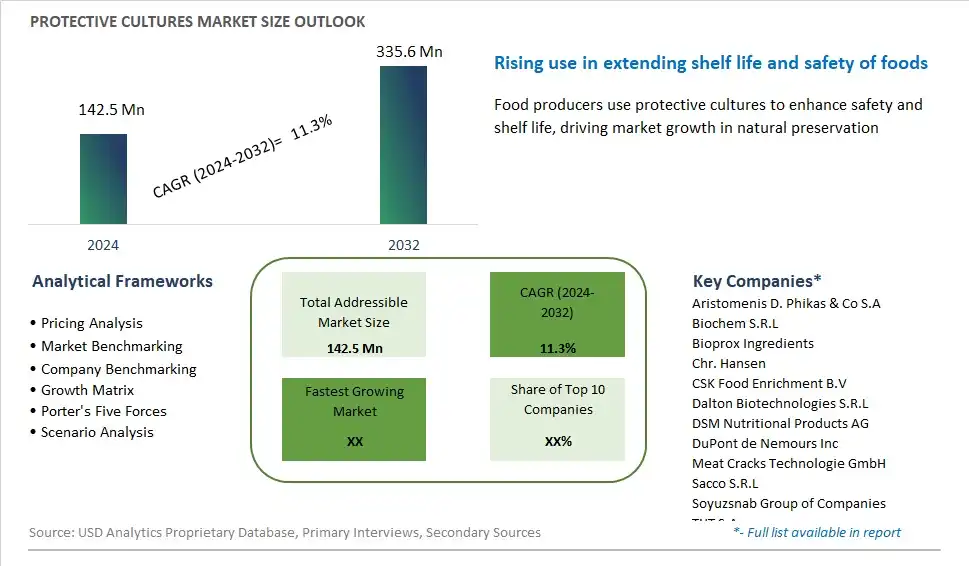
Global Protective Cultures Market Size is valued at $142.5 Million in 2024 and is forecast to register a growth rate (CAGR) of 11.3% to reach $335.6 Million by 2032.
The global Protective Cultures Market Comprehensive Study analyzes and forecasts the market size across 6 regions and 24 countries for diverse segments -By Form (Freeze-Dried, Frozen), By Microorganism (Yeasts, Molds, Bacteria), By Application (Dairy Products, Meat, Poultry and Seafood Products, Ready to Eat Food Products, Others)
An Introduction to Protective Cultures Market
Protective cultures, also known as bio-protective cultures or biopreservatives, are beneficial microorganisms added to food products to inhibit the growth of spoilage and pathogenic bacteria, extending shelf life and enhancing safety in 2024. These cultures include lactic acid bacteria such as Lactobacillus and Bifidobacterium species, which produce antimicrobial compounds such as organic acids, hydrogen peroxide, and bacteriocins that inhibit the growth of harmful bacteria such as Listeria and Salmonella. Protective cultures are commonly used in fermented foods such as yogurt, cheese, and sauerkraut, as well as in meat, poultry, and seafood products, where they improve microbiological stability and safety without the need for chemical preservatives. With increasing consumer demand for clean label and natural food ingredients, the market for protective cultures is growing, driven by innovations in strain selection, fermentation technology, and application methods that enable manufacturers to produce safe, high-quality food products while meeting regulatory requirements and consumer preferences for natural, minimally processed foods.
Protective Cultures Competitive Landscape
The market report analyses the leading companies in the industry including Aristomenis D. Phikas & Co S.A, Biochem S.R.L, Bioprox Ingredients, Chr. Hansen, CSK Food Enrichment B.V, Dalton Biotechnologies S.R.L, DSM Nutritional Products AG, DuPont de Nemours Inc, Meat Cracks Technologie GmbH, Sacco S.R.L, Soyuzsnab Group of Companies, THT S.A, and Others.
Protective Cultures Market Dynamics
Protective Cultures Market Trend: Rising Demand for Natural and Clean-Label Food Preservation Solutions
One prominent market trend in protective cultures is the rising demand for natural and clean-label food preservation solutions. As consumers become increasingly conscious of the ingredients in their food and seek products with fewer additives and preservatives, there's a growing interest in protective cultures as an alternative to traditional chemical preservatives. Protective cultures, consisting of beneficial bacteria and yeasts, offer a natural way to extend the shelf life of food products by inhibiting the growth of spoilage microorganisms and pathogens. This trend is driven by the desire for clean-label foods that are perceived as healthier, safer, and more environmentally friendly. Manufacturers are responding to this trend by incorporating protective cultures into a wide range of food and beverage products, including dairy, meat, bakery, and fermented foods, to meet consumer demand for natural and minimally processed options.
Market Driver: Focus on Food Safety and Shelf Life Extension
A key driver propelling the market for protective cultures is the focus on food safety and shelf life extension in the food industry. With increasing globalization of food supply chains, changing consumer preferences, and stringent regulations governing food safety and quality, there's a growing need for effective and sustainable methods to prevent microbial spoilage and ensure product safety throughout the supply chain. Protective cultures offer a proactive approach to food preservation by inhibiting the growth of harmful bacteria, molds, and yeasts, thereby reducing the risk of foodborne illness and product recalls. Additionally, protective cultures help extend the shelf life of perishable foods, reducing food waste and optimizing inventory management for manufacturers and retailers. As food safety remains a top priority for consumers and regulators alike, the demand for protective cultures is expected to continue to grow, driven by the need for safe, high-quality, and longer-lasting food products.
Market Opportunity: Expansion into New Food Categories and Emerging Markets
An opportunity within the protective cultures market lies in the expansion into new food categories and emerging markets to address evolving consumer preferences and market demands. While protective cultures have traditionally been used in dairy products such as yogurt, cheese, and fermented milk, there's potential to explore new applications in non-dairy products, including plant-based alternatives, fresh produce, and ready-to-eat meals. As plant-based diets gain popularity and consumers seek healthier and more sustainable food options, protective cultures can play a vital role in preserving the freshness, flavor, and nutritional quality of plant-based foods. Furthermore, there's an opportunity to expand into emerging markets with growing urbanization, changing dietary habits, and increasing disposable incomes. By leveraging innovative formulations, packaging solutions, and distribution channels, manufacturers can introduce protective culture-based products to new consumer segments and geographic regions, driving market growth and penetration in the dynamic global food industry.
Protective Cultures Market Share Analysis: Freeze-Dried held the dominant market share in 2024
The freeze-dried form dominates the protective cultures market due to its advantages in terms of shelf stability, ease of storage, and convenience in transportation and handling. Freeze-drying, also known as lyophilization, involves removing moisture from the protective cultures under low temperature and pressure, resulting in a dry and stable product that retains its viability and functionality for extended periods. This form of preservation ensures that the protective cultures remain active and effective, even under varying storage conditions, making freeze-dried cultures a preferred choice for manufacturers in the food and beverage industry. Additionally, freeze-dried protective cultures offer versatility in application, as they can be easily rehydrated and incorporated into a wide range of food products such as dairy, meat, and fermented beverages. The widespread adoption of freeze-dried protective cultures by food producers to extend product shelf life, improve safety, and enhance organoleptic properties solidifies the form's dominance in the protective cultures market.
Protective Cultures Market Share Analysis: Yeasts market is poised to register the fastest growth rae over the forecast period to 2032
The yeasts segment is experiencing rapid growth in the protective cultures market, driven by the increasing demand for natural and clean label food preservation solutions. Yeasts, particularly strains such as Saccharomyces cerevisiae and Kluyveromyces lactis, offer versatile antimicrobial properties and the ability to produce metabolites such as organic acids and antimicrobial peptides, which inhibit the growth of spoilage and pathogenic microorganisms in food products. Yeast-based protective cultures are gaining popularity among food manufacturers seeking alternatives to synthetic preservatives and chemical additives, aligning with consumer preferences for clean label and natural ingredients. Additionally, yeast-based protective cultures contribute to the flavor development and fermentation process in fermented foods, enhancing their sensory characteristics and nutritional value. The versatility and efficacy of yeasts in food preservation, coupled with growing consumer demand for clean label products, are driving the rapid expansion of the yeasts segment in the protective cultures market.
Protective Cultures Market Share Analysis: Dairy Products held the dominant market share in 2024
The dairy products segment holds the largest share in the protective cultures market due to the widespread use of protective cultures in dairy fermentation processes and the high consumption of dairy products globally. Protective cultures play a crucial role in dairy fermentation, where they contribute to the production of yogurt, cheese, and fermented milk products by inhibiting spoilage microorganisms and enhancing product quality, safety, and shelf life. Additionally, with the increasing demand for natural and clean label dairy products, protective cultures offer an effective alternative to synthetic preservatives, aligning with consumer preferences for healthier and more natural food options. The versatility of protective cultures in dairy applications, coupled with the growing trend of probiotic-enriched dairy products, further drives the dominance of the dairy products segment in the protective cultures market.
Protective Cultures Market Segmentation
By Form
Freeze-Dried
Frozen
By Microorganism
Yeasts
Molds
Bacteria
By Application
Dairy Products
Meat
Poultry and Seafood Products
Ready to Eat Food Products
Others
Countries Analyzed
North America (US, Canada, Mexico)
Europe (Germany, UK, France, Spain, Italy, Russia, Rest of Europe)
Asia Pacific (China, India, Japan, South Korea, Australia, South East Asia, Rest of Asia)
South America (Brazil, Argentina, Rest of South America)
Middle East and Africa (Saudi Arabia, UAE, Rest of Middle East, South Africa, Egypt, Rest of Africa)
Protective Cultures Companies Profiled in the Study
Aristomenis D. Phikas & Co S.A
Biochem S.R.L
Bioprox Ingredients
Chr. Hansen
CSK Food Enrichment B.V
Dalton Biotechnologies S.R.L
DSM Nutritional Products AG
DuPont de Nemours Inc
Meat Cracks Technologie GmbH
Sacco S.R.L
Soyuzsnab Group of Companies
THT S.A
*- List Not Exhaustive
Chapter 1. TABLE OF CONTENTS
Chapter 2. Introduction to Protective Cultures Market
2.1. Market Overview
2.2. Key Statistics and Report Highlights
2.3. Scope of the Comprehensive Study
2.3.1. Market Definition
2.3.2 Countries and Regions Covered
2.3.3 Research Objective
2.3.4 Units, Currency, and Conversions
2.3.5 Industry Value Chain
2.4. Key Market Segments
2.5. Key Companies
2.6. Study Period
Chapter 3. Strategic Analysis Review
3.1. Protective Cultures Pricing Analysis and Forecast
3.2. Porter’s Five Forces
3.3. Market Ecosystem
3.4. SWOT Analysis
3.5. Regulatory Scenario
3.3. Effects of Inflation, Russia-Ukraine War, moderating economic growth, and other macroeconomic factors
Chapter 4. Competitive Landscape
4.1. Market Share Analysis
4.1.1. Global Protective Cultures Market Share by Company, 2023
4.1.2. Product Offerings of Leading Protective Cultures Companies
4.2. Market Entropy
4.2.1. New Product Launches in the Industry
4.2.2. Mergers, Acquisitions, Joint ventures, and Partnerships
4.3. Key Strategies and Best Practices
Chapter 5. Global Market Projections: Best, Reference, and Low Case Scenarios
5.1. Growth Analysis- Case Scenario Definitions
5.2. Low Growth Case Scenario Forecasts
5.3. Reference Growth Case Scenario Forecasts
5.4. High Growth Case Scenario Forecasts
Chapter 6. Market Dynamics
6.1. Protective Cultures Market Drivers
6.2. Protective Cultures Market Challenges
6.6. Protective Cultures Market Opportunities
6.4. Protective Cultures Market Trends
Chapter 7. Global Protective Cultures Market Outlook Trends
7.1. Global Protective Cultures Revenue (USD Million) and CAGR (%) by Type (2021-2032)
7.2. Global Protective Cultures Revenue (USD Million) and CAGR (%) by Application (2021-2032)
7.3. Global Protective Cultures Revenue (USD Million) and CAGR (%) by Product (2021-2032)
By Form
Freeze-Dried
Frozen
By Microorganism
Yeasts
Molds
Bacteria
By Application
Dairy Products
Meat
Poultry and Seafood Products
Ready to Eat Food Products
Others
Chapter 8. Global Protective Cultures Regional Analysis and Outlook
8.1. Global Protective Cultures Revenue (USD Million) By Regions (2021- 2032)
8.2. North America Protective Cultures Revenue (USD Million) by Country (2021-2032)
8.2.1. United States Protective Cultures Regional Analysis and Outlook
8.2.2. Canada Protective Cultures Regional Analysis and Outlook
8.2.3. Mexico Protective Cultures Regional Analysis and Outlook
8.3. Europe Protective Cultures Revenue (USD Million), by Country (2021-2032)
8.3.1. Germany Protective Cultures Regional Analysis and Outlook
8.3.2. France Protective Cultures Regional Analysis and Outlook
8.3.3. United Kingdom Protective Cultures Regional Analysis and Outlook
8.3.4. Spain Protective Cultures Regional Analysis and Outlook
8.3.5. Italy Protective Cultures Regional Analysis and Outlook
8.3.6. Russia Protective Cultures Regional Analysis and Outlook
8.3.7. Rest of Europe Protective Cultures Regional Analysis and Outlook
8.4. Asia Pacific Protective Cultures Revenue (USD Million) by Country (2021-2032)
8.4.1. China Protective Cultures Regional Analysis and Outlook
8.4.2. Japan Protective Cultures Regional Analysis and Outlook
8.4.3. India Protective Cultures Regional Analysis and Outlook
8.4.4. South Korea Protective Cultures Regional Analysis and Outlook
8.4.5. Australia Protective Cultures Regional Analysis and Outlook
8.4.6. South East Asia Protective Cultures Regional Analysis and Outlook
8.4.7. Rest of Asia Pacific Protective Cultures Regional Analysis and Outlook
8.5. South America Protective Cultures Revenue (USD Million), by Country (2021-2032)
8.5.1. Brazil Protective Cultures Regional Analysis and Outlook
8.5.2. Argentina Protective Cultures Regional Analysis and Outlook
8.5.3. Rest of South America Protective Cultures Regional Analysis and Outlook
8.6. Middle East and Africa Protective Cultures Revenue (USD Million) by Country (2021-2032)
8.6.1. Middle East Protective Cultures Regional Analysis and Outlook
8.6.2. Africa Protective Cultures Regional Analysis and Outlook
Chapter 9. North America Protective Cultures Analysis and Outlook
9.1. North America Protective Cultures Revenue (USD Million) by Segments (2021-2032)
9.1.1. North America Protective Cultures Revenue (USD Million) by Type (2021-2032)
9.1.2. North America Protective Cultures Revenue (USD Million) by Application (2021-2032)
9.1.3. North America Protective Cultures Revenue (USD Million) by Product (2021-2032)
By Form
Freeze-Dried
Frozen
By Microorganism
Yeasts
Molds
Bacteria
By Application
Dairy Products
Meat
Poultry and Seafood Products
Ready to Eat Food Products
Others
Chapter 10. Europe Protective Cultures Analysis and Outlook
10.1. Europe Protective Cultures Revenue (USD Million), by Segments (USD Million) (2021-2032)
10.1.1. Europe Protective Cultures Revenue (USD Million) by Type (2021-2032)
10.1.2. Europe Protective Cultures Revenue (USD Million) by Application (2021-2032)
10.1.3. Europe Protective Cultures Revenue (USD Million) by Product (2021-2032)
By Form
Freeze-Dried
Frozen
By Microorganism
Yeasts
Molds
Bacteria
By Application
Dairy Products
Meat
Poultry and Seafood Products
Ready to Eat Food Products
Others
Chapter 11. Asia Pacific Protective Cultures Analysis and Outlook
11.1. Asia Pacific Protective Cultures Revenue (USD Million), and Revenue (USD Million) by Segments (2021-2032)
11.1.1. Asia Pacific Protective Cultures Revenue (USD Million) by Type (2021-2032)
11.1.2. Asia Pacific Protective Cultures Revenue (USD Million) by Application (2021-2032)
11.1.3. Asia Pacific Protective Cultures Revenue (USD Million) by Product (2021-2032)
By Form
Freeze-Dried
Frozen
By Microorganism
Yeasts
Molds
Bacteria
By Application
Dairy Products
Meat
Poultry and Seafood Products
Ready to Eat Food Products
Others
Chapter 12. South America Protective Cultures Analysis and Outlook
12.1. South America Protective Cultures Revenue (USD Million), by Segments (2021-2032)
12.1.1. South America Protective Cultures Revenue (USD Million) by Type (2021-2032)
12.1.2. South America Protective Cultures Revenue (USD Million) by Application (2021-2032)
12.1.3. South America Protective Cultures Revenue (USD Million) by Product (2021-2032)
By Form
Freeze-Dried
Frozen
By Microorganism
Yeasts
Molds
Bacteria
By Application
Dairy Products
Meat
Poultry and Seafood Products
Ready to Eat Food Products
Others
Chapter 13. Middle East and Africa Protective Cultures Analysis and Outlook
13.1. Middle East and Africa Protective Cultures Revenue (USD Million), by Segments (2021-2032)
13.1.1. Middle East and Africa Protective Cultures Revenue (USD Million) by Type (2021-2032)
13.1.2. Middle East and Africa Protective Cultures Revenue (USD Million) by Application (2021-2032)
13.1.3. Middle East and Africa Protective Cultures Revenue (USD Million) by Product (2021-2032)
By Form
Freeze-Dried
Frozen
By Microorganism
Yeasts
Molds
Bacteria
By Application
Dairy Products
Meat
Poultry and Seafood Products
Ready to Eat Food Products
Others
Chapter 14. Protective Cultures Company Profiles
14.1 Business Overview
14.2 Product Profiles
14.3 SWOT Profiles
14.5 Recent Developments
14.6 Financial Profile
List of Companies
Aristomenis D. Phikas & Co S.A
Biochem S.R.L
Bioprox Ingredients
Chr. Hansen
CSK Food Enrichment B.V
Dalton Biotechnologies S.R.L
DSM Nutritional Products AG
DuPont de Nemours Inc
Meat Cracks Technologie GmbH
Sacco S.R.L
Soyuzsnab Group of Companies
THT S.A
15. Methodology and Data Sources
15.1 Customization Offerings
15.2 Subscription Services
15.3 Related Reports
15.4 Publisher Expertise
LIST OF TABLES
Table 1 Market Segmentation Analysis
Table 2 Global Protective Cultures Market Share of Leading Companies, 2023
Table 3 Product Offerings of Leading Companies
Table 4 Low Growth Scenario Forecasts
Table 5 Reference Case Growth Scenario
Table 6 High Growth Case Scenario
Table 7 Global Protective Cultures Revenue (USD Million) And CAGR (%) By Type (2021-2032)
Table 8 Global Protective Cultures Revenue (USD Million) And CAGR (%) By Application (2021-2032)
Table 9 Global Protective Cultures Revenue (USD Million) And CAGR (%) By Product (2021-2032)
Table 10 Global Protective Cultures Market Revenue (USD Million) By Regions (2021-2032)
Table 11 Global Protective Cultures Market Share (%) By Regions (2021-2032)
Table 12 North America Protective Cultures Revenue (USD Million) By Country (2021-2032)
Table 13 Europe Protective Cultures Revenue (USD Million) By Country (2021-2032)
Table 14 Asia Pacific Protective Cultures Revenue (USD Million) By Country (2021-2032)
Table 15 South America Protective Cultures Revenue (USD Million) By Country (2021-2032)
Table 16 Middle East and Africa Protective Cultures Revenue (USD Million) By Region (2021-2032)
Table 17 North America Protective Cultures Revenue (USD Million) By Type (2021-2032)
Table 18 North America Protective Cultures Revenue (USD Million) By Application (2021-2032)
Table 19 North America Protective Cultures Revenue (USD Million) By Product (2021-2032)
Table 20 Europe Protective Cultures Revenue (USD Million) By Type (2021-2032)
Table 21 Europe Protective Cultures Revenue (USD Million) By Application (2021-2032)
Table 22 Europe Protective Cultures Revenue (USD Million) By Product (2021-2032)
Table 23 Asia Pacific Protective Cultures Revenue (USD Million) By Type (2021-2032)
Table 24 Asia Pacific Protective Cultures Revenue (USD Million) By Application (2021-2032)
Table 25 Asia Pacific Protective Cultures Revenue (USD Million) By Product (2021-2032)
Table 26 South America Protective Cultures Revenue (USD Million) By Type (2021-2032)
Table 27 South America Protective Cultures Revenue (USD Million) By Application (2021-2032)
Table 28 South America Protective Cultures Revenue (USD Million) By Product (2021-2032)
Table 29 Middle East and Africa Protective Cultures Revenue (USD Million) By Type (2021-2032)
Table 30 Middle East and Africa Protective Cultures Revenue (USD Million) By Application (2021-2032)
Table 31 Middle East and Africa Protective Cultures Revenue (USD Million) By Product (2021-2032)
LIST OF FIGURES
Figure 1. Market Scope
Figure 2. Pricing Forecasts Per Unit, 2023- 2032
Figure 3. Porter’s Five Forces
Figure 4. Global Protective Cultures Market Revenue (USD Million) By Regions (2021-2032)
Figure 5. Global Protective Cultures Market Share (%) By Regions (2023)
Figure 6. North America Protective Cultures Revenue (USD Million) By Country (2021-2032)
Figure 7. United States Protective Cultures Revenue (USD Million) By Country (2021-2032)
Figure 8. Canada Protective Cultures Revenue (USD Million) By Country (2021-2032)
Figure 9. Mexico Protective Cultures Revenue (USD Million) By Country (2021-2032)
Figure 10. Europe Protective Cultures Revenue (USD Million) By Country (2021-2032)
Figure 11. Germany Protective Cultures Revenue (USD Million) By Country (2021-2032)
Figure 12. France Protective Cultures Revenue (USD Million) By Country (2021-2032)
Figure 13. United Kingdom Protective Cultures Revenue (USD Million) By Country (2021-2032)
Figure 14. Spain Protective Cultures Revenue (USD Million) By Country (2021-2032)
Figure 15. Italy Protective Cultures Revenue (USD Million) By Country (2021-2032)
Figure 16. Russia Protective Cultures Revenue (USD Million) By Country (2021-2032)
Figure 17. Rest of Europe Protective Cultures Revenue (USD Million) By Country (2021-2032)
Figure 11. Asia Pacific Protective Cultures Revenue (USD Million) By Country (2021-2032)
Figure 12. China Protective Cultures Revenue (USD Million) By Country (2021-2032)
Figure 13. Japan Protective Cultures Revenue (USD Million) By Country (2021-2032)
Figure 14. India Protective Cultures Revenue (USD Million) By Country (2021-2032)
Figure 15. South Korea Protective Cultures Revenue (USD Million) By Country (2021-2032)
Figure 16. Australia Protective Cultures Revenue (USD Million) By Country (2021-2032)
Figure 17. South East Asia Protective Cultures Revenue (USD Million) By Country (2021-2032)
Figure 18. South America Protective Cultures Revenue (USD Million) By Country (2021-2032)
Figure 19. Brazil Protective Cultures Revenue (USD Million) By Country (2021-2032)
Figure 20. Argentina Protective Cultures Revenue (USD Million) By Country (2021-2032)
Figure 21. Rest of Asia Pacific Protective Cultures Revenue (USD Million) By Country (2021-2032)
Figure 22. Middle East and Africa Protective Cultures Revenue (USD Million) By Region (2021-2032)
Figure 23. Saudi Arabia Protective Cultures Revenue (USD Million) By Region (2021-2032)
Figure 24. The UAE Protective Cultures Revenue (USD Million) By Region (2021-2032)
Figure 25. Rest of Middle East Protective Cultures Revenue (USD Million) By Region (2021-2032)
Figure 26. South Africa Protective Cultures Revenue (USD Million) By Region (2021-2032)
Figure 27. Africa Protective Cultures Revenue (USD Million) By Region (2021-2032)
Figure 28. North America Protective Cultures Revenue (USD Million) By Type (2021-2032)
Figure 29. North America Protective Cultures Revenue (USD Million) By Application (2021-2032)
Figure 30. North America Protective Cultures Revenue (USD Million) By Product (2021-2032)
Figure 31. Europe Protective Cultures Revenue (USD Million) By Type (2021-2032)
Figure 32. Europe Protective Cultures Revenue (USD Million) By Application (2021-2032)
Figure 33. Europe Protective Cultures Revenue (USD Million) By Product (2021-2032)
Figure 34. Asia Pacific Protective Cultures Revenue (USD Million) By Type (2021-2032)
Figure 35. Asia Pacific Protective Cultures Revenue (USD Million) By Application (2021-2032)
Figure 36. Asia Pacific Protective Cultures Revenue (USD Million) By Product (2021-2032)
Figure 37. South America Protective Cultures Revenue (USD Million) By Type (2021-2032)
Figure 38. South America Protective Cultures Revenue (USD Million) By Application (2021-2032)
Figure 39. South America Protective Cultures Revenue (USD Million) By Product (2021-2032)
Figure 40. Middle East and Africa Protective Cultures Revenue (USD Million) By Type (2021-2032)
Figure 41. Middle East and Africa Protective Cultures Revenue (USD Million) By Application (2021-2032)
Figure 42. Middle East and Africa Protective Cultures Revenue (USD Million) By Product (2021-2032)
By Form
Freeze-Dried
Frozen
By Microorganism
Yeasts
Molds
Bacteria
By Application
Dairy Products
Meat
Poultry and Seafood Products
Ready to Eat Food Products
Others
Countries Analyzed
North America (US, Canada, Mexico)
Europe (Germany, UK, France, Spain, Italy, Russia, Rest of Europe)
Asia Pacific (China, India, Japan, South Korea, Australia, South East Asia, Rest of Asia)
South America (Brazil, Argentina, Rest of South America)
Middle East and Africa (Saudi Arabia, UAE, Rest of Middle East, South Africa, Egypt, Rest of Africa)
