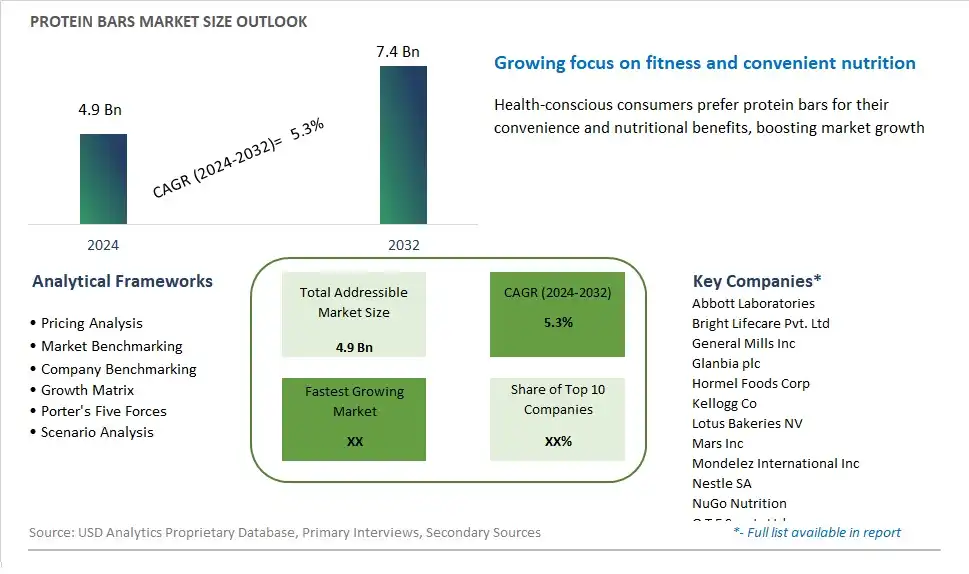
Global Protein Bars Market Size is valued at $4.9 Billion in 2025 and is forecast to register a growth rate (CAGR) of 5.3% to reach $7.4 Billion by 2034.
The global Protein Bars Market Comprehensive Study analyzes and forecasts the market size across 6 regions and 24 countries for diverse segments -By Product (Medium protein bar, Low protein bar, High protein bar), By Distribution Channel (Supermarkets/Hypermarkets, Convenience stores, Drug stores, Others)
An Introduction to Protein Bars Market
In 2025, the market for protein bars continues to grow as consumers prioritize convenient and nutritious on-the-go snack options that support their active lifestyles and dietary goals. Protein bars are formulated with a blend of protein sources, such as whey, soy, pea, and nuts, along with carbohydrates, fats, fiber, and vitamins, to provide sustained energy, muscle recovery, and satiety between meals. With increasing demand for protein-rich snacks, protein bars have evolved to cater to diverse dietary preferences and health needs, offering options such as vegan, gluten-free, low-sugar, and keto-friendly formulations. Moreover, as consumers seek transparency and clean label products, protein bar manufacturers are focusing on natural ingredients, minimal processing, and functional additives to meet the demands of health-conscious consumers.
Protein Bars Competitive Landscape
The market report analyses the leading companies in the industry including Abbott Laboratories, Bright Lifecare Pvt. Ltd, General Mills Inc, Glanbia plc, Hormel Foods Corp, Kellogg Co, Lotus Bakeries NV, Mars Inc, Mondelez International Inc, Nestle SA, NuGo Nutrition, O T E Sports Ltd, PepsiCo Inc, Post Holdings Inc, Premier Nutrition Co. LLC, and Others.
Protein Bars Market Dynamics
Protein Bars Market Trend: Increasing Popularity of Plant-Based Protein Bars
One of the most prominent trends in the protein bars market is the increasing popularity of plant-based protein bars. As more consumers adopt vegan, vegetarian, and flexitarian diets, there is a growing demand for protein sources that do not come from animals. This trend is driven by health, ethical, and environmental concerns associated with animal-based products. Plant-based protein bars, made from ingredients like soy, pea, hemp, and rice proteins, cater to the needs of this expanding consumer base. Additionally, advancements in food technology have improved the taste and texture of plant-based protein bars, making them more appealing to a wider audience. The trend is also supported by the growing availability of these products in mainstream retail channels and their endorsement by fitness influencers and celebrities. As consumers seek clean, sustainable, and ethical protein options, plant-based protein bars are set to dominate the market landscape.
Market Driver: Rising Health Consciousness and Active Lifestyles
A significant driver in the protein bars market is the rising health consciousness and the adoption of active lifestyles among consumers. People are increasingly aware of the importance of a balanced diet and regular exercise in maintaining overall health and well-being. Protein bars offer a convenient and effective way to boost protein intake, which is essential for muscle repair, weight management, and energy levels. This driver is particularly strong among fitness enthusiasts, athletes, and busy professionals who need quick and nutritious on-the-go snacks. Moreover, the COVID-19 pandemic has heightened awareness about health and immunity, prompting more consumers to seek out functional foods that support their health goals. The growing trend of personalized nutrition, where individuals tailor their diets to their specific health needs and fitness objectives, also contributes to the increased demand for protein bars that offer targeted health benefits, such as added vitamins, minerals, and probiotics.
Market Opportunity: Innovation in Flavor and Functional Ingredients
The protein bars market presents significant opportunities for innovation in flavor and functional ingredients. As the market becomes increasingly competitive, brands can differentiate themselves by offering unique and exciting flavors that cater to diverse consumer preferences. From indulgent dessert-inspired flavors to exotic fruit and nut combinations, the possibilities for flavor innovation are vast. Additionally, there is a growing demand for protein bars that offer additional functional benefits beyond basic nutrition. This includes bars fortified with superfoods, adaptogens, prebiotics, and probiotics, as well as those designed for specific dietary needs such as keto, paleo, and gluten-free. By leveraging consumer trends towards holistic wellness and targeted nutrition, companies can create products that not only meet the protein needs of consumers but also enhance their overall health and wellness. Investing in research and development to identify emerging ingredient trends and consumer preferences can help brands stay ahead of the curve and capture a larger share of the growing protein bars market.
Protein Bars Market Share Analysis: High Protein Bar held the dominant market share in 2025
In the protein bars market segmented by product, the High Protein Bar category is the largest segment, driven by the growing demand for convenient and nutritious snacks among health-conscious consumers. High protein bars are favored for their ability to provide a substantial protein boost, making them an ideal on-the-go option for individuals seeking to meet their daily protein intake requirements. With protein being a crucial nutrient for muscle repair, recovery, and overall health, high protein bars appeal to fitness enthusiasts, athletes, and individuals following protein-rich diets. Additionally, high protein bars often contain lower levels of sugar and carbohydrates compared to their counterparts, appealing to consumers looking to maintain or lose weight while supporting their fitness goals. Further, the versatility of high protein bars makes them suitable for various occasions, including pre- or post-workout snacks, meal replacements, or convenient protein boosts throughout the day. As a result, the high protein bar segment holds a significant market share within the protein bars market, driven by its nutritional benefits, convenience, and versatility, catering to the evolving needs and preferences of health-conscious consumers.
Protein Bars Market Share Analysis: Convenience Stores market is poised to register the fastest growth rae over the forecast period to 2034
In the protein bars market segmented by distribution channels, Convenience Stores emerge as the fastest-growing segment, propelled by changing consumer lifestyles and the increasing demand for on-the-go, healthy snack options. Convenience stores offer a quick and accessible shopping experience, catering to consumers' busy schedules and the need for convenient food choices. The rising health consciousness among consumers, coupled with a growing interest in fitness and nutrition, has led to a surge in demand for protein bars as a convenient and nutritious snack option. Further, convenience stores are strategically located in high-traffic areas such as urban centers, office complexes, and transportation hubs, providing easy accessibility to a diverse consumer base. Additionally, convenience stores often carry a curated selection of protein bars, including popular brands and flavors, catering to different dietary preferences and taste profiles. Furthermore, promotional strategies, such as attractive display placements and bundle offers, enhance the visibility and appeal of protein bars within convenience stores, driving impulse purchases and sales growth. Overall, the combination of convenience, accessibility, and increasing consumer demand positions convenience stores as the fastest-growing distribution channel in the protein bars market.
Protein Bars Market Segmentation
By Product
Medium protein bar
Low protein bar
High protein bar
By Distribution Channel
Supermarkets/Hypermarkets
Convenience stores
Drug stores
Others
Countries Analyzed
North America (US, Canada, Mexico)
Europe (Germany, UK, France, Spain, Italy, Russia, Rest of Europe)
Asia Pacific (China, India, Japan, South Korea, Australia, South East Asia, Rest of Asia)
South America (Brazil, Argentina, Rest of South America)
Middle East and Africa (Saudi Arabia, UAE, Rest of Middle East, South Africa, Egypt, Rest of Africa)
Protein Bars Companies Profiled in the Study
Abbott Laboratories
Bright Lifecare Pvt. Ltd
General Mills Inc
Glanbia plc
Hormel Foods Corp
Kellogg Co
Lotus Bakeries NV
Mars Inc
Mondelez International Inc
Nestle SA
NuGo Nutrition
O T E Sports Ltd
PepsiCo Inc
Post Holdings Inc
Premier Nutrition Co. LLC
*- List Not Exhaustive
Chapter 1. TABLE OF CONTENTS
Chapter 2. Introduction to Protein Bars Market
2.1. Market Overview
2.2. Key Statistics and Report Highlights
2.3. Scope of the Comprehensive Study
2.3.1. Market Definition
2.3.2 Countries and Regions Covered
2.3.3 Research Objective
2.3.4 Units, Currency, and Conversions
2.3.5 Industry Value Chain
2.4. Key Market Segments
2.5. Key Companies
2.6. Study Period
Chapter 3. Strategic Analysis Review
3.1. Protein Bars Pricing Analysis and Forecast
3.2. Porter’s Five Forces
3.3. Market Ecosystem
3.4. SWOT Analysis
3.5. Regulatory Scenario
3.3. Effects of Inflation, Russia-Ukraine War, moderating economic growth, and other macroeconomic factors
Chapter 4. Competitive Landscape
4.1. Market Share Analysis
4.1.1. Global Protein Bars Market Share by Company, 2025
4.1.2. Product Offerings of Leading Protein Bars Companies
4.2. Market Entropy
4.2.1. New Product Launches in the Industry
4.2.2. Mergers, Acquisitions, Joint ventures, and Partnerships
4.3. Key Strategies and Best Practices
Chapter 5. Global Market Projections: Best, Reference, and Low Case Scenarios
5.1. Growth Analysis- Case Scenario Definitions
5.2. Low Growth Case Scenario Forecasts
5.3. Reference Growth Case Scenario Forecasts
5.4. High Growth Case Scenario Forecasts
Chapter 6. Market Dynamics
6.1. Protein Bars Market Drivers
6.2. Protein Bars Market Challenges
6.6. Protein Bars Market Opportunities
6.4. Protein Bars Market Trends
Chapter 7. Global Protein Bars Market Outlook Trends
7.1. Global Protein Bars Revenue (USD Million) and CAGR (%) by Type (2021-2034)
7.2. Global Protein Bars Revenue (USD Million) and CAGR (%) by Application (2021-2034)
7.3. Global Protein Bars Revenue (USD Million) and CAGR (%) by Product (2021-2034)
By Product
Medium protein bar
Low protein bar
High protein bar
By Distribution Channel
Supermarkets/Hypermarkets
Convenience stores
Drug stores
Others
Chapter 8. Global Protein Bars Regional Analysis and Outlook
8.1. Global Protein Bars Revenue (USD Million) By Regions (2021- 2034)
8.2. North America Protein Bars Revenue (USD Million) by Country (2021-2034)
8.2.1. United States Protein Bars Regional Analysis and Outlook
8.2.2. Canada Protein Bars Regional Analysis and Outlook
8.2.3. Mexico Protein Bars Regional Analysis and Outlook
8.3. Europe Protein Bars Revenue (USD Million), by Country (2021-2034)
8.3.1. Germany Protein Bars Regional Analysis and Outlook
8.3.2. France Protein Bars Regional Analysis and Outlook
8.3.3. United Kingdom Protein Bars Regional Analysis and Outlook
8.3.4. Spain Protein Bars Regional Analysis and Outlook
8.3.5. Italy Protein Bars Regional Analysis and Outlook
8.3.6. Russia Protein Bars Regional Analysis and Outlook
8.3.7. Rest of Europe Protein Bars Regional Analysis and Outlook
8.4. Asia Pacific Protein Bars Revenue (USD Million) by Country (2021-2034)
8.4.1. China Protein Bars Regional Analysis and Outlook
8.4.2. Japan Protein Bars Regional Analysis and Outlook
8.4.3. India Protein Bars Regional Analysis and Outlook
8.4.4. South Korea Protein Bars Regional Analysis and Outlook
8.4.5. Australia Protein Bars Regional Analysis and Outlook
8.4.6. South East Asia Protein Bars Regional Analysis and Outlook
8.4.7. Rest of Asia Pacific Protein Bars Regional Analysis and Outlook
8.5. South America Protein Bars Revenue (USD Million), by Country (2021-2034)
8.5.1. Brazil Protein Bars Regional Analysis and Outlook
8.5.2. Argentina Protein Bars Regional Analysis and Outlook
8.5.3. Rest of South America Protein Bars Regional Analysis and Outlook
8.6. Middle East and Africa Protein Bars Revenue (USD Million) by Country (2021-2034)
8.6.1. Middle East Protein Bars Regional Analysis and Outlook
8.6.2. Africa Protein Bars Regional Analysis and Outlook
Chapter 9. North America Protein Bars Analysis and Outlook
9.1. North America Protein Bars Revenue (USD Million) by Segments (2021-2034)
9.1.1. North America Protein Bars Revenue (USD Million) by Type (2021-2034)
9.1.2. North America Protein Bars Revenue (USD Million) by Application (2021-2034)
9.1.3. North America Protein Bars Revenue (USD Million) by Product (2021-2034)
By Product
Medium protein bar
Low protein bar
High protein bar
By Distribution Channel
Supermarkets/Hypermarkets
Convenience stores
Drug stores
Others
Chapter 10. Europe Protein Bars Analysis and Outlook
10.1. Europe Protein Bars Revenue (USD Million), by Segments (USD Million) (2021-2034)
10.1.1. Europe Protein Bars Revenue (USD Million) by Type (2021-2034)
10.1.2. Europe Protein Bars Revenue (USD Million) by Application (2021-2034)
10.1.3. Europe Protein Bars Revenue (USD Million) by Product (2021-2034)
By Product
Medium protein bar
Low protein bar
High protein bar
By Distribution Channel
Supermarkets/Hypermarkets
Convenience stores
Drug stores
Others
Chapter 11. Asia Pacific Protein Bars Analysis and Outlook
11.1. Asia Pacific Protein Bars Revenue (USD Million), and Revenue (USD Million) by Segments (2021-2034)
11.1.1. Asia Pacific Protein Bars Revenue (USD Million) by Type (2021-2034)
11.1.2. Asia Pacific Protein Bars Revenue (USD Million) by Application (2021-2034)
11.1.3. Asia Pacific Protein Bars Revenue (USD Million) by Product (2021-2034)
By Product
Medium protein bar
Low protein bar
High protein bar
By Distribution Channel
Supermarkets/Hypermarkets
Convenience stores
Drug stores
Others
Chapter 12. South America Protein Bars Analysis and Outlook
12.1. South America Protein Bars Revenue (USD Million), by Segments (2021-2034)
12.1.1. South America Protein Bars Revenue (USD Million) by Type (2021-2034)
12.1.2. South America Protein Bars Revenue (USD Million) by Application (2021-2034)
12.1.3. South America Protein Bars Revenue (USD Million) by Product (2021-2034)
By Product
Medium protein bar
Low protein bar
High protein bar
By Distribution Channel
Supermarkets/Hypermarkets
Convenience stores
Drug stores
Others
Chapter 13. Middle East and Africa Protein Bars Analysis and Outlook
13.1. Middle East and Africa Protein Bars Revenue (USD Million), by Segments (2021-2034)
13.1.1. Middle East and Africa Protein Bars Revenue (USD Million) by Type (2021-2034)
13.1.2. Middle East and Africa Protein Bars Revenue (USD Million) by Application (2021-2034)
13.1.3. Middle East and Africa Protein Bars Revenue (USD Million) by Product (2021-2034)
By Product
Medium protein bar
Low protein bar
High protein bar
By Distribution Channel
Supermarkets/Hypermarkets
Convenience stores
Drug stores
Others
Chapter 14. Protein Bars Company Profiles
14.1 Business Overview
14.2 Product Profiles
14.3 SWOT Profiles
14.5 Recent Developments
14.6 Financial Profile
List of Companies
Abbott Laboratories
Bright Lifecare Pvt. Ltd
General Mills Inc
Glanbia plc
Hormel Foods Corp
Kellogg Co
Lotus Bakeries NV
Mars Inc
Mondelez International Inc
Nestle SA
NuGo Nutrition
O T E Sports Ltd
PepsiCo Inc
Post Holdings Inc
Premier Nutrition Co. LLC
15. Methodology and Data Sources
15.1 Customization Offerings
15.2 Subscription Services
15.3 Related Reports
15.4 Publisher Expertise
LIST OF TABLES
Table 1 Market Segmentation Analysis
Table 2 Global Protein Bars Market Share of Leading Companies, 2023
Table 3 Product Offerings of Leading Companies
Table 4 Low Growth Scenario Forecasts
Table 5 Reference Case Growth Scenario
Table 6 High Growth Case Scenario
Table 7 Global Protein Bars Revenue (USD Million) And CAGR (%) By Type (2021-2034)
Table 8 Global Protein Bars Revenue (USD Million) And CAGR (%) By Application (2021-2034)
Table 9 Global Protein Bars Revenue (USD Million) And CAGR (%) By Product (2021-2034)
Table 10 Global Protein Bars Market Revenue (USD Million) By Regions (2021-2034)
Table 11 Global Protein Bars Market Share (%) By Regions (2021-2034)
Table 12 North America Protein Bars Revenue (USD Million) By Country (2021-2034)
Table 13 Europe Protein Bars Revenue (USD Million) By Country (2021-2034)
Table 14 Asia Pacific Protein Bars Revenue (USD Million) By Country (2021-2034)
Table 15 South America Protein Bars Revenue (USD Million) By Country (2021-2034)
Table 16 Middle East and Africa Protein Bars Revenue (USD Million) By Region (2021-2034)
Table 17 North America Protein Bars Revenue (USD Million) By Type (2021-2034)
Table 18 North America Protein Bars Revenue (USD Million) By Application (2021-2034)
Table 19 North America Protein Bars Revenue (USD Million) By Product (2021-2034)
Table 20 Europe Protein Bars Revenue (USD Million) By Type (2021-2034)
Table 21 Europe Protein Bars Revenue (USD Million) By Application (2021-2034)
Table 22 Europe Protein Bars Revenue (USD Million) By Product (2021-2034)
Table 23 Asia Pacific Protein Bars Revenue (USD Million) By Type (2021-2034)
Table 24 Asia Pacific Protein Bars Revenue (USD Million) By Application (2021-2034)
Table 25 Asia Pacific Protein Bars Revenue (USD Million) By Product (2021-2034)
Table 26 South America Protein Bars Revenue (USD Million) By Type (2021-2034)
Table 27 South America Protein Bars Revenue (USD Million) By Application (2021-2034)
Table 28 South America Protein Bars Revenue (USD Million) By Product (2021-2034)
Table 29 Middle East and Africa Protein Bars Revenue (USD Million) By Type (2021-2034)
Table 30 Middle East and Africa Protein Bars Revenue (USD Million) By Application (2021-2034)
Table 31 Middle East and Africa Protein Bars Revenue (USD Million) By Product (2021-2034)
LIST OF FIGURES
Figure 1. Market Scope
Figure 2. Pricing Forecasts Per Unit, 2023- 2034
Figure 3. Porter’s Five Forces
Figure 4. Global Protein Bars Market Revenue (USD Million) By Regions (2021-2034)
Figure 5. Global Protein Bars Market Share (%) By Regions (2023)
Figure 6. North America Protein Bars Revenue (USD Million) By Country (2021-2034)
Figure 7. United States Protein Bars Revenue (USD Million) By Country (2021-2034)
Figure 8. Canada Protein Bars Revenue (USD Million) By Country (2021-2034)
Figure 9. Mexico Protein Bars Revenue (USD Million) By Country (2021-2034)
Figure 10. Europe Protein Bars Revenue (USD Million) By Country (2021-2034)
Figure 11. Germany Protein Bars Revenue (USD Million) By Country (2021-2034)
Figure 12. France Protein Bars Revenue (USD Million) By Country (2021-2034)
Figure 13. United Kingdom Protein Bars Revenue (USD Million) By Country (2021-2034)
Figure 14. Spain Protein Bars Revenue (USD Million) By Country (2021-2034)
Figure 15. Italy Protein Bars Revenue (USD Million) By Country (2021-2034)
Figure 16. Russia Protein Bars Revenue (USD Million) By Country (2021-2034)
Figure 17. Rest of Europe Protein Bars Revenue (USD Million) By Country (2021-2034)
Figure 11. Asia Pacific Protein Bars Revenue (USD Million) By Country (2021-2034)
Figure 12. China Protein Bars Revenue (USD Million) By Country (2021-2034)
Figure 13. Japan Protein Bars Revenue (USD Million) By Country (2021-2034)
Figure 14. India Protein Bars Revenue (USD Million) By Country (2021-2034)
Figure 15. South Korea Protein Bars Revenue (USD Million) By Country (2021-2034)
Figure 16. Australia Protein Bars Revenue (USD Million) By Country (2021-2034)
Figure 17. South East Asia Protein Bars Revenue (USD Million) By Country (2021-2034)
Figure 18. South America Protein Bars Revenue (USD Million) By Country (2021-2034)
Figure 19. Brazil Protein Bars Revenue (USD Million) By Country (2021-2034)
Figure 20. Argentina Protein Bars Revenue (USD Million) By Country (2021-2034)
Figure 21. Rest of Asia Pacific Protein Bars Revenue (USD Million) By Country (2021-2034)
Figure 22. Middle East and Africa Protein Bars Revenue (USD Million) By Region (2021-2034)
Figure 23. Saudi Arabia Protein Bars Revenue (USD Million) By Region (2021-2034)
Figure 24. The UAE Protein Bars Revenue (USD Million) By Region (2021-2034)
Figure 25. Rest of Middle East Protein Bars Revenue (USD Million) By Region (2021-2034)
Figure 26. South Africa Protein Bars Revenue (USD Million) By Region (2021-2034)
Figure 27. Africa Protein Bars Revenue (USD Million) By Region (2021-2034)
Figure 28. North America Protein Bars Revenue (USD Million) By Type (2021-2034)
Figure 29. North America Protein Bars Revenue (USD Million) By Application (2021-2034)
Figure 30. North America Protein Bars Revenue (USD Million) By Product (2021-2034)
Figure 31. Europe Protein Bars Revenue (USD Million) By Type (2021-2034)
Figure 32. Europe Protein Bars Revenue (USD Million) By Application (2021-2034)
Figure 33. Europe Protein Bars Revenue (USD Million) By Product (2021-2034)
Figure 34. Asia Pacific Protein Bars Revenue (USD Million) By Type (2021-2034)
Figure 35. Asia Pacific Protein Bars Revenue (USD Million) By Application (2021-2034)
Figure 36. Asia Pacific Protein Bars Revenue (USD Million) By Product (2021-2034)
Figure 37. South America Protein Bars Revenue (USD Million) By Type (2021-2034)
Figure 38. South America Protein Bars Revenue (USD Million) By Application (2021-2034)
Figure 39. South America Protein Bars Revenue (USD Million) By Product (2021-2034)
Figure 40. Middle East and Africa Protein Bars Revenue (USD Million) By Type (2021-2034)
Figure 41. Middle East and Africa Protein Bars Revenue (USD Million) By Application (2021-2034)
Figure 42. Middle East and Africa Protein Bars Revenue (USD Million) By Product (2021-2034)
By Product
Medium protein bar
Low protein bar
High protein bar
By Distribution Channel
Supermarkets/Hypermarkets
Convenience stores
Drug stores
Others
Countries Analyzed
North America (US, Canada, Mexico)
Europe (Germany, UK, France, Spain, Italy, Russia, Rest of Europe)
Asia Pacific (China, India, Japan, South Korea, Australia, South East Asia, Rest of Asia)
South America (Brazil, Argentina, Rest of South America)
Middle East and Africa (Saudi Arabia, UAE, Rest of Middle East, South Africa, Egypt, Rest of Africa)
