
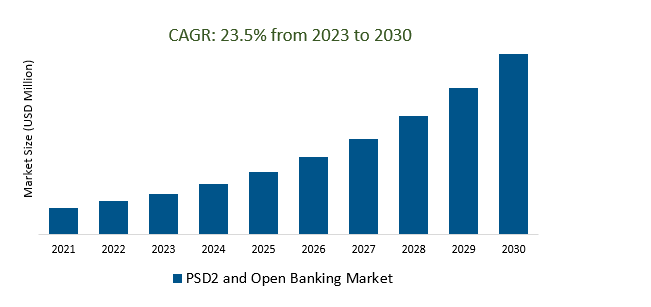
The Global PSD2 and Open Banking Market Size is estimated to register 23.5% growth over the forecast period from 2023 to 2030.
An increasing number of These regulations drive the market growth and have encouraged innovation in the financial sector. Banks and fintech are developing new products and services, such as payment initiation services and account information services. Leading Companies focusing on Global Expansion, Increased Adoption, Fintech Innovation, Ecosystem Growth, Financial Inclusion, Cross-Border Transactions, Partnerships and Collaborations, Regulatory Technology (Regtech), and others to boost market shares in the industry.
PSD2 and Open Banking represent a regulatory framework and market concept that enhance competition, innovation, and security in the financial sector. PSD2 mandates strong customer authentication and encourages open APIs, facilitating data sharing between traditional banks and third-party providers (TPPs). Market trends include increased innovation, partnerships between banks and fintechs, and data monetization, resulting in improved customer experiences and more personalized services. Challenges revolve around security, standardization, and regulatory compliance. The global expansion of Open Banking and its future scope signal ongoing transformative potential in the financial industry.
The PSD2 and Open Banking market is experiencing rapid growth due to increasing adoption by consumers and businesses, driven by the convenience and value it offers. Regulatory oversight and adjustments, fintech disruption, data monetization, and global expansion are key factors shaping the market's trajectory. Collaboration between traditional banks and fintechs, coupled with technological advancements, is fueling innovation and security enhancements, making it a transformative force in the financial services industry.
Blockchain and distributed ledger technology (DLT) are gaining traction in the PSD2 and Open Banking market due to their ability to enhance security, transparency, and efficiency. These technologies offer immutability, decentralization, and trust, making them invaluable for storing sensitive financial data, and transaction records, and streamlining settlement processes. While efforts are underway to establish standards and address scalability, regulatory support, and cross-industry adoption are propelling their integration. Collaboration between traditional banks, fintechs, and international initiatives is promoting the use of blockchain and DLT, heralding a promising era of improved financial services.
The PSD2 and Open Banking Market are driving the growth of the API economy, as financial institutions and third-party providers increasingly adopt APIs to share data and services. This proliferation of APIs is transforming traditional banking models, fostering competition, and spurring innovation in the financial sector. The API economy enhances customer experiences by enabling seamless integration of financial services, while security and regulatory considerations remain crucial. Efforts to standardize APIs are simplifying integration, and open collaboration is promoting resource sharing. The principles of the API economy are not confined to a single region, as similar initiatives are emerging globally, offering data monetization opportunities and reshaping the financial services industry.
The Global PSD2 and Open Banking Market is analyzed across PSD2, Open Banking, and others. Open Banking is poised to register the fastest growth. Open Banking, closely tied to PSD2 regulation in Europe, is a transformative trend that requires banks to provide third-party providers (TPPs) access to customer data and payment initiation services through open APIs. It fosters innovation, enhances competition, and empowers consumers by enabling the development of new financial products and services. Open Banking's global expansion is reshaping the financial industry, promoting collaboration between banks and fintech companies, while also raising concerns about security, data privacy, and compliance. This market is poised for further growth and innovation.
The Global PSD2 and Open Banking Market is analyzed across various applications including Commercial, Industrial, and others. Of these, Commercial held a significant market share in 2023. The commercial PSD2 and Open Banking market extends the principles of PSD2 and Open Banking to commercial or business financial services, allowing companies to access banking and payment services, share financial data, and utilize third-party providers (TPPs) via open APIs. This facilitates streamlined commercial financial operations, enhanced cash flow management, and access to innovative financial solutions, with a strong focus on security, data privacy, and regulatory compliance, similar to the consumer-oriented Open Banking market.
By Type
By Application
By Region
*List not exhaustive
PSD2 and Open Banking Market Outlook 2023
1 Market Overview
1.1 Introduction to the PSD2 and Open Banking Market
1.2 Scope of the Study
1.3 Research Objective
1.3.1 Key Market Scope and Segments
1.3.2 Players Covered
1.3.3 Years Considered
2 Executive Summary
2.1 2023 PSD2 and Open Banking Industry- Market Statistics
3 Market Dynamics
3.1 Market Drivers
3.2 Market Challenges
3.3 Market Opportunities
3.4 Market Trends
4 Market Factor Analysis
4.1 Porter’s Five Forces
4.2 Market Entropy
4.2.1 Global PSD2 and Open Banking Market Companies with Area Served
4.2.2 Products Offerings Global PSD2 and Open Banking Market
5 COVID-19 Impact Analysis and Outlook Scenarios
5.1.1 Covid-19 Impact Analysis
5.1.2 post-COVID-19 Scenario- Low Growth Case
5.1.3 post-COVID-19 Scenario- Reference Growth Case
5.1.4 post-COVID-19 Scenario- Low Growth Case
6 Global PSD2 and Open Banking Market Trends
6.1 Global PSD2 and Open Banking Revenue (USD Million) and CAGR (%) by Type (2018-2030)
6.2 Global PSD2 and Open Banking Revenue (USD Million) and CAGR (%) by Applications (2018-2030)
6.3 Global PSD2 and Open Banking Revenue (USD Million) and CAGR (%) by regions (2018-2030)
7 Global PSD2 and Open Banking Market Revenue (USD Million) by Type, and Applications (2018-2022)
7.1 Global PSD2 and Open Banking Revenue (USD Million) by Type (2018-2022)
7.1.1 Global PSD2 and Open Banking Revenue (USD Million), Market Share (%) by Type (2018-2022)
7.2 Global PSD2 and Open Banking Revenue (USD Million) by Applications (2018-2022)
7.2.1 Global PSD2 and Open Banking Revenue (USD Million), Market Share (%) by Applications (2018-2022)
8 Global PSD2 and Open Banking Development Regional Status and Outlook
8.1 Global PSD2 and Open Banking Revenue (USD Million) By Regions (2018-2022)
8.2 North America PSD2 and Open Banking Revenue (USD Million) by Type, and Application (2018-2022)
8.2.1 North America PSD2 and Open Banking Revenue (USD Million) by Country (2018-2022)
8.2.2 North America PSD2 and Open Banking Revenue (USD Million) by Type (2018-2022)
8.2.3 North America PSD2 and Open Banking Revenue (USD Million) by Applications (2018-2022)
8.3 Europe PSD2 and Open Banking Revenue (USD Million), by Type, and Applications (USD Million) (2018-2022)
8.3.1 Europe PSD2 and Open Banking Revenue (USD Million), by Country (2018-2022)
8.3.2 Europe PSD2 and Open Banking Revenue (USD Million) by Type (2018-2022)
8.3.3 Europe PSD2 and Open Banking Revenue (USD Million) by Applications (2018-2022)
8.4 Asia Pacific PSD2 and Open Banking Revenue (USD Million), and Revenue (USD Million) by Type, and Applications (2018-2022)
8.4.1 Asia Pacific PSD2 and Open Banking Revenue (USD Million) by Country (2018-2022)
8.4.2 Asia Pacific PSD2 and Open Banking Revenue (USD Million) by Type (2018-2022)
8.4.3 Asia Pacific PSD2 and Open Banking Revenue (USD Million) by Applications (2018-2022)
8.5 South America PSD2 and Open Banking Revenue (USD Million), by Type, and Applications (2018-2022)
8.5.1 South America PSD2 and Open Banking Revenue (USD Million), by Country (2018-2022)
8.5.2 South America PSD2 and Open Banking Revenue (USD Million) by Type (2018-2022)
8.5.3 South America PSD2 and Open Banking Revenue (USD Million) by Applications (2018-2022)
8.6 Middle East and Africa PSD2 and Open Banking Revenue (USD Million), by Type, Technology, Application, Thickness (2018-2022)
8.6.1 Middle East and Africa PSD2 and Open Banking Revenue (USD Million) by Country (2018-2022)
8.6.2 Middle East and Africa PSD2 and Open Banking Revenue (USD Million) by Type (2018-2022)
8.6.3 Middle East and Africa PSD2 and Open Banking Revenue (USD Million) by Applications (2018-2022)
9 Company Profiles
10 Global PSD2 and Open Banking Market Revenue (USD Million), by Type, and Applications (2023-2030)
10.1 Global PSD2 and Open Banking Revenue (USD Million) and Market Share (%) by Type (2023-2030)
10.1.1 Global PSD2 and Open Banking Revenue (USD Million), and Market Share (%) by Type (2023-2030)
10.2 Global PSD2 and Open Banking Revenue (USD Million) and Market Share (%) by Applications (2023-2030)
10.2.1 Global PSD2 and Open Banking Revenue (USD Million), and Market Share (%) by Applications (2023-2030)
11 Global PSD2 and Open Banking Development Regional Status and Outlook Forecast
11.1 Global PSD2 and Open Banking Revenue (USD Million) By Regions (2023-2030)
11.2 North America PSD2 and Open Banking Revenue (USD Million) by Type, and Applications (2023-2030)
11.2.1 North America PSD2 and Open Banking Revenue (USD) Million by Country (2023-2030)
11.2.2 North America PSD2 and Open Banking Revenue (USD Million), by Type (2023-2030)
11.2.3 North America PSD2 and Open Banking Revenue (USD Million), Market Share (%) by Applications (2023-2030)
11.3 Europe PSD2 and Open Banking Revenue (USD Million), by Type, and Applications (2023-2030)
11.3.1 Europe PSD2 and Open Banking Revenue (USD Million), by Country (2023-2030)
11.3.2 Europe PSD2 and Open Banking Revenue (USD Million), by Type (2023-2030)
11.3.3 Europe PSD2 and Open Banking Revenue (USD Million), by Applications (2023-2030)
11.4 Asia Pacific PSD2 and Open Banking Revenue (USD Million) by Type, and Applications (2023-2030)
11.4.1 Asia Pacific PSD2 and Open Banking Revenue (USD Million), by Country (2023-2030)
11.4.2 Asia Pacific PSD2 and Open Banking Revenue (USD Million), by Type (2023-2030)
11.4.3 Asia Pacific PSD2 and Open Banking Revenue (USD Million), by Applications (2023-2030)
11.5 South America PSD2 and Open Banking Revenue (USD Million), by Type, and Applications (2023-2030)
11.5.1 South America PSD2 and Open Banking Revenue (USD Million), by Country (2023-2030)
11.5.2 South America PSD2 and Open Banking Revenue (USD Million), by Type (2023-2030)
11.5.3 South America PSD2 and Open Banking Revenue (USD Million), by Applications (2023-2030)
11.6 Middle East and Africa PSD2 and Open Banking Revenue (USD Million), by Type, and Applications (2023-2030)
11.6.1 Middle East and Africa PSD2 and Open Banking Revenue (USD Million), by region (2023-2030)
11.6.2 Middle East and Africa PSD2 and Open Banking Revenue (USD Million), by Type (2023-2030)
11.6.3 Middle East and Africa PSD2 and Open Banking Revenue (USD Million), by Applications (2023-2030)
12 Methodology and Data Sources
12.1 Methodology/Research Approach
12.1.1 Research Programs/Design
12.1.2 Market Size Estimation
12.1.3 Market Breakdown and Data Triangulation
12.2 Data Sources
12.2.1 Secondary Sources
12.2.2 Primary Sources
12.3 Disclaimer
List of Tables
Table 1 Market Segmentation Analysis
Table 2 Global PSD2 and Open Banking Market Companies with Areas Served
Table 3 Products Offerings Global PSD2 and Open Banking Market
Table 4 Low Growth Scenario Forecasts
Table 5 Reference Case Growth Scenario
Table 6 High Growth Case Scenario
Table 7 Global PSD2 and Open Banking Revenue (USD Million) And CAGR (%) By Type (2018-2030)
Table 8 Global PSD2 and Open Banking Revenue (USD Million) And CAGR (%) By Applications (2018-2030)
Table 9 Global PSD2 and Open Banking Revenue (USD Million) And CAGR (%) By Regions (2018-2030)
Table 10 Global PSD2 and Open Banking Revenue (USD Million) By Type (2018-2022)
Table 11 Global PSD2 and Open Banking Revenue Market Share (%) By Type (2018-2022)
Table 12 Global PSD2 and Open Banking Revenue (USD Million) By Applications (2018-2022)
Table 13 Global PSD2 and Open Banking Revenue Market Share (%) By Applications (2018-2022)
Table 14 Global PSD2 and Open Banking Market Revenue (USD Million) By Regions (2018-2022)
Table 15 Global PSD2 and Open Banking Market Share (%) By Regions (2018-2022)
Table 16 North America PSD2 and Open Banking Revenue (USD Million) By Country (2018-2022)
Table 17 North America PSD2 and Open Banking Revenue (USD Million) By Type (2018-2022)
Table 18 North America PSD2 and Open Banking Revenue (USD Million) By Applications (2018-2022)
Table 19 Europe PSD2 and Open Banking Revenue (USD Million) By Country (2018-2022)
Table 20 Europe PSD2 and Open Banking Revenue (USD Million) By Type (2018-2022)
Table 21 Europe PSD2 and Open Banking Revenue (USD Million) By Applications (2018-2022)
Table 22 Asia Pacific PSD2 and Open Banking Revenue (USD Million) By Country (2018-2022)
Table 23 Asia Pacific PSD2 and Open Banking Revenue (USD Million) By Type (2018-2022)
Table 24 Asia Pacific PSD2 and Open Banking Revenue (USD Million) By Applications (2018-2022)
Table 25 South America PSD2 and Open Banking Revenue (USD Million) By Country (2018-2022)
Table 26 South America PSD2 and Open Banking Revenue (USD Million) By Type (2018-2022)
Table 27 South America PSD2 and Open Banking Revenue (USD Million) By Applications (2018-2022)
Table 28 Middle East and Africa PSD2 and Open Banking Revenue (USD Million) By Region (2018-2022)
Table 29 Middle East and Africa PSD2 and Open Banking Revenue (USD Million) By Type (2018-2022)
Table 30 Middle East and Africa PSD2 and Open Banking Revenue (USD Million) By Applications (2018-2022)
Table 31 Financial Analysis
Table 32 Global PSD2 and Open Banking Revenue (USD Million) By Type (2023-2030)
Table 33 Global PSD2 and Open Banking Revenue Market Share (%) By Type (2023-2030)
Table 34 Global PSD2 and Open Banking Revenue (USD Million) By Applications (2023-2030)
Table 35 Global PSD2 and Open Banking Revenue Market Share (%) By Applications (2023-2030)
Table 36 Global PSD2 and Open Banking Market Revenue (USD Million), And Revenue (USD Million) By Regions (2023-2030)
Table 37 North America PSD2 and Open Banking Revenue (USD)By Country (2023-2030)
Table 38 North America PSD2 and Open Banking Revenue (USD Million) By Type (2023-2030)
Table 39 North America PSD2 and Open Banking Revenue (USD Million) By Applications (2023-2030)
Table 40 Europe PSD2 and Open Banking Revenue (USD Million) By Country (2023-2030)
Table 41 Europe PSD2 and Open Banking Revenue (USD Million) By Type (2023-2030)
Table 42 Europe PSD2 and Open Banking Revenue (USD Million) By Applications (2023-2030)
Table 43 Asia Pacific PSD2 and Open Banking Revenue (USD Million) By Country (2023-2030)
Table 44 Asia Pacific PSD2 and Open Banking Revenue (USD Million) By Type (2023-2030)
Table 45 Asia Pacific PSD2 and Open Banking Revenue (USD Million) By Applications (2023-2030)
Table 46 South America PSD2 and Open Banking Revenue (USD Million) By Country (2023-2030)
Table 47 South America PSD2 and Open Banking Revenue (USD Million) By Type (2023-2030)
Table 48 South America PSD2 and Open Banking Revenue (USD Million) By Applications (2023-2030)
Table 49 Middle East and Africa PSD2 and Open Banking Revenue (USD Million) By Region (2023-2030)
Table 50 Middle East and Africa PSD2 and Open Banking Revenue (USD Million) By Region (2023-2030)
Table 51 Middle East and Africa PSD2 and Open Banking Revenue (USD Million) By Type (2023-2030)
Table 52 Middle East and Africa PSD2 and Open Banking Revenue (USD Million) By Applications (2023-2030)
Table 53 Research Programs/Design for This Report
Table 54 Key Data Information from Secondary Sources
Table 55 Key Data Information from Primary Sources
List of Figures
Figure 1 Market Scope
Figure 2 Porter’s Five Forces
Figure 3 Global PSD2 and Open Banking Revenue (USD Million) By Type (2018-2022)
Figure 4 Global PSD2 and Open Banking Revenue Market Share (%) By Type (2022)
Figure 5 Global PSD2 and Open Banking Revenue (USD Million) By Applications (2018-2022)
Figure 6 Global PSD2 and Open Banking Revenue Market Share (%) By Applications (2022)
Figure 7 Global PSD2 and Open Banking Market Revenue (USD Million) By Regions (2018-2022)
Figure 8 Global PSD2 and Open Banking Market Share (%) By Regions (2022)
Figure 9 North America PSD2 and Open Banking Revenue (USD Million) By Country (2018-2022)
Figure 10 North America PSD2 and Open Banking Revenue (USD Million) By Type (2018-2022)
Figure 11 North America PSD2 and Open Banking Revenue (USD Million) By Applications (2018-2022)
Figure 12 Europe PSD2 and Open Banking Revenue (USD Million) By Country (2018-2022)
Figure 13 Europe PSD2 and Open Banking Revenue (USD Million) By Type (2018-2022)
Figure 14 Europe PSD2 and Open Banking Revenue (USD Million) By Applications (2018-2022)
Figure 15 Asia Pacific PSD2 and Open Banking Revenue (USD Million) By Country (2018-2022)
Figure 16 Asia Pacific PSD2 and Open Banking Revenue (USD Million) By Type (2018-2022)
Figure 17 Asia Pacific PSD2 and Open Banking Revenue (USD Million) By Applications (2018-2022)
Figure 18 South America PSD2 and Open Banking Revenue (USD Million) By Country (2018-2022)
Figure 19 South America PSD2 and Open Banking Revenue (USD Million) By Type (2018-2022)
Figure 20 South America PSD2 and Open Banking Revenue (USD Million) By Applications (2018-2022)
Figure 21 Middle East and Africa PSD2 and Open Banking Revenue (USD Million) By Region (2018-2022)
Figure 22 Middle East and Africa PSD2 and Open Banking Revenue (USD Million) By Type (2018-2022)
Figure 23 Middle East and Africa PSD2 and Open Banking Revenue (USD Million) By Applications (2018-2022)
Figure 24 Global PSD2 and Open Banking Revenue (USD Million) By Type (2023-2030)
Figure 25 Global PSD2 and Open Banking Revenue Market Share (%) By Type (2030)
Figure 26 Global PSD2 and Open Banking Revenue (USD Million) By Applications (2023-2030)
Figure 27 Global PSD2 and Open Banking Revenue Market Share (%) By Applications (2030)
Figure 28 Global PSD2 and Open Banking Market Revenue (USD Million) By Regions (2023-2030)
Figure 29 North America PSD2 and Open Banking Revenue (USD Million) By Country (2023-2030)
Figure 30 North America PSD2 and Open Banking Revenue (USD Million) By Type (2023-2030)
Figure 31 North America PSD2 and Open Banking Revenue (USD Million) By Applications (2023-2030)
Figure 32 Europe PSD2 and Open Banking Revenue (USD Million) By Country (2023-2030)
Figure 33 Europe PSD2 and Open Banking Revenue (USD Million) By Type (2023-2030)
Figure 34 Europe PSD2 and Open Banking Revenue (USD Million) By Applications (2023-2030)
Figure 35 Asia Pacific PSD2 and Open Banking Revenue (USD Million) By Country (2023-2030)
Figure 36 Asia Pacific PSD2 and Open Banking Revenue (USD Million) By Type (2023-2030)
Figure 37 Asia Pacific PSD2 and Open Banking Revenue (USD Million) By Applications (2023-2030)
Figure 38 South America PSD2 and Open Banking Revenue (USD Million) By Country (2023-2030)
Figure 39 South America PSD2 and Open Banking Revenue (USD Million) By Type (2023-2030)
Figure 40 South America PSD2 and Open Banking Revenue (USD Million) By Applications (2023-2030)
Figure 41 Middle East and Africa PSD2 and Open Banking Revenue (USD Million) By Region (2023-2030)
Figure 42 Middle East and Africa PSD2 and Open Banking Revenue (USD Million) By Region (2023-2030)
Figure 43 Middle East and Africa PSD2 and Open Banking Revenue (USD Million) By Type (2023-2030)
Figure 44 Middle East and Africa PSD2 and Open Banking Revenue (USD Million) By Applications (2023-2030)
Figure 45 Bottom-Up and Top-Down Approaches for This Report
Figure 46 Data Triangulation
By Type
By Application
By Region