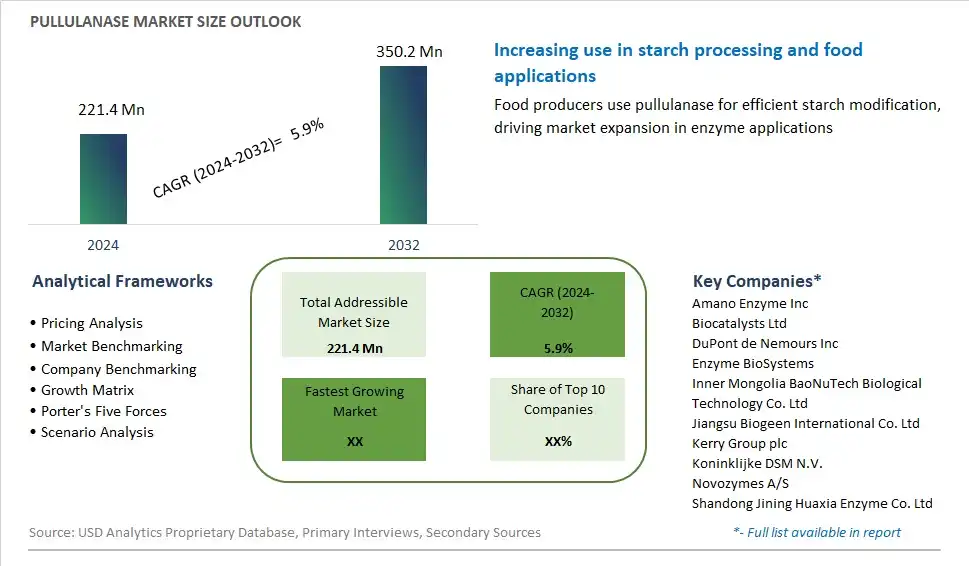
Global Pullulanase Market Size is valued at $221.4 Million in 2024 and is forecast to register a growth rate (CAGR) of 5.9% to reach $350.2 Million by 2032.
The global Pullulanase Market Comprehensive Study analyzes and forecasts the market size across 6 regions and 24 countries for diverse segments -By Application (Food and Beverage, Biofuel Production, Pharmaceutical and Biotechnology, Textile and Paper), By End-User (Brewing and Distilling, Food Processing, Biofuel and Renewable Energy, Textile and Paper Manufacturing)
An Introduction to Pullulanase Market
The pullulanase market in 2024 is characterized by steady growth driven by its diverse applications across various industries, including food and beverage, starch processing, and biofuel production. Pullulanase, an enzyme that catalyzes the hydrolysis of pullulan and other polysaccharides, plays a crucial role in improving process efficiency, product quality, and sustainability in these sectors. In the food and beverage industry, pullulanase is utilized for starch modification, reducing viscosity, and enhancing texture in products such as baked goods, beverages, and sauces. Similarly, in starch processing, pullulanase aids in the production of high-quality starch derivatives and sweeteners with improved functional properties. Moreover, the growing demand for biofuels as renewable energy sources has spurred interest in pullulanase for its role in biomass conversion and ethanol production. As industries prioritize efficiency and sustainability, the pullulanase market is poised for continued expansion, driven by ongoing research and innovation in enzyme technology and bioprocessing techniques.
Pullulanase Competitive Landscape
The market report analyses the leading companies in the industry including Amano Enzyme Inc, Biocatalysts Ltd, DuPont de Nemours Inc, Enzyme BioSystems, Inner Mongolia BaoNuTech Biological Technology Co. Ltd, Jiangsu Biogeen International Co. Ltd, Kerry Group plc, Koninklijke DSM N.V., Novozymes A/S, Shandong Jining Huaxia Enzyme Co. Ltd, and Others.
Pullulanase Market Dynamics
Pullulanase Market Trend: Increased Utilization in Food and Beverage Industries
Pullulanase is experiencing a notable trend marked by increased utilization in the food and beverage industries. Pullulanase, an enzyme commonly used in food processing, is valued for its ability to break down complex carbohydrates, such as starch and pullulan, into simpler sugars. This trend is driven by the growing demand for enzymes in food production to improve texture, flavor, and shelf life, as well as to optimize manufacturing processes. As food manufacturers seek to enhance product quality, reduce production costs, and meet consumer preferences for clean label and natural ingredients, the use of pullulanase is expected to continue to grow across various food and beverage applications.
Market Driver: Demand for Process Efficiency and Cost Reduction
The market for Pullulanase is primarily driven by the demand for process efficiency and cost reduction in food and beverage production. Pullulanase plays a crucial role in enzymatic hydrolysis processes, where it helps to break down starch molecules into fermentable sugars, thereby increasing yield and reducing processing time. With the increasing pressure on food manufacturers to improve productivity, streamline operations, and minimize waste, pullulanase offers a cost-effective solution to optimize production efficiency and resource utilization. Additionally, the enzyme's ability to enhance the sensory characteristics and nutritional profile of food products further contributes to its widespread adoption in the food and beverage industry.
Market Opportunity: Expansion into New Applications and Industries
The market for Pullulanase presents a significant opportunity for companies to expand into new applications and industries beyond traditional food and beverage sectors. Pullulanase has potential applications in various industrial processes, including biofuel production, textile processing, and pharmaceutical manufacturing, where it can facilitate the conversion of starch-based substrates into value-added products. By leveraging its enzymatic properties and versatility, pullulanase can unlock opportunities for innovation and diversification in non-food sectors, enabling companies to capitalize on emerging market trends and customer demands. Additionally, there are opportunities to develop specialized pullulanase formulations tailored to specific industrial applications, driving market penetration and revenue growth in new market segments.
Pullulanase Market Share Analysis: Food and Beverage held the dominant market share in 2024
In the landscape of the Pullulanase market, the "Food and Beverage" segment is the largest, wielding significant influence for numerous compelling reasons. Pullulanase finds extensive application in the food and beverage industry, where it plays a crucial role in various processes, including starch hydrolysis, sugar production, and fermentation. Its ability to efficiently break down starch molecules into simpler sugars enhances the texture, flavor, and shelf life of food products while facilitating the production of high-quality beverages, such as beer and alcoholic beverages. Further, the growing demand for processed foods and functional beverages drives the adoption of pullulanase as a key enzyme in food processing, offering manufacturers a cost-effective solution to improve product quality and production efficiency. Additionally, pullulanase's versatility and compatibility with diverse food formulations and processing conditions further contribute to its widespread acceptance and dominance in the Food and Beverage segment. As the food and beverage industry continues to innovate and evolve, pullulanase remains a cornerstone enzyme, shaping the trajectory of the Pullulanase market towards sustained growth and innovation.
Pullulanase Market Share Analysis: Biofuel and Renewable Energy market is poised to register the fastest growth rae over the forecast period to 2032
Among the various end-users in the Pullulanase market, the "Biofuel and Renewable Energy" segment is the fastest-growing, propelled by several key factors. Pullulanase plays a pivotal role in biofuel production processes, where it aids in the efficient conversion of starch-based substrates into fermentable sugars, subsequently facilitating the production of bioethanol and other renewable fuels. As the global focus intensifies on reducing reliance on fossil fuels and mitigating environmental impact, the demand for biofuels continues to surge, driving the adoption of pullulanase as a critical enzyme in biofuel production facilities. Additionally, advancements in biotechnology and enzyme engineering have led to the development of novel pullulanase variants with enhanced catalytic efficiency and stability, further boosting their utility in biofuel applications. Further, government incentives and regulatory mandates promoting the use of renewable energy sources propel investments in biofuel production infrastructure, creating lucrative opportunities for pullulanase manufacturers. As the biofuel industry expands and matures, the Biofuel and Renewable Energy segment is poised to sustain its rapid growth trajectory, reshaping the landscape of the Pullulanase market towards sustainable and eco-friendly solutions.
Pullulanase Market Segmentation
By Application
Food and Beverage
Biofuel Production
Pharmaceutical and Biotechnology
Textile and Paper
By End-User
Brewing and Distilling
Food Processing
Biofuel and Renewable Energy
Textile and Paper Manufacturing
Countries Analyzed
North America (US, Canada, Mexico)
Europe (Germany, UK, France, Spain, Italy, Russia, Rest of Europe)
Asia Pacific (China, India, Japan, South Korea, Australia, South East Asia, Rest of Asia)
South America (Brazil, Argentina, Rest of South America)
Middle East and Africa (Saudi Arabia, UAE, Rest of Middle East, South Africa, Egypt, Rest of Africa)
Pullulanase Companies Profiled in the Study
Amano Enzyme Inc
Biocatalysts Ltd
DuPont de Nemours Inc
Enzyme BioSystems
Inner Mongolia BaoNuTech Biological Technology Co. Ltd
Jiangsu Biogeen International Co. Ltd
Kerry Group plc
Koninklijke DSM N.V.
Novozymes A/S
Shandong Jining Huaxia Enzyme Co. Ltd
*- List Not Exhaustive
Chapter 1. TABLE OF CONTENTS
Chapter 2. Introduction to Pullulanase Market
2.1. Market Overview
2.2. Key Statistics and Report Highlights
2.3. Scope of the Comprehensive Study
2.3.1. Market Definition
2.3.2 Countries and Regions Covered
2.3.3 Research Objective
2.3.4 Units, Currency, and Conversions
2.3.5 Industry Value Chain
2.4. Key Market Segments
2.5. Key Companies
2.6. Study Period
Chapter 3. Strategic Analysis Review
3.1. Pullulanase Pricing Analysis and Forecast
3.2. Porter’s Five Forces
3.3. Market Ecosystem
3.4. SWOT Analysis
3.5. Regulatory Scenario
3.3. Effects of Inflation, Russia-Ukraine War, moderating economic growth, and other macroeconomic factors
Chapter 4. Competitive Landscape
4.1. Market Share Analysis
4.1.1. Global Pullulanase Market Share by Company, 2023
4.1.2. Product Offerings of Leading Pullulanase Companies
4.2. Market Entropy
4.2.1. New Product Launches in the Industry
4.2.2. Mergers, Acquisitions, Joint ventures, and Partnerships
4.3. Key Strategies and Best Practices
Chapter 5. Global Market Projections: Best, Reference, and Low Case Scenarios
5.1. Growth Analysis- Case Scenario Definitions
5.2. Low Growth Case Scenario Forecasts
5.3. Reference Growth Case Scenario Forecasts
5.4. High Growth Case Scenario Forecasts
Chapter 6. Market Dynamics
6.1. Pullulanase Market Drivers
6.2. Pullulanase Market Challenges
6.6. Pullulanase Market Opportunities
6.4. Pullulanase Market Trends
Chapter 7. Global Pullulanase Market Outlook Trends
7.1. Global Pullulanase Revenue (USD Million) and CAGR (%) by Type (2021-2032)
7.2. Global Pullulanase Revenue (USD Million) and CAGR (%) by Application (2021-2032)
7.3. Global Pullulanase Revenue (USD Million) and CAGR (%) by Product (2021-2032)
By Application
Food and Beverage
Biofuel Production
Pharmaceutical and Biotechnology
Textile and Paper
By End-User
Brewing and Distilling
Food Processing
Biofuel and Renewable Energy
Textile and Paper Manufacturing
Chapter 8. Global Pullulanase Regional Analysis and Outlook
8.1. Global Pullulanase Revenue (USD Million) By Regions (2021- 2032)
8.2. North America Pullulanase Revenue (USD Million) by Country (2021-2032)
8.2.1. United States Pullulanase Regional Analysis and Outlook
8.2.2. Canada Pullulanase Regional Analysis and Outlook
8.2.3. Mexico Pullulanase Regional Analysis and Outlook
8.3. Europe Pullulanase Revenue (USD Million), by Country (2021-2032)
8.3.1. Germany Pullulanase Regional Analysis and Outlook
8.3.2. France Pullulanase Regional Analysis and Outlook
8.3.3. United Kingdom Pullulanase Regional Analysis and Outlook
8.3.4. Spain Pullulanase Regional Analysis and Outlook
8.3.5. Italy Pullulanase Regional Analysis and Outlook
8.3.6. Russia Pullulanase Regional Analysis and Outlook
8.3.7. Rest of Europe Pullulanase Regional Analysis and Outlook
8.4. Asia Pacific Pullulanase Revenue (USD Million) by Country (2021-2032)
8.4.1. China Pullulanase Regional Analysis and Outlook
8.4.2. Japan Pullulanase Regional Analysis and Outlook
8.4.3. India Pullulanase Regional Analysis and Outlook
8.4.4. South Korea Pullulanase Regional Analysis and Outlook
8.4.5. Australia Pullulanase Regional Analysis and Outlook
8.4.6. South East Asia Pullulanase Regional Analysis and Outlook
8.4.7. Rest of Asia Pacific Pullulanase Regional Analysis and Outlook
8.5. South America Pullulanase Revenue (USD Million), by Country (2021-2032)
8.5.1. Brazil Pullulanase Regional Analysis and Outlook
8.5.2. Argentina Pullulanase Regional Analysis and Outlook
8.5.3. Rest of South America Pullulanase Regional Analysis and Outlook
8.6. Middle East and Africa Pullulanase Revenue (USD Million) by Country (2021-2032)
8.6.1. Middle East Pullulanase Regional Analysis and Outlook
8.6.2. Africa Pullulanase Regional Analysis and Outlook
Chapter 9. North America Pullulanase Analysis and Outlook
9.1. North America Pullulanase Revenue (USD Million) by Segments (2021-2032)
9.1.1. North America Pullulanase Revenue (USD Million) by Type (2021-2032)
9.1.2. North America Pullulanase Revenue (USD Million) by Application (2021-2032)
9.1.3. North America Pullulanase Revenue (USD Million) by Product (2021-2032)
By Application
Food and Beverage
Biofuel Production
Pharmaceutical and Biotechnology
Textile and Paper
By End-User
Brewing and Distilling
Food Processing
Biofuel and Renewable Energy
Textile and Paper Manufacturing
Chapter 10. Europe Pullulanase Analysis and Outlook
10.1. Europe Pullulanase Revenue (USD Million), by Segments (USD Million) (2021-2032)
10.1.1. Europe Pullulanase Revenue (USD Million) by Type (2021-2032)
10.1.2. Europe Pullulanase Revenue (USD Million) by Application (2021-2032)
10.1.3. Europe Pullulanase Revenue (USD Million) by Product (2021-2032)
By Application
Food and Beverage
Biofuel Production
Pharmaceutical and Biotechnology
Textile and Paper
By End-User
Brewing and Distilling
Food Processing
Biofuel and Renewable Energy
Textile and Paper Manufacturing
Chapter 11. Asia Pacific Pullulanase Analysis and Outlook
11.1. Asia Pacific Pullulanase Revenue (USD Million), and Revenue (USD Million) by Segments (2021-2032)
11.1.1. Asia Pacific Pullulanase Revenue (USD Million) by Type (2021-2032)
11.1.2. Asia Pacific Pullulanase Revenue (USD Million) by Application (2021-2032)
11.1.3. Asia Pacific Pullulanase Revenue (USD Million) by Product (2021-2032)
By Application
Food and Beverage
Biofuel Production
Pharmaceutical and Biotechnology
Textile and Paper
By End-User
Brewing and Distilling
Food Processing
Biofuel and Renewable Energy
Textile and Paper Manufacturing
Chapter 12. South America Pullulanase Analysis and Outlook
12.1. South America Pullulanase Revenue (USD Million), by Segments (2021-2032)
12.1.1. South America Pullulanase Revenue (USD Million) by Type (2021-2032)
12.1.2. South America Pullulanase Revenue (USD Million) by Application (2021-2032)
12.1.3. South America Pullulanase Revenue (USD Million) by Product (2021-2032)
By Application
Food and Beverage
Biofuel Production
Pharmaceutical and Biotechnology
Textile and Paper
By End-User
Brewing and Distilling
Food Processing
Biofuel and Renewable Energy
Textile and Paper Manufacturing
Chapter 13. Middle East and Africa Pullulanase Analysis and Outlook
13.1. Middle East and Africa Pullulanase Revenue (USD Million), by Segments (2021-2032)
13.1.1. Middle East and Africa Pullulanase Revenue (USD Million) by Type (2021-2032)
13.1.2. Middle East and Africa Pullulanase Revenue (USD Million) by Application (2021-2032)
13.1.3. Middle East and Africa Pullulanase Revenue (USD Million) by Product (2021-2032)
By Application
Food and Beverage
Biofuel Production
Pharmaceutical and Biotechnology
Textile and Paper
By End-User
Brewing and Distilling
Food Processing
Biofuel and Renewable Energy
Textile and Paper Manufacturing
Chapter 14. Pullulanase Company Profiles
14.1 Business Overview
14.2 Product Profiles
14.3 SWOT Profiles
14.5 Recent Developments
14.6 Financial Profile
List of Companies
Amano Enzyme Inc
Biocatalysts Ltd
DuPont de Nemours Inc
Enzyme BioSystems
Inner Mongolia BaoNuTech Biological Technology Co. Ltd
Jiangsu Biogeen International Co. Ltd
Kerry Group plc
Koninklijke DSM N.V.
Novozymes A/S
Shandong Jining Huaxia Enzyme Co. Ltd
15. Methodology and Data Sources
15.1 Customization Offerings
15.2 Subscription Services
15.3 Related Reports
15.4 Publisher Expertise
LIST OF TABLES
Table 1 Market Segmentation Analysis
Table 2 Global Pullulanase Market Share of Leading Companies, 2023
Table 3 Product Offerings of Leading Companies
Table 4 Low Growth Scenario Forecasts
Table 5 Reference Case Growth Scenario
Table 6 High Growth Case Scenario
Table 7 Global Pullulanase Revenue (USD Million) And CAGR (%) By Type (2021-2032)
Table 8 Global Pullulanase Revenue (USD Million) And CAGR (%) By Application (2021-2032)
Table 9 Global Pullulanase Revenue (USD Million) And CAGR (%) By Product (2021-2032)
Table 10 Global Pullulanase Market Revenue (USD Million) By Regions (2021-2032)
Table 11 Global Pullulanase Market Share (%) By Regions (2021-2032)
Table 12 North America Pullulanase Revenue (USD Million) By Country (2021-2032)
Table 13 Europe Pullulanase Revenue (USD Million) By Country (2021-2032)
Table 14 Asia Pacific Pullulanase Revenue (USD Million) By Country (2021-2032)
Table 15 South America Pullulanase Revenue (USD Million) By Country (2021-2032)
Table 16 Middle East and Africa Pullulanase Revenue (USD Million) By Region (2021-2032)
Table 17 North America Pullulanase Revenue (USD Million) By Type (2021-2032)
Table 18 North America Pullulanase Revenue (USD Million) By Application (2021-2032)
Table 19 North America Pullulanase Revenue (USD Million) By Product (2021-2032)
Table 20 Europe Pullulanase Revenue (USD Million) By Type (2021-2032)
Table 21 Europe Pullulanase Revenue (USD Million) By Application (2021-2032)
Table 22 Europe Pullulanase Revenue (USD Million) By Product (2021-2032)
Table 23 Asia Pacific Pullulanase Revenue (USD Million) By Type (2021-2032)
Table 24 Asia Pacific Pullulanase Revenue (USD Million) By Application (2021-2032)
Table 25 Asia Pacific Pullulanase Revenue (USD Million) By Product (2021-2032)
Table 26 South America Pullulanase Revenue (USD Million) By Type (2021-2032)
Table 27 South America Pullulanase Revenue (USD Million) By Application (2021-2032)
Table 28 South America Pullulanase Revenue (USD Million) By Product (2021-2032)
Table 29 Middle East and Africa Pullulanase Revenue (USD Million) By Type (2021-2032)
Table 30 Middle East and Africa Pullulanase Revenue (USD Million) By Application (2021-2032)
Table 31 Middle East and Africa Pullulanase Revenue (USD Million) By Product (2021-2032)
LIST OF FIGURES
Figure 1. Market Scope
Figure 2. Pricing Forecasts Per Unit, 2023- 2032
Figure 3. Porter’s Five Forces
Figure 4. Global Pullulanase Market Revenue (USD Million) By Regions (2021-2032)
Figure 5. Global Pullulanase Market Share (%) By Regions (2023)
Figure 6. North America Pullulanase Revenue (USD Million) By Country (2021-2032)
Figure 7. United States Pullulanase Revenue (USD Million) By Country (2021-2032)
Figure 8. Canada Pullulanase Revenue (USD Million) By Country (2021-2032)
Figure 9. Mexico Pullulanase Revenue (USD Million) By Country (2021-2032)
Figure 10. Europe Pullulanase Revenue (USD Million) By Country (2021-2032)
Figure 11. Germany Pullulanase Revenue (USD Million) By Country (2021-2032)
Figure 12. France Pullulanase Revenue (USD Million) By Country (2021-2032)
Figure 13. United Kingdom Pullulanase Revenue (USD Million) By Country (2021-2032)
Figure 14. Spain Pullulanase Revenue (USD Million) By Country (2021-2032)
Figure 15. Italy Pullulanase Revenue (USD Million) By Country (2021-2032)
Figure 16. Russia Pullulanase Revenue (USD Million) By Country (2021-2032)
Figure 17. Rest of Europe Pullulanase Revenue (USD Million) By Country (2021-2032)
Figure 11. Asia Pacific Pullulanase Revenue (USD Million) By Country (2021-2032)
Figure 12. China Pullulanase Revenue (USD Million) By Country (2021-2032)
Figure 13. Japan Pullulanase Revenue (USD Million) By Country (2021-2032)
Figure 14. India Pullulanase Revenue (USD Million) By Country (2021-2032)
Figure 15. South Korea Pullulanase Revenue (USD Million) By Country (2021-2032)
Figure 16. Australia Pullulanase Revenue (USD Million) By Country (2021-2032)
Figure 17. South East Asia Pullulanase Revenue (USD Million) By Country (2021-2032)
Figure 18. South America Pullulanase Revenue (USD Million) By Country (2021-2032)
Figure 19. Brazil Pullulanase Revenue (USD Million) By Country (2021-2032)
Figure 20. Argentina Pullulanase Revenue (USD Million) By Country (2021-2032)
Figure 21. Rest of Asia Pacific Pullulanase Revenue (USD Million) By Country (2021-2032)
Figure 22. Middle East and Africa Pullulanase Revenue (USD Million) By Region (2021-2032)
Figure 23. Saudi Arabia Pullulanase Revenue (USD Million) By Region (2021-2032)
Figure 24. The UAE Pullulanase Revenue (USD Million) By Region (2021-2032)
Figure 25. Rest of Middle East Pullulanase Revenue (USD Million) By Region (2021-2032)
Figure 26. South Africa Pullulanase Revenue (USD Million) By Region (2021-2032)
Figure 27. Africa Pullulanase Revenue (USD Million) By Region (2021-2032)
Figure 28. North America Pullulanase Revenue (USD Million) By Type (2021-2032)
Figure 29. North America Pullulanase Revenue (USD Million) By Application (2021-2032)
Figure 30. North America Pullulanase Revenue (USD Million) By Product (2021-2032)
Figure 31. Europe Pullulanase Revenue (USD Million) By Type (2021-2032)
Figure 32. Europe Pullulanase Revenue (USD Million) By Application (2021-2032)
Figure 33. Europe Pullulanase Revenue (USD Million) By Product (2021-2032)
Figure 34. Asia Pacific Pullulanase Revenue (USD Million) By Type (2021-2032)
Figure 35. Asia Pacific Pullulanase Revenue (USD Million) By Application (2021-2032)
Figure 36. Asia Pacific Pullulanase Revenue (USD Million) By Product (2021-2032)
Figure 37. South America Pullulanase Revenue (USD Million) By Type (2021-2032)
Figure 38. South America Pullulanase Revenue (USD Million) By Application (2021-2032)
Figure 39. South America Pullulanase Revenue (USD Million) By Product (2021-2032)
Figure 40. Middle East and Africa Pullulanase Revenue (USD Million) By Type (2021-2032)
Figure 41. Middle East and Africa Pullulanase Revenue (USD Million) By Application (2021-2032)
Figure 42. Middle East and Africa Pullulanase Revenue (USD Million) By Product (2021-2032)
By Application
Food and Beverage
Biofuel Production
Pharmaceutical and Biotechnology
Textile and Paper
By End-User
Brewing and Distilling
Food Processing
Biofuel and Renewable Energy
Textile and Paper Manufacturing
Countries Analyzed
North America (US, Canada, Mexico)
Europe (Germany, UK, France, Spain, Italy, Russia, Rest of Europe)
Asia Pacific (China, India, Japan, South Korea, Australia, South East Asia, Rest of Asia)
South America (Brazil, Argentina, Rest of South America)
Middle East and Africa (Saudi Arabia, UAE, Rest of Middle East, South Africa, Egypt, Rest of Africa)
