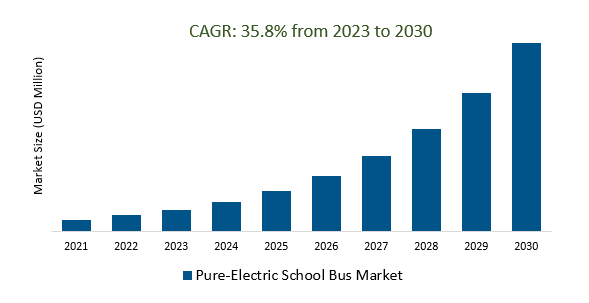
The Global Pure-Electric School Bus Market Size is estimated to register 35.8% growth over the forecast period from 2023 to 2030.
The market growth is driven by increasing awareness of environmental issues and the need to reduce greenhouse gas emissions has led to increased interest in electric vehicles, including school buses. Leading Companies focusing on Growing Environmental Awareness, Charging Infrastructure Expansion, Maintenance Cost Savings, Rising Urbanization, Alternative Business Models, Technological Innovation, and others to boost market shares in the industry.
Market Overview
The pure-electric school bus market is rapidly growing due to environmental concerns, lower operating costs, government incentives, and advanced battery technology. Key players like Blue Bird, Lion Electric, and Proterra are leading the way, offering zero-emission buses with enhanced safety features. The availability of charging infrastructure and educational value further drive adoption, while the positive public perception of electric vehicles plays a pivotal role in the market's expansion. With global reach and potential for energy resilience through V2G technology, the future of this market is promising as it aligns with the growing demand for cleaner, more sustainable school transportation solutions.
Market Dynamics
Market Trends - Impact of Advanced Battery Technology on Pure-Electric School Bus Market
The impact of advanced battery technology on the Pure-Electric School Bus Market is profound and multifaceted. Improved battery technology is expanding the range, efficiency, and overall performance of electric school buses, making them a more viable option for school districts. With longer battery life and faster charging capabilities, electric buses can cover more routes and be more operationally efficient, reducing concerns about range limitations and downtime for recharging. This advancement also contributes to significant cost savings as schools can operate buses for longer periods with reduced maintenance requirements and fuel costs. Moreover, as battery technology continues to evolve, it opens the door to innovative energy storage solutions, potentially turning electric school buses into mobile energy sources that can help stabilize the grid during peak demand or power outages, enhancing the overall resilience of the electric grid.
Market Driver- Pure-Electric School Buses Offer a Wide Range of Safety Features to Protect Students
Pure-electric school buses emphasize student safety through collision avoidance, enhanced visibility, and driver assistance tech, bolstering their appeal for safety-conscious school districts. These advanced features reduce the risk of accidents, enhance efficiency, and create a secure environment for students, making electric buses an attractive choice for school transportation.
Market Opportunity- Charging Infrastructure Is Essential for the Adoption of Pure-Electric School Buses
charging infrastructure plays a pivotal role in the adoption of pure-electric school buses. Electric school buses rely on access to reliable charging stations, and the presence of such infrastructure is essential for their widespread use. School districts need to consider factors like the placement of charging stations on bus routes, the charging speed, and the availability of charging infrastructure within the school premises. Fast-charging solutions, which can replenish a significant portion of the battery's capacity in a short time, are particularly valuable for school buses, as they minimize downtime and ensure buses are ready for their daily routes.
Market Share Analysis- Type C School Bus Pure-Electric School Bus Market will register the fastest growth
The Global Pure-Electric School Bus Market is analyzed across Type A School Bus, Type C School Bus, Type D School Bus, and others. Type C School Bus is poised to register the fastest growth. In the Pure-Electric School Bus Market, Type C school buses represent a specific category with a conventional design, including a flat-front or nose-forward appearance. When these Type C buses are electric, they fall under the pure-electric school bus segment, offering environmental benefits, cost savings, and safety features in line with the broader electric school bus market. This segment is gaining popularity as schools prioritize more sustainable and efficient transportation options while maintaining student safety and environmental responsibility.
Market Share Analysis- Government/Schools held a significant market share in 2023
The Global Pure-Electric School Bus Market is analyzed across various applications including Government/Schools, Fleet Operators, and others. Of these, Government/Schools held a significant market share in 2023. Government and schools jointly drive the adoption of pure-electric school buses by offering incentives, grants, and regulatory support to reduce emissions and improve air quality. Schools benefit from lower operating costs, reduced maintenance, and potential energy resilience. This collaboration is pivotal in advancing the adoption of cleaner, more sustainable student transportation.
Pure-Electric School Bus Market Segmentation
By Type
- Type A School Bus
- Type C School Bus
- Type D School Bus
By Application
- Government/Schools
- Fleet Operators
By Sales Channel
- Direct Channel
- Distribution Channel
By Region
- North America (United States, Canada, Mexico)
- Europe (Germany, France, United Kingdom, Spain, Italy, Others)
- Asia Pacific (China, India, Japan, South Korea, Australia, Others)
- Latin America (Brazil, Argentina, Others)
- Middle East and Africa (Saudi Arabia, UAE, Kuwait, Other Middle East, South Africa, Nigeria, Other Africa)
Pure-Electric School Bus Market Companies
- Blue Bird Corporation
- Thomas Built Buses (Daimler)
- Lion Electric Company
- IC Bus (Navistar)
- GreenPower
- Dongfeng Motor
- Collins Bus (REV Group)
- Trans Tech
- Starcraft Bus
*List not exhaustive
Pure-Electric School Bus Market Outlook 2023
1 Market Overview
1.1 Introduction to the Pure-Electric School Bus Market
1.2 Scope of the Study
1.3 Research Objective
1.3.1 Key Market Scope and Segments
1.3.2 Players Covered
1.3.3 Years Considered
2 Executive Summary
2.1 2023 Pure-Electric School Bus Industry- Market Statistics
3 Market Dynamics
3.1 Market Drivers
3.2 Market Challenges
3.3 Market Opportunities
3.4 Market Trends
4 Market Factor Analysis
4.1 Porter’s Five Forces
4.2 Market Entropy
4.2.1 Global Pure-Electric School Bus Market Companies with Area Served
4.2.2 Products Offerings Global Pure-Electric School Bus Market
5 COVID-19 Impact Analysis and Outlook Scenarios
5.1.1 Covid-19 Impact Analysis
5.1.2 post-COVID-19 Scenario- Low Growth Case
5.1.3 post-COVID-19 Scenario- Reference Growth Case
5.1.4 post-COVID-19 Scenario- Low Growth Case
6 Global Pure-Electric School Bus Market Trends
6.1 Global Pure-Electric School Bus Revenue (USD Million) and CAGR (%) by Type (2018-2030)
6.2 Global Pure-Electric School Bus Revenue (USD Million) and CAGR (%) by Applications (2018-2030)
6.3 Global Pure-Electric School Bus Revenue (USD Million) and CAGR (%) by regions (2018-2030)
7 Global Pure-Electric School Bus Market Revenue (USD Million) by Type, and Applications (2018-2022)
7.1 Global Pure-Electric School Bus Revenue (USD Million) by Type (2018-2022)
7.1.1 Global Pure-Electric School Bus Revenue (USD Million), Market Share (%) by Type (2018-2022)
7.2 Global Pure-Electric School Bus Revenue (USD Million) by Applications (2018-2022)
7.2.1 Global Pure-Electric School Bus Revenue (USD Million), Market Share (%) by Applications (2018-2022)
8 Global Pure-Electric School Bus Development Regional Status and Outlook
8.1 Global Pure-Electric School Bus Revenue (USD Million) By Regions (2018-2022)
8.2 North America Pure-Electric School Bus Revenue (USD Million) by Type, and Application (2018-2022)
8.2.1 North America Pure-Electric School Bus Revenue (USD Million) by Country (2018-2022)
8.2.2 North America Pure-Electric School Bus Revenue (USD Million) by Type (2018-2022)
8.2.3 North America Pure-Electric School Bus Revenue (USD Million) by Applications (2018-2022)
8.3 Europe Pure-Electric School Bus Revenue (USD Million), by Type, and Applications (USD Million) (2018-2022)
8.3.1 Europe Pure-Electric School Bus Revenue (USD Million), by Country (2018-2022)
8.3.2 Europe Pure-Electric School Bus Revenue (USD Million) by Type (2018-2022)
8.3.3 Europe Pure-Electric School Bus Revenue (USD Million) by Applications (2018-2022)
8.4 Asia Pacific Pure-Electric School Bus Revenue (USD Million), and Revenue (USD Million) by Type, and Applications (2018-2022)
8.4.1 Asia Pacific Pure-Electric School Bus Revenue (USD Million) by Country (2018-2022)
8.4.2 Asia Pacific Pure-Electric School Bus Revenue (USD Million) by Type (2018-2022)
8.4.3 Asia Pacific Pure-Electric School Bus Revenue (USD Million) by Applications (2018-2022)
8.5 South America Pure-Electric School Bus Revenue (USD Million), by Type, and Applications (2018-2022)
8.5.1 South America Pure-Electric School Bus Revenue (USD Million), by Country (2018-2022)
8.5.2 South America Pure-Electric School Bus Revenue (USD Million) by Type (2018-2022)
8.5.3 South America Pure-Electric School Bus Revenue (USD Million) by Applications (2018-2022)
8.6 Middle East and Africa Pure-Electric School Bus Revenue (USD Million), by Type, Technology, Application, Thickness (2018-2022)
8.6.1 Middle East and Africa Pure-Electric School Bus Revenue (USD Million) by Country (2018-2022)
8.6.2 Middle East and Africa Pure-Electric School Bus Revenue (USD Million) by Type (2018-2022)
8.6.3 Middle East and Africa Pure-Electric School Bus Revenue (USD Million) by Applications (2018-2022)
9 Company Profiles
10 Global Pure-Electric School Bus Market Revenue (USD Million), by Type, and Applications (2023-2030)
10.1 Global Pure-Electric School Bus Revenue (USD Million) and Market Share (%) by Type (2023-2030)
10.1.1 Global Pure-Electric School Bus Revenue (USD Million), and Market Share (%) by Type (2023-2030)
10.2 Global Pure-Electric School Bus Revenue (USD Million) and Market Share (%) by Applications (2023-2030)
10.2.1 Global Pure-Electric School Bus Revenue (USD Million), and Market Share (%) by Applications (2023-2030)
11 Global Pure-Electric School Bus Development Regional Status and Outlook Forecast
11.1 Global Pure-Electric School Bus Revenue (USD Million) By Regions (2023-2030)
11.2 North America Pure-Electric School Bus Revenue (USD Million) by Type, and Applications (2023-2030)
11.2.1 North America Pure-Electric School Bus Revenue (USD) Million by Country (2023-2030)
11.2.2 North America Pure-Electric School Bus Revenue (USD Million), by Type (2023-2030)
11.2.3 North America Pure-Electric School Bus Revenue (USD Million), Market Share (%) by Applications (2023-2030)
11.3 Europe Pure-Electric School Bus Revenue (USD Million), by Type, and Applications (2023-2030)
11.3.1 Europe Pure-Electric School Bus Revenue (USD Million), by Country (2023-2030)
11.3.2 Europe Pure-Electric School Bus Revenue (USD Million), by Type (2023-2030)
11.3.3 Europe Pure-Electric School Bus Revenue (USD Million), by Applications (2023-2030)
11.4 Asia Pacific Pure-Electric School Bus Revenue (USD Million) by Type, and Applications (2023-2030)
11.4.1 Asia Pacific Pure-Electric School Bus Revenue (USD Million), by Country (2023-2030)
11.4.2 Asia Pacific Pure-Electric School Bus Revenue (USD Million), by Type (2023-2030)
11.4.3 Asia Pacific Pure-Electric School Bus Revenue (USD Million), by Applications (2023-2030)
11.5 South America Pure-Electric School Bus Revenue (USD Million), by Type, and Applications (2023-2030)
11.5.1 South America Pure-Electric School Bus Revenue (USD Million), by Country (2023-2030)
11.5.2 South America Pure-Electric School Bus Revenue (USD Million), by Type (2023-2030)
11.5.3 South America Pure-Electric School Bus Revenue (USD Million), by Applications (2023-2030)
11.6 Middle East and Africa Pure-Electric School Bus Revenue (USD Million), by Type, and Applications (2023-2030)
11.6.1 Middle East and Africa Pure-Electric School Bus Revenue (USD Million), by region (2023-2030)
11.6.2 Middle East and Africa Pure-Electric School Bus Revenue (USD Million), by Type (2023-2030)
11.6.3 Middle East and Africa Pure-Electric School Bus Revenue (USD Million), by Applications (2023-2030)
12 Methodology and Data Sources
12.1 Methodology/Research Approach
12.1.1 Research Programs/Design
12.1.2 Market Size Estimation
12.1.3 Market Breakdown and Data Triangulation
12.2 Data Sources
12.2.1 Secondary Sources
12.2.2 Primary Sources
12.3 Disclaimer
List of Tables
Table 1 Market Segmentation Analysis
Table 2 Global Pure-Electric School Bus Market Companies with Areas Served
Table 3 Products Offerings Global Pure-Electric School Bus Market
Table 4 Low Growth Scenario Forecasts
Table 5 Reference Case Growth Scenario
Table 6 High Growth Case Scenario
Table 7 Global Pure-Electric School Bus Revenue (USD Million) And CAGR (%) By Type (2018-2030)
Table 8 Global Pure-Electric School Bus Revenue (USD Million) And CAGR (%) By Applications (2018-2030)
Table 9 Global Pure-Electric School Bus Revenue (USD Million) And CAGR (%) By Regions (2018-2030)
Table 10 Global Pure-Electric School Bus Revenue (USD Million) By Type (2018-2022)
Table 11 Global Pure-Electric School Bus Revenue Market Share (%) By Type (2018-2022)
Table 12 Global Pure-Electric School Bus Revenue (USD Million) By Applications (2018-2022)
Table 13 Global Pure-Electric School Bus Revenue Market Share (%) By Applications (2018-2022)
Table 14 Global Pure-Electric School Bus Market Revenue (USD Million) By Regions (2018-2022)
Table 15 Global Pure-Electric School Bus Market Share (%) By Regions (2018-2022)
Table 16 North America Pure-Electric School Bus Revenue (USD Million) By Country (2018-2022)
Table 17 North America Pure-Electric School Bus Revenue (USD Million) By Type (2018-2022)
Table 18 North America Pure-Electric School Bus Revenue (USD Million) By Applications (2018-2022)
Table 19 Europe Pure-Electric School Bus Revenue (USD Million) By Country (2018-2022)
Table 20 Europe Pure-Electric School Bus Revenue (USD Million) By Type (2018-2022)
Table 21 Europe Pure-Electric School Bus Revenue (USD Million) By Applications (2018-2022)
Table 22 Asia Pacific Pure-Electric School Bus Revenue (USD Million) By Country (2018-2022)
Table 23 Asia Pacific Pure-Electric School Bus Revenue (USD Million) By Type (2018-2022)
Table 24 Asia Pacific Pure-Electric School Bus Revenue (USD Million) By Applications (2018-2022)
Table 25 South America Pure-Electric School Bus Revenue (USD Million) By Country (2018-2022)
Table 26 South America Pure-Electric School Bus Revenue (USD Million) By Type (2018-2022)
Table 27 South America Pure-Electric School Bus Revenue (USD Million) By Applications (2018-2022)
Table 28 Middle East and Africa Pure-Electric School Bus Revenue (USD Million) By Region (2018-2022)
Table 29 Middle East and Africa Pure-Electric School Bus Revenue (USD Million) By Type (2018-2022)
Table 30 Middle East and Africa Pure-Electric School Bus Revenue (USD Million) By Applications (2018-2022)
Table 31 Financial Analysis
Table 32 Global Pure-Electric School Bus Revenue (USD Million) By Type (2023-2030)
Table 33 Global Pure-Electric School Bus Revenue Market Share (%) By Type (2023-2030)
Table 34 Global Pure-Electric School Bus Revenue (USD Million) By Applications (2023-2030)
Table 35 Global Pure-Electric School Bus Revenue Market Share (%) By Applications (2023-2030)
Table 36 Global Pure-Electric School Bus Market Revenue (USD Million), And Revenue (USD Million) By Regions (2023-2030)
Table 37 North America Pure-Electric School Bus Revenue (USD)By Country (2023-2030)
Table 38 North America Pure-Electric School Bus Revenue (USD Million) By Type (2023-2030)
Table 39 North America Pure-Electric School Bus Revenue (USD Million) By Applications (2023-2030)
Table 40 Europe Pure-Electric School Bus Revenue (USD Million) By Country (2023-2030)
Table 41 Europe Pure-Electric School Bus Revenue (USD Million) By Type (2023-2030)
Table 42 Europe Pure-Electric School Bus Revenue (USD Million) By Applications (2023-2030)
Table 43 Asia Pacific Pure-Electric School Bus Revenue (USD Million) By Country (2023-2030)
Table 44 Asia Pacific Pure-Electric School Bus Revenue (USD Million) By Type (2023-2030)
Table 45 Asia Pacific Pure-Electric School Bus Revenue (USD Million) By Applications (2023-2030)
Table 46 South America Pure-Electric School Bus Revenue (USD Million) By Country (2023-2030)
Table 47 South America Pure-Electric School Bus Revenue (USD Million) By Type (2023-2030)
Table 48 South America Pure-Electric School Bus Revenue (USD Million) By Applications (2023-2030)
Table 49 Middle East and Africa Pure-Electric School Bus Revenue (USD Million) By Region (2023-2030)
Table 50 Middle East and Africa Pure-Electric School Bus Revenue (USD Million) By Region (2023-2030)
Table 51 Middle East and Africa Pure-Electric School Bus Revenue (USD Million) By Type (2023-2030)
Table 52 Middle East and Africa Pure-Electric School Bus Revenue (USD Million) By Applications (2023-2030)
Table 53 Research Programs/Design for This Report
Table 54 Key Data Information from Secondary Sources
Table 55 Key Data Information from Primary Sources
List of Figures
Figure 1 Market Scope
Figure 2 Porter’s Five Forces
Figure 3 Global Pure-Electric School Bus Revenue (USD Million) By Type (2018-2022)
Figure 4 Global Pure-Electric School Bus Revenue Market Share (%) By Type (2022)
Figure 5 Global Pure-Electric School Bus Revenue (USD Million) By Applications (2018-2022)
Figure 6 Global Pure-Electric School Bus Revenue Market Share (%) By Applications (2022)
Figure 7 Global Pure-Electric School Bus Market Revenue (USD Million) By Regions (2018-2022)
Figure 8 Global Pure-Electric School Bus Market Share (%) By Regions (2022)
Figure 9 North America Pure-Electric School Bus Revenue (USD Million) By Country (2018-2022)
Figure 10 North America Pure-Electric School Bus Revenue (USD Million) By Type (2018-2022)
Figure 11 North America Pure-Electric School Bus Revenue (USD Million) By Applications (2018-2022)
Figure 12 Europe Pure-Electric School Bus Revenue (USD Million) By Country (2018-2022)
Figure 13 Europe Pure-Electric School Bus Revenue (USD Million) By Type (2018-2022)
Figure 14 Europe Pure-Electric School Bus Revenue (USD Million) By Applications (2018-2022)
Figure 15 Asia Pacific Pure-Electric School Bus Revenue (USD Million) By Country (2018-2022)
Figure 16 Asia Pacific Pure-Electric School Bus Revenue (USD Million) By Type (2018-2022)
Figure 17 Asia Pacific Pure-Electric School Bus Revenue (USD Million) By Applications (2018-2022)
Figure 18 South America Pure-Electric School Bus Revenue (USD Million) By Country (2018-2022)
Figure 19 South America Pure-Electric School Bus Revenue (USD Million) By Type (2018-2022)
Figure 20 South America Pure-Electric School Bus Revenue (USD Million) By Applications (2018-2022)
Figure 21 Middle East and Africa Pure-Electric School Bus Revenue (USD Million) By Region (2018-2022)
Figure 22 Middle East and Africa Pure-Electric School Bus Revenue (USD Million) By Type (2018-2022)
Figure 23 Middle East and Africa Pure-Electric School Bus Revenue (USD Million) By Applications (2018-2022)
Figure 24 Global Pure-Electric School Bus Revenue (USD Million) By Type (2023-2030)
Figure 25 Global Pure-Electric School Bus Revenue Market Share (%) By Type (2030)
Figure 26 Global Pure-Electric School Bus Revenue (USD Million) By Applications (2023-2030)
Figure 27 Global Pure-Electric School Bus Revenue Market Share (%) By Applications (2030)
Figure 28 Global Pure-Electric School Bus Market Revenue (USD Million) By Regions (2023-2030)
Figure 29 North America Pure-Electric School Bus Revenue (USD Million) By Country (2023-2030)
Figure 30 North America Pure-Electric School Bus Revenue (USD Million) By Type (2023-2030)
Figure 31 North America Pure-Electric School Bus Revenue (USD Million) By Applications (2023-2030)
Figure 32 Europe Pure-Electric School Bus Revenue (USD Million) By Country (2023-2030)
Figure 33 Europe Pure-Electric School Bus Revenue (USD Million) By Type (2023-2030)
Figure 34 Europe Pure-Electric School Bus Revenue (USD Million) By Applications (2023-2030)
Figure 35 Asia Pacific Pure-Electric School Bus Revenue (USD Million) By Country (2023-2030)
Figure 36 Asia Pacific Pure-Electric School Bus Revenue (USD Million) By Type (2023-2030)
Figure 37 Asia Pacific Pure-Electric School Bus Revenue (USD Million) By Applications (2023-2030)
Figure 38 South America Pure-Electric School Bus Revenue (USD Million) By Country (2023-2030)
Figure 39 South America Pure-Electric School Bus Revenue (USD Million) By Type (2023-2030)
Figure 40 South America Pure-Electric School Bus Revenue (USD Million) By Applications (2023-2030)
Figure 41 Middle East and Africa Pure-Electric School Bus Revenue (USD Million) By Region (2023-2030)
Figure 42 Middle East and Africa Pure-Electric School Bus Revenue (USD Million) By Region (2023-2030)
Figure 43 Middle East and Africa Pure-Electric School Bus Revenue (USD Million) By Type (2023-2030)
Figure 44 Middle East and Africa Pure-Electric School Bus Revenue (USD Million) By Applications (2023-2030)
Figure 45 Bottom-Up and Top-Down Approaches for This Report
Figure 46 Data Triangulation
