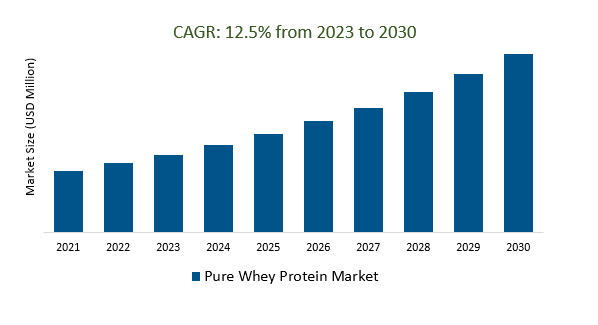
The Global Pure Whey Protein Market Size is estimated to register 12.5% growth over the forecast period from 2023 to 2030.
The market growth is driven by the increasing awareness about the benefits of protein consumption for muscle building, weight management, and overall health has been a significant driver for the pure whey protein market. Leading companies focusing on Clean and Sustainable Ingredients, Personalized Nutrition, Plant-Based Alternatives, Functional Ingredients, Health and Wellness Trends, Clean Meat and Cellular Agriculture, Research and Health Benefits, and others to boost market shares in the industry.
Market Overview
The pure whey protein market is characterized by high protein content, fast digestibility, and versatility in various forms, driven by increasing health and fitness awareness, demand for clean-label products, and growth in e-commerce. It faces challenges from the competition with plant-based proteins and price volatility, while trends include clean labeling, plant-based alternatives, functional ingredients, global expansion, and sustainability initiatives, with regulatory compliance being essential.
Market Dynamics
Market Trends- Companies are launching Clean Label and Transparency to attract a consumer base
Clean labels and transparency are significant trends in the pure whey protein market, driven by consumer demand for healthier and more natural products. Clean labeling involves using straightforward, easy-to-understand ingredient lists with minimal additives and artificial substances in whey protein products. Transparency means providing consumers with comprehensive information about the sourcing, production, and quality of the whey protein, fostering trust and confidence. Companies emphasizing these attributes are likely to attract health-conscious consumers seeking pure, minimally processed, and ethically sourced whey protein options, which can lead to increased market share and brand loyalty.
Market Driver- Functional Ingredients demand for efficient Pure Whey Protein Market
Functional ingredients are a growing trend in the pure whey protein market, where companies incorporate components like probiotics, vitamins, and minerals into whey protein products to enhance their health benefits. These additions appeal to health-conscious consumers seeking specific wellness goals, aligning with the broader interest in personalized nutrition and holistic health, and expanding the market's potential.
Market Opportunity-Introduction of Personalized Nutrition
Personalized nutrition is an emerging trend in the pure whey protein market, driven by the desire to cater to individual health and fitness goals. Companies are using data and technology to offer tailored whey protein products, customized based on factors like age, gender, dietary preferences, and fitness objectives. This approach allows consumers to optimize their protein intake for specific needs, such as muscle building, weight management, or overall well-being. The trend toward personalized nutrition enhances the market's appeal by offering a more individualized and targeted approach to dietary supplementation, potentially increasing consumer engagement and loyalty.
Market Share Analysis- Whey Protein Isolate Pure Whey Protein Market will register the fastest growth
The Global Pure Whey Protein Market is analyzed across Whey Protein Isolates, Whey Protein Concentrate, Whey Protein Hydrolysate, and others. Of these, Whey Protein Isolate registers the fastest growth. Whey Protein Isolate (WPI) is a prominent segment in the pure whey protein market, known for its high protein content and minimal fat and lactose. It caters to health-conscious consumers, particularly athletes and fitness enthusiasts, seeking a pure and fast-digesting protein source. WPI's popularity stems from its muscle-building and recovery benefits, making it a preferred choice in the health and fitness industry, and it's expected to continue growing as demand for high-quality protein options persists.
Market Share Analysis- Dietary Supplements held a significant market share in 2023
The Global Pure Whey Protein Market is analyzed across a wide range of applications including Dietary Supplements, Food, Nutraceuticals, Cosmetics, and others. Of these, Dietary Supplements held a significant market share in 2023. Dietary supplements are a pivotal component of the pure whey protein market, serving as convenient forms for consumers to incorporate whey protein into their diets. These supplements, available in various forms, cater to diverse consumer groups, including athletes, fitness enthusiasts, and those focused on overall health and wellness. Their importance lies in providing a practical means for individuals to meet their protein intake needs, supporting muscle growth, recovery, and general nutrition, thereby fueling market growth and product innovation.
Pure Whey Protein Market Segmentation
By Type
- Whey Protein Concentrate
- Whey Protein Isolate
- Whey Protein Hydrolysate
- Others
By Application
By Sales Channel
By Form
By Region
- North America (United States, Canada, Mexico)
- Europe (Germany, France, United Kingdom, Spain, Italy, Others)
- Asia Pacific (China, India, Japan, South Korea, Australia, Others)
- Latin America (Brazil, Argentina, Others)
- Middle East and Africa (Saudi Arabia, UAE, Kuwait, Other Middle East, South Africa, Nigeria, Other Africa)
Pure Whey Protein Market companies
- Lab door
- Murray
- NOW foods
- Royal FrieslandCampina N.V.
- Myprotein
- DMK Group
- Carbery Food Ingredients
- Davisco Foods International
- Arla Foods
- DMV International
- Hilmar Cheese Company
* List not exhaustive
Pure Whey Protein Market Outlook 2023
1 Market Overview
1.1 Introduction to the Pure Whey Protein Market
1.2 Scope of the Study
1.3 Research Objective
1.3.1 Key Market Scope and Segments
1.3.2 Players Covered
1.3.3 Years Considered
2 Executive Summary
2.1 2023 Pure Whey Protein Industry- Market Statistics
3 Market Dynamics
3.1 Market Drivers
3.2 Market Challenges
3.3 Market Opportunities
3.4 Market Trends
4 Market Factor Analysis
4.1 Porter’s Five Forces
4.2 Market Entropy
4.2.1 Global Pure Whey Protein Market Companies with Area Served
4.2.2 Products Offerings Global Pure Whey Protein Market
5 COVID-19 Impact Analysis and Outlook Scenarios
5.1.1 Covid-19 Impact Analysis
5.1.2 Post-COVID-19 Scenario- Low Growth Case
5.1.3 Post-COVID-19 Scenario- Reference Growth Case
5.1.4 Post-COVID-19 Scenario- Low Growth Case
6 Global Pure Whey Protein Market Trends
6.1 Global Pure Whey Protein Revenue (USD Million) and CAGR (%) by Type (2018-2030)
6.2 Global Pure Whey Protein Revenue (USD Million) and CAGR (%) by Applications (2018-2030)
6.3 Global Pure Whey Protein Revenue (USD Million) and CAGR (%) by Regions (2018-2030)
7 Global Pure Whey Protein Market Revenue (USD Million) by Type, and Applications (2018-2022)
7.1 Global Pure Whey Protein Revenue (USD Million) by Type (2018-2022)
7.1.1 Global Pure Whey Protein Revenue (USD Million), Market Share (%) by Type (2018-2022)
7.2 Global Pure Whey Protein Revenue (USD Million) by Applications (2018-2022)
7.2.1 Global Pure Whey Protein Revenue (USD Million), Market Share (%) by Applications (2018-2022)
8 Global Pure Whey Protein Development Regional Status and Outlook
8.1 Global Pure Whey Protein Revenue (USD Million) By Regions (2018-2022)
8.2 North America Pure Whey Protein Revenue (USD Million) by Type, and Application (2018-2022)
8.2.1 North America Pure Whey Protein Revenue (USD Million) by Country (2018-2022)
8.2.2 North America Pure Whey Protein Revenue (USD Million) by Type (2018-2022)
8.2.3 North America Pure Whey Protein Revenue (USD Million) by Applications (2018-2022)
8.3 Europe Pure Whey Protein Revenue (USD Million), by Type, and Applications (USD Million) (2018-2022)
8.3.1 Europe Pure Whey Protein Revenue (USD Million), by Country (2018-2022)
8.3.2 Europe Pure Whey Protein Revenue (USD Million) by Type (2018-2022)
8.3.3 Europe Pure Whey Protein Revenue (USD Million) by Applications (2018-2022)
8.4 Asia Pacific Pure Whey Protein Revenue (USD Million), and Revenue (USD Million) by Type, and Applications (2018-2022)
8.4.1 Asia Pacific Pure Whey Protein Revenue (USD Million) by Country (2018-2022)
8.4.2 Asia Pacific Pure Whey Protein Revenue (USD Million) by Type (2018-2022)
8.4.3 Asia Pacific Pure Whey Protein Revenue (USD Million) by Applications (2018-2022)
8.5 South America Pure Whey Protein Revenue (USD Million), by Type, and Applications (2018-2022)
8.5.1 South America Pure Whey Protein Revenue (USD Million), by Country (2018-2022)
8.5.2 South America Pure Whey Protein Revenue (USD Million) by Type (2018-2022)
8.5.3 South America Pure Whey Protein Revenue (USD Million) by Applications (2018-2022)
8.6 Middle East and Africa Pure Whey Protein Revenue (USD Million), by Type, Technology, Application, Thickness (2018-2022)
8.6.1 Middle East and Africa Pure Whey Protein Revenue (USD Million) by Country (2018-2022)
8.6.2 Middle East and Africa Pure Whey Protein Revenue (USD Million) by Type (2018-2022)
8.6.3 Middle East and Africa Pure Whey Protein Revenue (USD Million) by Applications (2018-2022)
9 Company Profiles
10 Global Pure Whey Protein Market Revenue (USD Million), by Type, and Applications (2023-2030)
10.1 Global Pure Whey Protein Revenue (USD Million) and Market Share (%) by Type (2023-2030)
10.1.1 Global Pure Whey Protein Revenue (USD Million), and Market Share (%) by Type (2023-2030)
10.2 Global Pure Whey Protein Revenue (USD Million) and Market Share (%) by Applications (2023-2030)
10.2.1 Global Pure Whey Protein Revenue (USD Million), and Market Share (%) by Applications (2023-2030)
11 Global Pure Whey Protein Development Regional Status and Outlook Forecast
11.1 Global Pure Whey Protein Revenue (USD Million) By Regions (2023-2030)
11.2 North America Pure Whey Protein Revenue (USD Million) by Type, and Applications (2023-2030)
11.2.1 North America Pure Whey Protein Revenue (USD) Million by Country (2023-2030)
11.2.2 North America Pure Whey Protein Revenue (USD Million), by Type (2023-2030)
11.2.3 North America Pure Whey Protein Revenue (USD Million), Market Share (%) by Applications (2023-2030)
11.3 Europe Pure Whey Protein Revenue (USD Million), by Type, and Applications (2023-2030)
11.3.1 Europe Pure Whey Protein Revenue (USD Million), by Country (2023-2030)
11.3.2 Europe Pure Whey Protein Revenue (USD Million), by Type (2023-2030)
11.3.3 Europe Pure Whey Protein Revenue (USD Million), by Applications (2023-2030)
11.4 Asia Pacific Pure Whey Protein Revenue (USD Million) by Type, and Applications (2023-2030)
11.4.1 Asia Pacific Pure Whey Protein Revenue (USD Million), by Country (2023-2030)
11.4.2 Asia Pacific Pure Whey Protein Revenue (USD Million), by Type (2023-2030)
11.4.3 Asia Pacific Pure Whey Protein Revenue (USD Million), by Applications (2023-2030)
11.5 South America Pure Whey Protein Revenue (USD Million), by Type, and Applications (2023-2030)
11.5.1 South America Pure Whey Protein Revenue (USD Million), by Country (2023-2030)
11.5.2 South America Pure Whey Protein Revenue (USD Million), by Type (2023-2030)
11.5.3 South America Pure Whey Protein Revenue (USD Million), by Applications (2023-2030)
11.6 Middle East and Africa Pure Whey Protein Revenue (USD Million), by Type, and Applications (2023-2030)
11.6.1 Middle East and Africa Pure Whey Protein Revenue (USD Million), by Region (2023-2030)
11.6.2 Middle East and Africa Pure Whey Protein Revenue (USD Million), by Type (2023-2030)
11.6.3 Middle East and Africa Pure Whey Protein Revenue (USD Million), by Applications (2023-2030)
12 Methodology and Data Sources
12.1 Methodology/Research Approach
12.1.1 Research Programs/Design
12.1.2 Market Size Estimation
12.1.3 Market Breakdown and Data Triangulation
12.2 Data Sources
12.2.1 Secondary Sources
12.2.2 Primary Sources
12.3 Disclaimer
List of Tables
Table 1 Market Segmentation Analysis
Table 2 Global Pure Whey Protein Market Companies with Areas Served
Table 3 Products Offerings Global Pure Whey Protein Market
Table 4 Low Growth Scenario Forecasts
Table 5 Reference Case Growth Scenario
Table 6 High Growth Case Scenario
Table 7 Global Pure Whey Protein Revenue (USD Million) And CAGR (%) By Type (2018-2030)
Table 8 Global Pure Whey Protein Revenue (USD Million) And CAGR (%) By Applications (2018-2030)
Table 9 Global Pure Whey Protein Revenue (USD Million) And CAGR (%) By Regions (2018-2030)
Table 10 Global Pure Whey Protein Revenue (USD Million) By Type (2018-2022)
Table 11 Global Pure Whey Protein Revenue Market Share (%) By Type (2018-2022)
Table 12 Global Pure Whey Protein Revenue (USD Million) By Applications (2018-2022)
Table 13 Global Pure Whey Protein Revenue Market Share (%) By Applications (2018-2022)
Table 14 Global Pure Whey Protein Market Revenue (USD Million) By Regions (2018-2022)
Table 15 Global Pure Whey Protein Market Share (%) By Regions (2018-2022)
Table 16 North America Pure Whey Protein Revenue (USD Million) By Country (2018-2022)
Table 17 North America Pure Whey Protein Revenue (USD Million) By Type (2018-2022)
Table 18 North America Pure Whey Protein Revenue (USD Million) By Applications (2018-2022)
Table 19 Europe Pure Whey Protein Revenue (USD Million) By Country (2018-2022)
Table 20 Europe Pure Whey Protein Revenue (USD Million) By Type (2018-2022)
Table 21 Europe Pure Whey Protein Revenue (USD Million) By Applications (2018-2022)
Table 22 Asia Pacific Pure Whey Protein Revenue (USD Million) By Country (2018-2022)
Table 23 Asia Pacific Pure Whey Protein Revenue (USD Million) By Type (2018-2022)
Table 24 Asia Pacific Pure Whey Protein Revenue (USD Million) By Applications (2018-2022)
Table 25 South America Pure Whey Protein Revenue (USD Million) By Country (2018-2022)
Table 26 South America Pure Whey Protein Revenue (USD Million) By Type (2018-2022)
Table 27 South America Pure Whey Protein Revenue (USD Million) By Applications (2018-2022)
Table 28 Middle East and Africa Pure Whey Protein Revenue (USD Million) By Region (2018-2022)
Table 29 Middle East and Africa Pure Whey Protein Revenue (USD Million) By Type (2018-2022)
Table 30 Middle East and Africa Pure Whey Protein Revenue (USD Million) By Applications (2018-2022)
Table 31 Financial Analysis
Table 32 Global Pure Whey Protein Revenue (USD Million) By Type (2023-2030)
Table 33 Global Pure Whey Protein Revenue Market Share (%) By Type (2023-2030)
Table 34 Global Pure Whey Protein Revenue (USD Million) By Applications (2023-2030)
Table 35 Global Pure Whey Protein Revenue Market Share (%) By Applications (2023-2030)
Table 36 Global Pure Whey Protein Market Revenue (USD Million), And Revenue (USD Million) By Regions (2023-2030)
Table 37 North America Pure Whey Protein Revenue (USD)By Country (2023-2030)
Table 38 North America Pure Whey Protein Revenue (USD Million) By Type (2023-2030)
Table 39 North America Pure Whey Protein Revenue (USD Million) By Applications (2023-2030)
Table 40 Europe Pure Whey Protein Revenue (USD Million) By Country (2023-2030)
Table 41 Europe Pure Whey Protein Revenue (USD Million) By Type (2023-2030)
Table 42 Europe Pure Whey Protein Revenue (USD Million) By Applications (2023-2030)
Table 43 Asia Pacific Pure Whey Protein Revenue (USD Million) By Country (2023-2030)
Table 44 Asia Pacific Pure Whey Protein Revenue (USD Million) By Type (2023-2030)
Table 45 Asia Pacific Pure Whey Protein Revenue (USD Million) By Applications (2023-2030)
Table 46 South America Pure Whey Protein Revenue (USD Million) By Country (2023-2030)
Table 47 South America Pure Whey Protein Revenue (USD Million) By Type (2023-2030)
Table 48 South America Pure Whey Protein Revenue (USD Million) By Applications (2023-2030)
Table 49 Middle East and Africa Pure Whey Protein Revenue (USD Million) By Region (2023-2030)
Table 50 Middle East and Africa Pure Whey Protein Revenue (USD Million) By Region (2023-2030)
Table 51 Middle East and Africa Pure Whey Protein Revenue (USD Million) By Type (2023-2030)
Table 52 Middle East and Africa Pure Whey Protein Revenue (USD Million) By Applications (2023-2030)
Table 53 Research Programs/Design for This Report
Table 54 Key Data Information from Secondary Sources
Table 55 Key Data Information from Primary Sources
List of Figures
Figure 1 Market Scope
Figure 2 Porter’s Five Forces
Figure 3 Global Pure Whey Protein Revenue (USD Million) By Type (2018-2022)
Figure 4 Global Pure Whey Protein Revenue Market Share (%) By Type (2022)
Figure 5 Global Pure Whey Protein Revenue (USD Million) By Applications (2018-2022)
Figure 6 Global Pure Whey Protein Revenue Market Share (%) By Applications (2022)
Figure 7 Global Pure Whey Protein Market Revenue (USD Million) By Regions (2018-2022)
Figure 8 Global Pure Whey Protein Market Share (%) By Regions (2022)
Figure 9 North America Pure Whey Protein Revenue (USD Million) By Country (2018-2022)
Figure 10 North America Pure Whey Protein Revenue (USD Million) By Type (2018-2022)
Figure 11 North America Pure Whey Protein Revenue (USD Million) By Applications (2018-2022)
Figure 12 Europe Pure Whey Protein Revenue (USD Million) By Country (2018-2022)
Figure 13 Europe Pure Whey Protein Revenue (USD Million) By Type (2018-2022)
Figure 14 Europe Pure Whey Protein Revenue (USD Million) By Applications (2018-2022)
Figure 15 Asia Pacific Pure Whey Protein Revenue (USD Million) By Country (2018-2022)
Figure 16 Asia Pacific Pure Whey Protein Revenue (USD Million) By Type (2018-2022)
Figure 17 Asia Pacific Pure Whey Protein Revenue (USD Million) By Applications (2018-2022)
Figure 18 South America Pure Whey Protein Revenue (USD Million) By Country (2018-2022)
Figure 19 South America Pure Whey Protein Revenue (USD Million) By Type (2018-2022)
Figure 20 South America Pure Whey Protein Revenue (USD Million) By Applications (2018-2022)
Figure 21 Middle East and Africa Pure Whey Protein Revenue (USD Million) By Region (2018-2022)
Figure 22 Middle East and Africa Pure Whey Protein Revenue (USD Million) By Type (2018-2022)
Figure 23 Middle East and Africa Pure Whey Protein Revenue (USD Million) By Applications (2018-2022)
Figure 24 Global Pure Whey Protein Revenue (USD Million) By Type (2023-2030)
Figure 25 Global Pure Whey Protein Revenue Market Share (%) By Type (2030)
Figure 26 Global Pure Whey Protein Revenue (USD Million) By Applications (2023-2030)
Figure 27 Global Pure Whey Protein Revenue Market Share (%) By Applications (2030)
Figure 28 Global Pure Whey Protein Market Revenue (USD Million) By Regions (2023-2030)
Figure 29 North America Pure Whey Protein Revenue (USD Million) By Country (2023-2030)
Figure 30 North America Pure Whey Protein Revenue (USD Million) By Type (2023-2030)
Figure 31 North America Pure Whey Protein Revenue (USD Million) By Applications (2023-2030)
Figure 32 Europe Pure Whey Protein Revenue (USD Million) By Country (2023-2030)
Figure 33 Europe Pure Whey Protein Revenue (USD Million) By Type (2023-2030)
Figure 34 Europe Pure Whey Protein Revenue (USD Million) By Applications (2023-2030)
Figure 35 Asia Pacific Pure Whey Protein Revenue (USD Million) By Country (2023-2030)
Figure 36 Asia Pacific Pure Whey Protein Revenue (USD Million) By Type (2023-2030)
Figure 37 Asia Pacific Pure Whey Protein Revenue (USD Million) By Applications (2023-2030)
Figure 38 South America Pure Whey Protein Revenue (USD Million) By Country (2023-2030)
Figure 39 South America Pure Whey Protein Revenue (USD Million) By Type (2023-2030)
Figure 40 South America Pure Whey Protein Revenue (USD Million) By Applications (2023-2030)
Figure 41 Middle East and Africa Pure Whey Protein Revenue (USD Million) By Region (2023-2030)
Figure 42 Middle East and Africa Pure Whey Protein Revenue (USD Million) By Region (2023-2030)
Figure 43 Middle East and Africa Pure Whey Protein Revenue (USD Million) By Type (2023-2030)
Figure 44 Middle East and Africa Pure Whey Protein Revenue (USD Million) By Applications (2023-2030)
Figure 45 Bottom-Up and Top-Down Approaches For This Report
Figure 46 Data Triangulation
