
The market growth is driven by an increasing adoption of contactless payment methods, including mobile wallets and contactless cards, which have become a prominent trend. QSRs are implementing technologies that allow customers to make seamless and secure transactions without physical contact, enhancing both speed and safety. Leading Companies focusing on, Innovative Technology Adoption, Focus on Sustainable Practices, Enhanced Customer Experience, and others to boost market shares in the industry.
The Quick Service Restaurants (QSR) market is characterized by a dynamic and rapidly evolving landscape, emphasizing speed, convenience, and affordability. Key trends include a significant shift toward digital transformation with online ordering, delivery services, and technology integration such as digital menus and contactless payments. QSRs are responding to health and sustainability concerns by diversifying menus with healthier options and implementing sustainable practices. The industry has witnessed global expansion, often through franchising models, and remains competitive with constant brand innovation and adaptation to evolving consumer preferences. Challenges include labor shortages and wage pressures, prompting the exploration of automation. The QSR market is highly responsive to emerging trends and consumer demands, balancing traditional offerings with innovative strategies to stay competitive in a rapidly changing environment.
The Quick Service Restaurants (QSRs) market is undergoing a transformative shift propelled by the digital revolution, intensifying convenience, personalization, and efficiency. The rise of online ordering and delivery platforms provides customers with unparalleled ease, allowing them to place orders effortlessly and receive prompt deliveries. QSRs are harnessing advanced technologies such as mobile apps, digital menu boards, and self-service kiosks to elevate customer experiences, fostering personalized interactions and streamlined operations. Integration of AI and data analytics further enhances personalization, tailoring menus and promotions to individual preferences. This digital evolution not only caters to a fast-paced lifestyle but also sparks innovation in marketing strategies and collaborations. As the QSR landscape evolves with digital advancements, brands are seizing the opportunity to lead, shaping a dynamic and competitive market driven by the ongoing digital revolution.
The growing emphasis on health awareness is transforming the Quick Service Restaurants (QSR) market, resulting in a significant increase in the demand for healthier menu choices. In response to shifting consumer preferences, QSR chains are strategically modifying their menus and refining marketing approaches. The upsurge in interest in nutritious options has led to the incorporation of salads, wraps, and plant-based alternatives into QSR menus. Furthermore, there is an increasing emphasis on transparent communication regarding ingredient sourcing and nutritional information. This trend mirrors a broader societal movement towards healthier lifestyles, compelling QSR brands to innovate and meet the evolving dietary expectations of their customer base. As health-conscious consumers continue to propel this demand, QSRs are navigating a landscape where finding the right balance between traditional favorites and healthier alternatives is crucial for sustained success.
The Quick Service Restaurant (QSR) market is undergoing a significant transformation, where the emphasis on sustainability and social responsibility has become a defining factor for success. This strategic focus on environmentally conscious practices and active community engagement is attracting both mindful consumers and investors. QSR brands are integrating sustainable sourcing methods, reducing reliance on single-use plastics, and implementing eco-friendly packaging to meet the increasing demand for environmentally responsible options. Additionally, initiatives centered around community involvement and partnerships with local causes are now fundamental components of QSR success narratives. As sustainability continues to influence consumer choices, QSRs are acknowledging the importance of adopting eco-friendly practices and making a positive societal impact, setting a new benchmark for success in this competitive market.
The Global Quick Service Restaurants Market is analyzed across Bakeries, Burger, Ice Cream, Meat Based Cuisines, Pizza, Other QSR Cuisine, and others. Pizza is poised to register the fastest growth. The Pizza Quick Service Restaurants (QSR) Market consists of establishments specializing in the rapid preparation and delivery of pizzas, targeting consumers seeking quick and convenient dining. Key players prioritize speedy service, diverse menu options, and innovative delivery methods to cater to on-the-go preferences. This market aligns with the broader trend in the food industry towards fast and accessible dining experiences, particularly focusing on the widely consumed pizza category.
The Global Quick Service Restaurants Market is analyzed across various structures including Independent Outlets, Chained Outlets, and others. Of these, Independent Outlets held a significant market share in 2023. The Independent Outlets Quick Service Restaurants (QSR) Market consists of standalone fast-food establishments not affiliated with major chains, prioritizing quick and efficient service. These outlets offer diverse and often localized menu options, targeting consumers seeking unique and authentic dining experiences. Market dynamics reflect the entrepreneurial approach of independent operators who emphasize quality, innovation, and community connections to distinguish themselves in the competitive QSR landscape. This market aligns with the growing consumer preference for local and independent food establishments, providing a personalized and distinctive dining experience.
By Cuisine
By Structure
By Region
*List not exhaustive
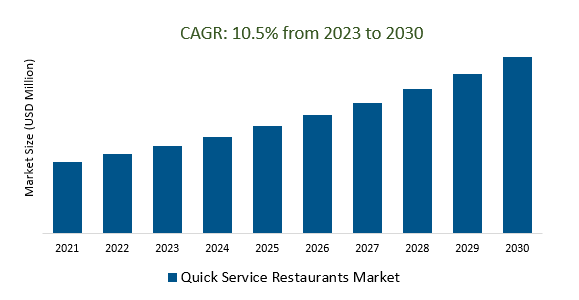
Quick Service Restaurants Market Outlook 2023
1 Market Overview
1.1 Introduction to the Quick Service Restaurants Market
1.2 Scope of the Study
1.3 Research Objective
1.3.1 Key Market Scope and Segments
1.3.2 Players Covered
1.3.3 Years Considered
2 Executive Summary
2.1 2023 Quick Service Restaurants Industry- Market Statistics
3 Market Dynamics
3.1 Market Drivers
3.2 Market Challenges
3.3 Market Opportunities
3.4 Market Trends
4 Market Factor Analysis
4.1 Porter’s Five Forces
4.2 Market Entropy
4.2.1 Global Quick Service Restaurants Market Companies with Area Served
4.2.2 Products Offerings Global Quick Service Restaurants Market
5 COVID-19 Impact Analysis and Outlook Scenarios
5.1.1 Covid-19 Impact Analysis
5.1.2 post-COVID-19 Scenario- Low Growth Case
5.1.3 post-COVID-19 Scenario- Reference Growth Case
5.1.4 post-COVID-19 Scenario- Low Growth Case
6 Global Quick Service Restaurants Market Trends
6.1 Global Quick Service Restaurants Revenue (USD Million) and CAGR (%) by Type (2018-2030)
6.2 Global Quick Service Restaurants Revenue (USD Million) and CAGR (%) by Applications (2018-2030)
6.3 Global Quick Service Restaurants Revenue (USD Million) and CAGR (%) by regions (2018-2030)
7 Global Quick Service Restaurants Market Revenue (USD Million) by Type, and Applications (2018-2022)
7.1 Global Quick Service Restaurants Revenue (USD Million) by Type (2018-2022)
7.1.1 Global Quick Service Restaurants Revenue (USD Million), Market Share (%) by Type (2018-2022)
7.2 Global Quick Service Restaurants Revenue (USD Million) by Applications (2018-2022)
7.2.1 Global Quick Service Restaurants Revenue (USD Million), Market Share (%) by Applications (2018-2022)
8 Global Quick Service Restaurants Development Regional Status and Outlook
8.1 Global Quick Service Restaurants Revenue (USD Million) By Regions (2018-2022)
8.2 North America Quick Service Restaurants Revenue (USD Million) by Type, and Application (2018-2022)
8.2.1 North America Quick Service Restaurants Revenue (USD Million) by Country (2018-2022)
8.2.2 North America Quick Service Restaurants Revenue (USD Million) by Type (2018-2022)
8.2.3 North America Quick Service Restaurants Revenue (USD Million) by Applications (2018-2022)
8.3 Europe Quick Service Restaurants Revenue (USD Million), by Type, and Applications (USD Million) (2018-2022)
8.3.1 Europe Quick Service Restaurants Revenue (USD Million), by Country (2018-2022)
8.3.2 Europe Quick Service Restaurants Revenue (USD Million) by Type (2018-2022)
8.3.3 Europe Quick Service Restaurants Revenue (USD Million) by Applications (2018-2022)
8.4 Asia Pacific Quick Service Restaurants Revenue (USD Million), and Revenue (USD Million) by Type, and Applications (2018-2022)
8.4.1 Asia Pacific Quick Service Restaurants Revenue (USD Million) by Country (2018-2022)
8.4.2 Asia Pacific Quick Service Restaurants Revenue (USD Million) by Type (2018-2022)
8.4.3 Asia Pacific Quick Service Restaurants Revenue (USD Million) by Applications (2018-2022)
8.5 South America Quick Service Restaurants Revenue (USD Million), by Type, and Applications (2018-2022)
8.5.1 South America Quick Service Restaurants Revenue (USD Million), by Country (2018-2022)
8.5.2 South America Quick Service Restaurants Revenue (USD Million) by Type (2018-2022)
8.5.3 South America Quick Service Restaurants Revenue (USD Million) by Applications (2018-2022)
8.6 Middle East and Africa Quick Service Restaurants Revenue (USD Million), by Type, Technology, Application, Thickness (2018-2022)
8.6.1 Middle East and Africa Quick Service Restaurants Revenue (USD Million) by Country (2018-2022)
8.6.2 Middle East and Africa Quick Service Restaurants Revenue (USD Million) by Type (2018-2022)
8.6.3 Middle East and Africa Quick Service Restaurants Revenue (USD Million) by Applications (2018-2022)
9 Company Profiles
10 Global Quick Service Restaurants Market Revenue (USD Million), by Type, and Applications (2023-2030)
10.1 Global Quick Service Restaurants Revenue (USD Million) and Market Share (%) by Type (2023-2030)
10.1.1 Global Quick Service Restaurants Revenue (USD Million), and Market Share (%) by Type (2023-2030)
10.2 Global Quick Service Restaurants Revenue (USD Million) and Market Share (%) by Applications (2023-2030)
10.2.1 Global Quick Service Restaurants Revenue (USD Million), and Market Share (%) by Applications (2023-2030)
11 Global Quick Service Restaurants Development Regional Status and Outlook Forecast
11.1 Global Quick Service Restaurants Revenue (USD Million) By Regions (2023-2030)
11.2 North America Quick Service Restaurants Revenue (USD Million) by Type, and Applications (2023-2030)
11.2.1 North America Quick Service Restaurants Revenue (USD) Million by Country (2023-2030)
11.2.2 North America Quick Service Restaurants Revenue (USD Million), by Type (2023-2030)
11.2.3 North America Quick Service Restaurants Revenue (USD Million), Market Share (%) by Applications (2023-2030)
11.3 Europe Quick Service Restaurants Revenue (USD Million), by Type, and Applications (2023-2030)
11.3.1 Europe Quick Service Restaurants Revenue (USD Million), by Country (2023-2030)
11.3.2 Europe Quick Service Restaurants Revenue (USD Million), by Type (2023-2030)
11.3.3 Europe Quick Service Restaurants Revenue (USD Million), by Applications (2023-2030)
11.4 Asia Pacific Quick Service Restaurants Revenue (USD Million) by Type, and Applications (2023-2030)
11.4.1 Asia Pacific Quick Service Restaurants Revenue (USD Million), by Country (2023-2030)
11.4.2 Asia Pacific Quick Service Restaurants Revenue (USD Million), by Type (2023-2030)
11.4.3 Asia Pacific Quick Service Restaurants Revenue (USD Million), by Applications (2023-2030)
11.5 South America Quick Service Restaurants Revenue (USD Million), by Type, and Applications (2023-2030)
11.5.1 South America Quick Service Restaurants Revenue (USD Million), by Country (2023-2030)
11.5.2 South America Quick Service Restaurants Revenue (USD Million), by Type (2023-2030)
11.5.3 South America Quick Service Restaurants Revenue (USD Million), by Applications (2023-2030)
11.6 Middle East and Africa Quick Service Restaurants Revenue (USD Million), by Type, and Applications (2023-2030)
11.6.1 Middle East and Africa Quick Service Restaurants Revenue (USD Million), by region (2023-2030)
11.6.2 Middle East and Africa Quick Service Restaurants Revenue (USD Million), by Type (2023-2030)
11.6.3 Middle East and Africa Quick Service Restaurants Revenue (USD Million), by Applications (2023-2030)
12 Methodology and Data Sources
12.1 Methodology/Research Approach
12.1.1 Research Programs/Design
12.1.2 Market Size Estimation
12.1.3 Market Breakdown and Data Triangulation
12.2 Data Sources
12.2.1 Secondary Sources
12.2.2 Primary Sources
12.3 Disclaimer
List of Tables
Table 1 Market Segmentation Analysis
Table 2 Global Quick Service Restaurants Market Companies with Areas Served
Table 3 Products Offerings Global Quick Service Restaurants Market
Table 4 Low Growth Scenario Forecasts
Table 5 Reference Case Growth Scenario
Table 6 High Growth Case Scenario
Table 7 Global Quick Service Restaurants Revenue (USD Million) And CAGR (%) By Type (2018-2030)
Table 8 Global Quick Service Restaurants Revenue (USD Million) And CAGR (%) By Applications (2018-2030)
Table 9 Global Quick Service Restaurants Revenue (USD Million) And CAGR (%) By Regions (2018-2030)
Table 10 Global Quick Service Restaurants Revenue (USD Million) By Type (2018-2022)
Table 11 Global Quick Service Restaurants Revenue Market Share (%) By Type (2018-2022)
Table 12 Global Quick Service Restaurants Revenue (USD Million) By Applications (2018-2022)
Table 13 Global Quick Service Restaurants Revenue Market Share (%) By Applications (2018-2022)
Table 14 Global Quick Service Restaurants Market Revenue (USD Million) By Regions (2018-2022)
Table 15 Global Quick Service Restaurants Market Share (%) By Regions (2018-2022)
Table 16 North America Quick Service Restaurants Revenue (USD Million) By Country (2018-2022)
Table 17 North America Quick Service Restaurants Revenue (USD Million) By Type (2018-2022)
Table 18 North America Quick Service Restaurants Revenue (USD Million) By Applications (2018-2022)
Table 19 Europe Quick Service Restaurants Revenue (USD Million) By Country (2018-2022)
Table 20 Europe Quick Service Restaurants Revenue (USD Million) By Type (2018-2022)
Table 21 Europe Quick Service Restaurants Revenue (USD Million) By Applications (2018-2022)
Table 22 Asia Pacific Quick Service Restaurants Revenue (USD Million) By Country (2018-2022)
Table 23 Asia Pacific Quick Service Restaurants Revenue (USD Million) By Type (2018-2022)
Table 24 Asia Pacific Quick Service Restaurants Revenue (USD Million) By Applications (2018-2022)
Table 25 South America Quick Service Restaurants Revenue (USD Million) By Country (2018-2022)
Table 26 South America Quick Service Restaurants Revenue (USD Million) By Type (2018-2022)
Table 27 South America Quick Service Restaurants Revenue (USD Million) By Applications (2018-2022)
Table 28 Middle East and Africa Quick Service Restaurants Revenue (USD Million) By Region (2018-2022)
Table 29 Middle East and Africa Quick Service Restaurants Revenue (USD Million) By Type (2018-2022)
Table 30 Middle East and Africa Quick Service Restaurants Revenue (USD Million) By Applications (2018-2022)
Table 31 Financial Analysis
Table 32 Global Quick Service Restaurants Revenue (USD Million) By Type (2023-2030)
Table 33 Global Quick Service Restaurants Revenue Market Share (%) By Type (2023-2030)
Table 34 Global Quick Service Restaurants Revenue (USD Million) By Applications (2023-2030)
Table 35 Global Quick Service Restaurants Revenue Market Share (%) By Applications (2023-2030)
Table 36 Global Quick Service Restaurants Market Revenue (USD Million), And Revenue (USD Million) By Regions (2023-2030)
Table 37 North America Quick Service Restaurants Revenue (USD)By Country (2023-2030)
Table 38 North America Quick Service Restaurants Revenue (USD Million) By Type (2023-2030)
Table 39 North America Quick Service Restaurants Revenue (USD Million) By Applications (2023-2030)
Table 40 Europe Quick Service Restaurants Revenue (USD Million) By Country (2023-2030)
Table 41 Europe Quick Service Restaurants Revenue (USD Million) By Type (2023-2030)
Table 42 Europe Quick Service Restaurants Revenue (USD Million) By Applications (2023-2030)
Table 43 Asia Pacific Quick Service Restaurants Revenue (USD Million) By Country (2023-2030)
Table 44 Asia Pacific Quick Service Restaurants Revenue (USD Million) By Type (2023-2030)
Table 45 Asia Pacific Quick Service Restaurants Revenue (USD Million) By Applications (2023-2030)
Table 46 South America Quick Service Restaurants Revenue (USD Million) By Country (2023-2030)
Table 47 South America Quick Service Restaurants Revenue (USD Million) By Type (2023-2030)
Table 48 South America Quick Service Restaurants Revenue (USD Million) By Applications (2023-2030)
Table 49 Middle East and Africa Quick Service Restaurants Revenue (USD Million) By Region (2023-2030)
Table 50 Middle East and Africa Quick Service Restaurants Revenue (USD Million) By Region (2023-2030)
Table 51 Middle East and Africa Quick Service Restaurants Revenue (USD Million) By Type (2023-2030)
Table 52 Middle East and Africa Quick Service Restaurants Revenue (USD Million) By Applications (2023-2030)
Table 53 Research Programs/Design for This Report
Table 54 Key Data Information from Secondary Sources
Table 55 Key Data Information from Primary Sources
List of Figures
Figure 1 Market Scope
Figure 2 Porter’s Five Forces
Figure 3 Global Quick Service Restaurants Revenue (USD Million) By Type (2018-2022)
Figure 4 Global Quick Service Restaurants Revenue Market Share (%) By Type (2022)
Figure 5 Global Quick Service Restaurants Revenue (USD Million) By Applications (2018-2022)
Figure 6 Global Quick Service Restaurants Revenue Market Share (%) By Applications (2022)
Figure 7 Global Quick Service Restaurants Market Revenue (USD Million) By Regions (2018-2022)
Figure 8 Global Quick Service Restaurants Market Share (%) By Regions (2022)
Figure 9 North America Quick Service Restaurants Revenue (USD Million) By Country (2018-2022)
Figure 10 North America Quick Service Restaurants Revenue (USD Million) By Type (2018-2022)
Figure 11 North America Quick Service Restaurants Revenue (USD Million) By Applications (2018-2022)
Figure 12 Europe Quick Service Restaurants Revenue (USD Million) By Country (2018-2022)
Figure 13 Europe Quick Service Restaurants Revenue (USD Million) By Type (2018-2022)
Figure 14 Europe Quick Service Restaurants Revenue (USD Million) By Applications (2018-2022)
Figure 15 Asia Pacific Quick Service Restaurants Revenue (USD Million) By Country (2018-2022)
Figure 16 Asia Pacific Quick Service Restaurants Revenue (USD Million) By Type (2018-2022)
Figure 17 Asia Pacific Quick Service Restaurants Revenue (USD Million) By Applications (2018-2022)
Figure 18 South America Quick Service Restaurants Revenue (USD Million) By Country (2018-2022)
Figure 19 South America Quick Service Restaurants Revenue (USD Million) By Type (2018-2022)
Figure 20 South America Quick Service Restaurants Revenue (USD Million) By Applications (2018-2022)
Figure 21 Middle East and Africa Quick Service Restaurants Revenue (USD Million) By Region (2018-2022)
Figure 22 Middle East and Africa Quick Service Restaurants Revenue (USD Million) By Type (2018-2022)
Figure 23 Middle East and Africa Quick Service Restaurants Revenue (USD Million) By Applications (2018-2022)
Figure 24 Global Quick Service Restaurants Revenue (USD Million) By Type (2023-2030)
Figure 25 Global Quick Service Restaurants Revenue Market Share (%) By Type (2030)
Figure 26 Global Quick Service Restaurants Revenue (USD Million) By Applications (2023-2030)
Figure 27 Global Quick Service Restaurants Revenue Market Share (%) By Applications (2030)
Figure 28 Global Quick Service Restaurants Market Revenue (USD Million) By Regions (2023-2030)
Figure 29 North America Quick Service Restaurants Revenue (USD Million) By Country (2023-2030)
Figure 30 North America Quick Service Restaurants Revenue (USD Million) By Type (2023-2030)
Figure 31 North America Quick Service Restaurants Revenue (USD Million) By Applications (2023-2030)
Figure 32 Europe Quick Service Restaurants Revenue (USD Million) By Country (2023-2030)
Figure 33 Europe Quick Service Restaurants Revenue (USD Million) By Type (2023-2030)
Figure 34 Europe Quick Service Restaurants Revenue (USD Million) By Applications (2023-2030)
Figure 35 Asia Pacific Quick Service Restaurants Revenue (USD Million) By Country (2023-2030)
Figure 36 Asia Pacific Quick Service Restaurants Revenue (USD Million) By Type (2023-2030)
Figure 37 Asia Pacific Quick Service Restaurants Revenue (USD Million) By Applications (2023-2030)
Figure 38 South America Quick Service Restaurants Revenue (USD Million) By Country (2023-2030)
Figure 39 South America Quick Service Restaurants Revenue (USD Million) By Type (2023-2030)
Figure 40 South America Quick Service Restaurants Revenue (USD Million) By Applications (2023-2030)
Figure 41 Middle East and Africa Quick Service Restaurants Revenue (USD Million) By Region (2023-2030)
Figure 42 Middle East and Africa Quick Service Restaurants Revenue (USD Million) By Region (2023-2030)
Figure 43 Middle East and Africa Quick Service Restaurants Revenue (USD Million) By Type (2023-2030)
Figure 44 Middle East and Africa Quick Service Restaurants Revenue (USD Million) By Applications (2023-2030)
Figure 45 Bottom-Up and Top-Down Approaches for This Report
Figure 46 Data Triangulation
By Cuisine
By Structure
By Region