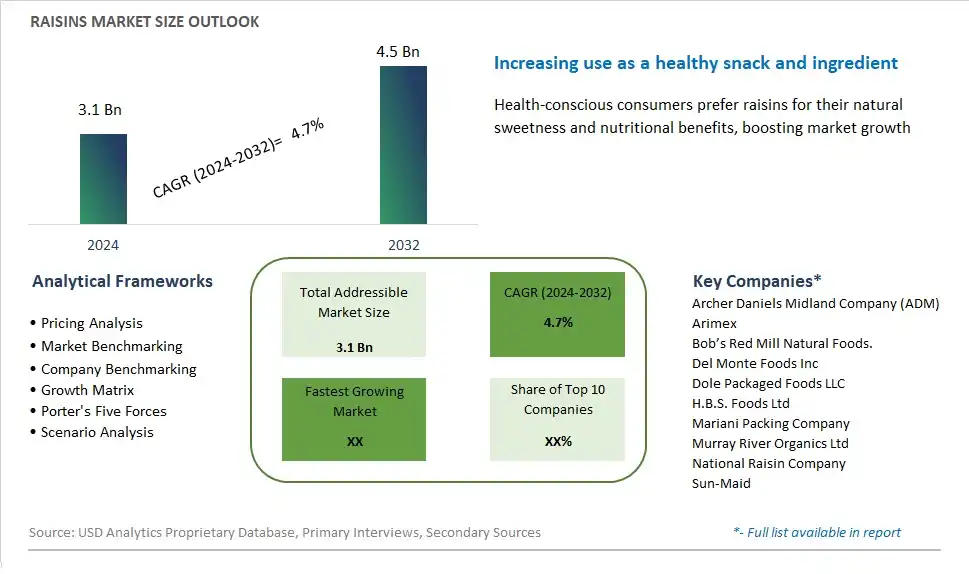
Global Raisins Market Size is valued at $3.1 Billion in 2024 and is forecast to register a growth rate (CAGR) of 4.7% to reach $4.5 Billion by 2032.
The global Raisins Market Comprehensive Study analyzes and forecasts the market size across 6 regions and 24 countries for diverse segments -By Nature (Organic, Conventional), By Product (Natural Seedless, Golden Seedless, Black Currant, Sultana, Muscat, Monukka), By Application (Households, Food Service Providers, Food)
An Introduction to Raisins Market
The raisins market in 2024 is experiencing robust growth, driven by increasing consumer awareness of the health benefits associated with dried fruits. Raisins, rich in vitamins, minerals, and antioxidants, are widely used as a healthy snack, in baking, and as a versatile ingredient in various cuisines. The market is also benefiting from the rising demand for natural and minimally processed foods. Key producers like the United States, Turkey, and Iran are focusing on improving yield quality and expanding their product offerings to meet diverse consumer preferences. Additionally, the growing trend of incorporating raisins into energy bars, cereals, and salads is further propelling market expansion.
Raisins Competitive Landscape
The market report analyses the leading companies in the industry including Archer Daniels Midland Company (ADM), Arimex, Bob’s Red Mill Natural Foods., Del Monte Foods Inc , Dole Packaged Foods LLC, H.B.S. Foods Ltd, Mariani Packing Company, Murray River Organics Ltd, National Raisin Company, Sun-Maid, and Others.
Raisins Market Dynamics
Raisins Market Trend: Increased Demand for Healthy Snacks and Natural Sweeteners
Raisins are experiencing a prominent market trend driven by the increased demand for healthy snacks and natural sweeteners. As consumers become more health-conscious, there is a growing preference for nutritious snack options that provide energy and satiety without compromising on taste. Raisins, being a natural source of vitamins, minerals, and antioxidants, align well with this trend, making them popular among health-conscious individuals seeking convenient and wholesome snack choices. Furthermore, the shift towards clean eating and the desire to reduce sugar intake have propelled the demand for natural sweeteners like raisins, which offer a flavorful alternative to processed sugars and artificial sweeteners.
Market Driver: Growth in the Food and Beverage Industry
The growth of the food and beverage industry serves as a significant market driver for raisins. Raisins are widely used as ingredients in various food products, including cereals, bakery items, confectionery, and trail mixes, due to their natural sweetness and nutritional benefits. As the food and beverage industry continues to expand globally, driven by factors such as population growth, urbanization, and changing dietary preferences, the demand for raisins as a versatile ingredient is expected to rise. Moreover, the increasing popularity of plant-based diets and the demand for clean label products further drive the incorporation of raisins into a wide range of food formulations, fueling market growth for this dried fruit.
Market Opportunity: Diversification into Functional Food and Beverage Segments
One potential opportunity for the raisin market lies in diversifying into functional food and beverage segments. With the growing focus on health and wellness, there is a rising demand for functional foods and beverages that offer specific health benefits beyond basic nutrition. Raisins, with their natural abundance of vitamins, minerals, and antioxidants, can be positioned as a functional ingredient in products targeting heart health, digestive wellness, and immune support, among other health concerns. By leveraging the nutritional properties of raisins and their versatility as an ingredient, manufacturers can capitalize on the trend towards functional foods and beverages, expanding their product offerings and catering to evolving consumer preferences for healthier and more functional food options.
Raisins Market Share Analysis: Conventional held the dominant market share in 2024
In the Raisins market segmented by nature, the Conventional segment is the largest, driven by its widespread availability, lower production costs, and broader consumer acceptance. Conventional raisins are produced using traditional farming methods and commonly used agricultural inputs, resulting in higher yields and lower production costs compared to organic counterparts. This translates to more competitive pricing for conventional raisins, making them accessible to a larger consumer base across various demographics and income levels. Additionally, conventional raisins have a longer history in the market and are more familiar to consumers, contributing to their higher demand and market share. Further, while organic raisins appeal to health-conscious consumers seeking pesticide-free and environmentally sustainable options, the conventional segment continues to dominate due to its affordability and widespread usage in various culinary applications, including baking, snacking, and confectionery. Furthermore, the scalability of conventional raisin production and the ability to meet global demand consistently reinforce its position as the largest segment in the Raisins market.
Raisins Market Share Analysis: Golden Seedless market is poised to register the fastest growth rae over the forecast period to 2032
In the Raisins market segmented by product, the Golden Seedless segment is the fastest-growing, driven by changing consumer preferences towards lighter-colored and sweeter-tasting raisins, coupled with their versatility in culinary applications and health benefits. Golden Seedless raisins are renowned for their appealing golden hue, which is naturally achieved through a careful drying process, retaining their vibrant color and natural sweetness. This variety of raisins appeals to consumers seeking healthier snack options and ingredients for both sweet and savory dishes. Further, Golden Seedless raisins are widely used in baking, breakfast cereals, salads, and trail mixes, expanding their market reach and demand. Additionally, the rising awareness of the health benefits associated with raisins, such as their high fiber content, antioxidants, and potential digestive health benefits, further drives the popularity and growth of the Golden Seedless segment. Furthermore, the Golden Seedless variety's versatility and ability to complement a wide range of recipes and flavor profiles contribute to its rapid growth in the Raisins market. Overall, the combination of appealing taste, color, and nutritional benefits positions Golden Seedless raisins as the fastest-growing segment, capturing the attention of consumers and driving market expansion.
Raisins Market Share Analysis: Households held the dominant market share in 2024
In the Raisins market segmented by application, the Households segment is the largest, driven by the widespread use of raisins as a versatile and nutritious ingredient in various home-cooked meals, snacks, and desserts. Raisins are a pantry staple in many households worldwide, valued for their natural sweetness, chewy texture, and nutritional benefits. They are commonly used in baking recipes such as cookies, cakes, and bread, as well as in breakfast dishes like oatmeal, cereal, and yogurt. Additionally, raisins are popular as standalone snacks, trail mix additions, and salad toppings, offering a convenient and healthy option for on-the-go consumption. Further, the versatility of raisins in both sweet and savory dishes appeals to consumers of all ages and dietary preferences, contributing to their consistent demand in household kitchens. Furthermore, the increasing awareness of raisins' health benefits, including their high fiber content, antioxidants, and energy-boosting properties, further reinforces their popularity among households as a wholesome and flavorful ingredient. Overall, the widespread usage and versatility of raisins in household cooking and snacking make the Households segment the largest and most dominant in the Raisins market.
Raisins Market Segmentation
By Nature
Organic
Conventional
By Product
Natural Seedless
Golden Seedless
Black Currant
Sultana
Muscat
Monukka
By Application
Households
Food Service Providers
Food
Countries Analyzed
North America (US, Canada, Mexico)
Europe (Germany, UK, France, Spain, Italy, Russia, Rest of Europe)
Asia Pacific (China, India, Japan, South Korea, Australia, South East Asia, Rest of Asia)
South America (Brazil, Argentina, Rest of South America)
Middle East and Africa (Saudi Arabia, UAE, Rest of Middle East, South Africa, Egypt, Rest of Africa)
Raisins Companies Profiled in the Study
Archer Daniels Midland Company (ADM)
Arimex
Bob’s Red Mill Natural Foods.
Del Monte Foods Inc
Dole Packaged Foods LLC
H.B.S. Foods Ltd
Mariani Packing Company
Murray River Organics Ltd
National Raisin Company
Sun-Maid
*- List Not Exhaustive
Chapter 1. TABLE OF CONTENTS
Chapter 2. Introduction to Raisins Market
2.1. Market Overview
2.2. Key Statistics and Report Highlights
2.3. Scope of the Comprehensive Study
2.3.1. Market Definition
2.3.2 Countries and Regions Covered
2.3.3 Research Objective
2.3.4 Units, Currency, and Conversions
2.3.5 Industry Value Chain
2.4. Key Market Segments
2.5. Key Companies
2.6. Study Period
Chapter 3. Strategic Analysis Review
3.1. Raisins Pricing Analysis and Forecast
3.2. Porter’s Five Forces
3.3. Market Ecosystem
3.4. SWOT Analysis
3.5. Regulatory Scenario
3.3. Effects of Inflation, Russia-Ukraine War, moderating economic growth, and other macroeconomic factors
Chapter 4. Competitive Landscape
4.1. Market Share Analysis
4.1.1. Global Raisins Market Share by Company, 2023
4.1.2. Product Offerings of Leading Raisins Companies
4.2. Market Entropy
4.2.1. New Product Launches in the Industry
4.2.2. Mergers, Acquisitions, Joint ventures, and Partnerships
4.3. Key Strategies and Best Practices
Chapter 5. Global Market Projections: Best, Reference, and Low Case Scenarios
5.1. Growth Analysis- Case Scenario Definitions
5.2. Low Growth Case Scenario Forecasts
5.3. Reference Growth Case Scenario Forecasts
5.4. High Growth Case Scenario Forecasts
Chapter 6. Market Dynamics
6.1. Raisins Market Drivers
6.2. Raisins Market Challenges
6.6. Raisins Market Opportunities
6.4. Raisins Market Trends
Chapter 7. Global Raisins Market Outlook Trends
7.1. Global Raisins Revenue (USD Million) and CAGR (%) by Type (2021-2032)
7.2. Global Raisins Revenue (USD Million) and CAGR (%) by Application (2021-2032)
7.3. Global Raisins Revenue (USD Million) and CAGR (%) by Product (2021-2032)
By Nature
Organic
Conventional
By Product
Natural Seedless
Golden Seedless
Black Currant
Sultana
Muscat
Monukka
By Application
Households
Food Service Providers
Food
Chapter 8. Global Raisins Regional Analysis and Outlook
8.1. Global Raisins Revenue (USD Million) By Regions (2021- 2032)
8.2. North America Raisins Revenue (USD Million) by Country (2021-2032)
8.2.1. United States Raisins Regional Analysis and Outlook
8.2.2. Canada Raisins Regional Analysis and Outlook
8.2.3. Mexico Raisins Regional Analysis and Outlook
8.3. Europe Raisins Revenue (USD Million), by Country (2021-2032)
8.3.1. Germany Raisins Regional Analysis and Outlook
8.3.2. France Raisins Regional Analysis and Outlook
8.3.3. United Kingdom Raisins Regional Analysis and Outlook
8.3.4. Spain Raisins Regional Analysis and Outlook
8.3.5. Italy Raisins Regional Analysis and Outlook
8.3.6. Russia Raisins Regional Analysis and Outlook
8.3.7. Rest of Europe Raisins Regional Analysis and Outlook
8.4. Asia Pacific Raisins Revenue (USD Million) by Country (2021-2032)
8.4.1. China Raisins Regional Analysis and Outlook
8.4.2. Japan Raisins Regional Analysis and Outlook
8.4.3. India Raisins Regional Analysis and Outlook
8.4.4. South Korea Raisins Regional Analysis and Outlook
8.4.5. Australia Raisins Regional Analysis and Outlook
8.4.6. South East Asia Raisins Regional Analysis and Outlook
8.4.7. Rest of Asia Pacific Raisins Regional Analysis and Outlook
8.5. South America Raisins Revenue (USD Million), by Country (2021-2032)
8.5.1. Brazil Raisins Regional Analysis and Outlook
8.5.2. Argentina Raisins Regional Analysis and Outlook
8.5.3. Rest of South America Raisins Regional Analysis and Outlook
8.6. Middle East and Africa Raisins Revenue (USD Million) by Country (2021-2032)
8.6.1. Middle East Raisins Regional Analysis and Outlook
8.6.2. Africa Raisins Regional Analysis and Outlook
Chapter 9. North America Raisins Analysis and Outlook
9.1. North America Raisins Revenue (USD Million) by Segments (2021-2032)
9.1.1. North America Raisins Revenue (USD Million) by Type (2021-2032)
9.1.2. North America Raisins Revenue (USD Million) by Application (2021-2032)
9.1.3. North America Raisins Revenue (USD Million) by Product (2021-2032)
By Nature
Organic
Conventional
By Product
Natural Seedless
Golden Seedless
Black Currant
Sultana
Muscat
Monukka
By Application
Households
Food Service Providers
Food
Chapter 10. Europe Raisins Analysis and Outlook
10.1. Europe Raisins Revenue (USD Million), by Segments (USD Million) (2021-2032)
10.1.1. Europe Raisins Revenue (USD Million) by Type (2021-2032)
10.1.2. Europe Raisins Revenue (USD Million) by Application (2021-2032)
10.1.3. Europe Raisins Revenue (USD Million) by Product (2021-2032)
By Nature
Organic
Conventional
By Product
Natural Seedless
Golden Seedless
Black Currant
Sultana
Muscat
Monukka
By Application
Households
Food Service Providers
Food
Chapter 11. Asia Pacific Raisins Analysis and Outlook
11.1. Asia Pacific Raisins Revenue (USD Million), and Revenue (USD Million) by Segments (2021-2032)
11.1.1. Asia Pacific Raisins Revenue (USD Million) by Type (2021-2032)
11.1.2. Asia Pacific Raisins Revenue (USD Million) by Application (2021-2032)
11.1.3. Asia Pacific Raisins Revenue (USD Million) by Product (2021-2032)
By Nature
Organic
Conventional
By Product
Natural Seedless
Golden Seedless
Black Currant
Sultana
Muscat
Monukka
By Application
Households
Food Service Providers
Food
Chapter 12. South America Raisins Analysis and Outlook
12.1. South America Raisins Revenue (USD Million), by Segments (2021-2032)
12.1.1. South America Raisins Revenue (USD Million) by Type (2021-2032)
12.1.2. South America Raisins Revenue (USD Million) by Application (2021-2032)
12.1.3. South America Raisins Revenue (USD Million) by Product (2021-2032)
By Nature
Organic
Conventional
By Product
Natural Seedless
Golden Seedless
Black Currant
Sultana
Muscat
Monukka
By Application
Households
Food Service Providers
Food
Chapter 13. Middle East and Africa Raisins Analysis and Outlook
13.1. Middle East and Africa Raisins Revenue (USD Million), by Segments (2021-2032)
13.1.1. Middle East and Africa Raisins Revenue (USD Million) by Type (2021-2032)
13.1.2. Middle East and Africa Raisins Revenue (USD Million) by Application (2021-2032)
13.1.3. Middle East and Africa Raisins Revenue (USD Million) by Product (2021-2032)
By Nature
Organic
Conventional
By Product
Natural Seedless
Golden Seedless
Black Currant
Sultana
Muscat
Monukka
By Application
Households
Food Service Providers
Food
Chapter 14. Raisins Company Profiles
14.1 Business Overview
14.2 Product Profiles
14.3 SWOT Profiles
14.5 Recent Developments
14.6 Financial Profile
List of Companies
Archer Daniels Midland Company (ADM)
Arimex
Bob’s Red Mill Natural Foods.
Del Monte Foods Inc
Dole Packaged Foods LLC
H.B.S. Foods Ltd
Mariani Packing Company
Murray River Organics Ltd
National Raisin Company
Sun-Maid
15. Methodology and Data Sources
15.1 Customization Offerings
15.2 Subscription Services
15.3 Related Reports
15.4 Publisher Expertise
LIST OF TABLES
Table 1 Market Segmentation Analysis
Table 2 Global Raisins Market Share of Leading Companies, 2023
Table 3 Product Offerings of Leading Companies
Table 4 Low Growth Scenario Forecasts
Table 5 Reference Case Growth Scenario
Table 6 High Growth Case Scenario
Table 7 Global Raisins Revenue (USD Million) And CAGR (%) By Type (2021-2032)
Table 8 Global Raisins Revenue (USD Million) And CAGR (%) By Application (2021-2032)
Table 9 Global Raisins Revenue (USD Million) And CAGR (%) By Product (2021-2032)
Table 10 Global Raisins Market Revenue (USD Million) By Regions (2021-2032)
Table 11 Global Raisins Market Share (%) By Regions (2021-2032)
Table 12 North America Raisins Revenue (USD Million) By Country (2021-2032)
Table 13 Europe Raisins Revenue (USD Million) By Country (2021-2032)
Table 14 Asia Pacific Raisins Revenue (USD Million) By Country (2021-2032)
Table 15 South America Raisins Revenue (USD Million) By Country (2021-2032)
Table 16 Middle East and Africa Raisins Revenue (USD Million) By Region (2021-2032)
Table 17 North America Raisins Revenue (USD Million) By Type (2021-2032)
Table 18 North America Raisins Revenue (USD Million) By Application (2021-2032)
Table 19 North America Raisins Revenue (USD Million) By Product (2021-2032)
Table 20 Europe Raisins Revenue (USD Million) By Type (2021-2032)
Table 21 Europe Raisins Revenue (USD Million) By Application (2021-2032)
Table 22 Europe Raisins Revenue (USD Million) By Product (2021-2032)
Table 23 Asia Pacific Raisins Revenue (USD Million) By Type (2021-2032)
Table 24 Asia Pacific Raisins Revenue (USD Million) By Application (2021-2032)
Table 25 Asia Pacific Raisins Revenue (USD Million) By Product (2021-2032)
Table 26 South America Raisins Revenue (USD Million) By Type (2021-2032)
Table 27 South America Raisins Revenue (USD Million) By Application (2021-2032)
Table 28 South America Raisins Revenue (USD Million) By Product (2021-2032)
Table 29 Middle East and Africa Raisins Revenue (USD Million) By Type (2021-2032)
Table 30 Middle East and Africa Raisins Revenue (USD Million) By Application (2021-2032)
Table 31 Middle East and Africa Raisins Revenue (USD Million) By Product (2021-2032)
LIST OF FIGURES
Figure 1. Market Scope
Figure 2. Pricing Forecasts Per Unit, 2023- 2032
Figure 3. Porter’s Five Forces
Figure 4. Global Raisins Market Revenue (USD Million) By Regions (2021-2032)
Figure 5. Global Raisins Market Share (%) By Regions (2023)
Figure 6. North America Raisins Revenue (USD Million) By Country (2021-2032)
Figure 7. United States Raisins Revenue (USD Million) By Country (2021-2032)
Figure 8. Canada Raisins Revenue (USD Million) By Country (2021-2032)
Figure 9. Mexico Raisins Revenue (USD Million) By Country (2021-2032)
Figure 10. Europe Raisins Revenue (USD Million) By Country (2021-2032)
Figure 11. Germany Raisins Revenue (USD Million) By Country (2021-2032)
Figure 12. France Raisins Revenue (USD Million) By Country (2021-2032)
Figure 13. United Kingdom Raisins Revenue (USD Million) By Country (2021-2032)
Figure 14. Spain Raisins Revenue (USD Million) By Country (2021-2032)
Figure 15. Italy Raisins Revenue (USD Million) By Country (2021-2032)
Figure 16. Russia Raisins Revenue (USD Million) By Country (2021-2032)
Figure 17. Rest of Europe Raisins Revenue (USD Million) By Country (2021-2032)
Figure 11. Asia Pacific Raisins Revenue (USD Million) By Country (2021-2032)
Figure 12. China Raisins Revenue (USD Million) By Country (2021-2032)
Figure 13. Japan Raisins Revenue (USD Million) By Country (2021-2032)
Figure 14. India Raisins Revenue (USD Million) By Country (2021-2032)
Figure 15. South Korea Raisins Revenue (USD Million) By Country (2021-2032)
Figure 16. Australia Raisins Revenue (USD Million) By Country (2021-2032)
Figure 17. South East Asia Raisins Revenue (USD Million) By Country (2021-2032)
Figure 18. South America Raisins Revenue (USD Million) By Country (2021-2032)
Figure 19. Brazil Raisins Revenue (USD Million) By Country (2021-2032)
Figure 20. Argentina Raisins Revenue (USD Million) By Country (2021-2032)
Figure 21. Rest of Asia Pacific Raisins Revenue (USD Million) By Country (2021-2032)
Figure 22. Middle East and Africa Raisins Revenue (USD Million) By Region (2021-2032)
Figure 23. Saudi Arabia Raisins Revenue (USD Million) By Region (2021-2032)
Figure 24. The UAE Raisins Revenue (USD Million) By Region (2021-2032)
Figure 25. Rest of Middle East Raisins Revenue (USD Million) By Region (2021-2032)
Figure 26. South Africa Raisins Revenue (USD Million) By Region (2021-2032)
Figure 27. Africa Raisins Revenue (USD Million) By Region (2021-2032)
Figure 28. North America Raisins Revenue (USD Million) By Type (2021-2032)
Figure 29. North America Raisins Revenue (USD Million) By Application (2021-2032)
Figure 30. North America Raisins Revenue (USD Million) By Product (2021-2032)
Figure 31. Europe Raisins Revenue (USD Million) By Type (2021-2032)
Figure 32. Europe Raisins Revenue (USD Million) By Application (2021-2032)
Figure 33. Europe Raisins Revenue (USD Million) By Product (2021-2032)
Figure 34. Asia Pacific Raisins Revenue (USD Million) By Type (2021-2032)
Figure 35. Asia Pacific Raisins Revenue (USD Million) By Application (2021-2032)
Figure 36. Asia Pacific Raisins Revenue (USD Million) By Product (2021-2032)
Figure 37. South America Raisins Revenue (USD Million) By Type (2021-2032)
Figure 38. South America Raisins Revenue (USD Million) By Application (2021-2032)
Figure 39. South America Raisins Revenue (USD Million) By Product (2021-2032)
Figure 40. Middle East and Africa Raisins Revenue (USD Million) By Type (2021-2032)
Figure 41. Middle East and Africa Raisins Revenue (USD Million) By Application (2021-2032)
Figure 42. Middle East and Africa Raisins Revenue (USD Million) By Product (2021-2032)
By Nature
Organic
Conventional
By Product
Natural Seedless
Golden Seedless
Black Currant
Sultana
Muscat
Monukka
By Application
Households
Food Service Providers
Food
Countries Analyzed
North America (US, Canada, Mexico)
Europe (Germany, UK, France, Spain, Italy, Russia, Rest of Europe)
Asia Pacific (China, India, Japan, South Korea, Australia, South East Asia, Rest of Asia)
South America (Brazil, Argentina, Rest of South America)
Middle East and Africa (Saudi Arabia, UAE, Rest of Middle East, South Africa, Egypt, Rest of Africa)
